
【总结】Echarts工艺大屏中的技术点
大屏制作中主要包含了Echarts的象形图、3D的柱状图、自定义图形。
1、象形图

1.1、自定义图形,可以是svg或者图片;
1.2、隐藏X、Y轴;
1.3、series为两个部分,一个是背景部分,一部分为数据填充部分,具体看代码;
const spirit = 'path://M150 0 L160 0 L170 10 L160 10 Z';
var maxData = 100;
option = {
tooltip: {
show: false
},
xAxis: {
max: maxData,
splitLine: { show: false },
offset: 10,
axisLine: { show: false },
axisLabel: { show: false }
},
yAxis: {
data: [],
inverse: true,
axisTick: { show: false },
axisLine: { show: false },
axisLabel: { show: false }
},
grid: {
top: 'center',
height: 200,
left: 70,
right: 100
},
series: [
{
current data
type: 'pictorialBar',
symbol: spirit,
symbolRepeat: 'fixed',
symbolMargin: '5%',
symbolClip: true,
color: 'red',
symbolSize: 10,
symbolBoundingData: maxData,
data: [32],
z: 10
},
{
full data
type: 'pictorialBar',
itemStyle: {
opacity: 0.2
},
label: {
show: false
},
animationDuration: 0,
symbolRepeat: 'fixed',
symbolMargin: '5%',
symbol: spirit,
symbolSize: 10,
symbolBoundingData: maxData,
data: [100],
z: 5
}
]
};
2、3D柱状图
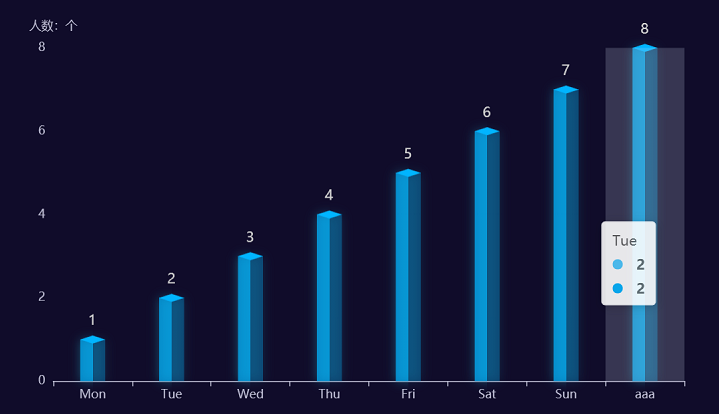
2.1、使用pictorialBar+bar绘制
主要是一个bar柱子,使用渐变色,然后增加一个pictorialBar盖子,最终结合为一个柱状图。
option = {
tooltip: {
trigger: 'axis',
axisPointer: {
type: 'shadow'
}
},
grid: {
left: '5%',
right: '5%',
bottom: '5%',
top: '10%',
containLabel: true
},
xAxis: {
type: 'category',
data: ['Mon', 'Tue', 'Wed', 'Thu', 'Fri', 'Sat', 'Sun', 'aaa'],
nameTextStyle: {
color: "#fff"
},
},
yAxis: {
type: 'value',
name: "人数:个",
splitLine: {
show: false,
},
},
series: [{
type: 'bar',
barWidth: 25,
stack: '1',
barCategoryGap: 8,
data: [1,2,3,4,5,6,7,8],
color: '#fff',
itemStyle: { // 柱体渐变色
color: {
type: 'linear',
x: 0,
x2: 1,
y: 0,
y2: 0,
colorStops: [
offset: 0, color: 'rgba(1, 180, 255, 0.7)' },
offset: 0.5, color: 'rgba(1, 180, 255, 0.7)' },
offset: 0.5, color: 'rgba(1, 180, 255, 0.3)' },
offset: 1, color: 'rgba(1, 180, 255, 0.3)' }
]
},
shadowColor: 'rgba(37, 179, 208, 0.6)',
shadowBlur: 10
},
label: {
normal: {
show: true,
position: [8, -25],
fontSize: 14,
},
},
},
{
type: 'pictorialBar',
symbolSize: [25, 8],
symbol: 'diamond',
这个属性很重要,直接决定了顶部跟柱子是否契合
symbolOffset: [0, -4],
z: 12,
itemStyle: { color: 'rgba(1, 180, 255, 1)' },
symbolPosition: 'end',
data: [1,2,3,4,5,6,7,8],
}],
};
2.2、使用custom进行绘制
需要绘制柱状图,通过绘制3个面,最终结合形成3D柱状图。
<template>
ref="chartRef" :style="{ width, height }"></div>
</template>
setup lang="ts">
import { reactive, ref, watch, type Ref } from "vue"
import { useECharts } from '/@/hooks/web/useEcharts';
import { getDays } from '../utils';
import type { EChartsOption } from 'echarts';
const chartRef = ref<HTMLDivElement | null>(null);
const { setOptions, echarts } = useECharts(chartRef as Ref<HTMLDivElement>);
let linearArr = [
",
",
",
"#003efa",
"#0099e4",
"#4a9df7",
31, 117, 0.3)",
153, 228, 0.3)",
]
const threeDimensionalLine = (offsetX = 20, sliderWidth = 12, offsetTick = 14) => {
绘制左侧面
const CubeLeft = echarts.graphic.extendShape({
shape: {
x: 0,
y: 0,
},
buildPath: function (ctx, shape) {
会canvas的应该都能看得懂,shape是从custom传入的
const xAxisPoint = shape.xAxisPoint
const c0 = [shape.x - offsetTick, shape.y]
const c1 = [shape.x - offsetTick + offsetX, shape.y]
const c2 = [xAxisPoint[0] - offsetTick + offsetX, xAxisPoint[1]]
const c3 = [xAxisPoint[0] - offsetTick, xAxisPoint[1]]
ctx
c0[1])
c1[1])
c2[1])
c3[1])
.closePath()
},
})
绘制右侧面
const CubeRight = echarts.graphic.extendShape({
shape: {
x: 0,
y: 0,
},
buildPath: function (ctx, shape) {
const xAxisPoint = shape.xAxisPoint
const c1 = [shape.x - offsetTick + offsetX, shape.y]
const c2 = [shape.x - offsetTick + offsetX + sliderWidth, shape.y - sliderWidth]
const c3 = [
- offsetTick + offsetX + sliderWidth,
- sliderWidth,
]
const c4 = [shape.x - offsetTick + offsetX, xAxisPoint[1]]
ctx
c1[1])
c2[1])
c3[1])
c4[1])
.closePath()
},
})
绘制顶面
const CubeTop = echarts.graphic.extendShape({
shape: {
x: 0,
y: 0,
},
buildPath: function (ctx, shape) {
const c1 = [shape.x - offsetTick, shape.y]
const c2 = [shape.x - offsetTick + offsetX, shape.y] // 右点
const c3 = [shape.x - offsetTick + offsetX + sliderWidth, shape.y - sliderWidth]
const c4 = [shape.x - offsetTick + sliderWidth, shape.y - sliderWidth]
ctx
c1[1])
c2[1])
c3[1])
c4[1])
c1[1])
.closePath()
},
})
const CubeBottom = echarts.graphic.extendShape({
shape: {
x: 0,
y: 0,
},
buildPath: function (ctx, shape) {
const xAxisPoint = shape.xAxisPoint
const c1 = [xAxisPoint[0] - offsetTick, xAxisPoint[1]]
const c2 = [xAxisPoint[0] - offsetTick, xAxisPoint[1] + 6] // 右点
const c3 = [xAxisPoint[0] - offsetTick + offsetX + sliderWidth, xAxisPoint[1] + 6]
const c4 = [xAxisPoint[0] - offsetTick + offsetX + sliderWidth, xAxisPoint[1] - 6]
const c5 = [xAxisPoint[0] - offsetTick + offsetX, xAxisPoint[1]]
ctx
c1[1])
c2[1])
c3[1])
c4[1])
c5[1])
c1[1])
.closePath()
},
})
注册三个面图形
CubeLeft)
CubeRight)
CubeTop)
CubeBottom)
}
interface dataType {
xAxisData: string[] | number[];
barData: number[];
}
const dataList = reactive<dataType>({
xAxisData: [],
barData: []
});
/**
@Description 近12个月成品库产量图
@date 2023-07-04
@param {any} dataList:{xAxisData:any;barData:any;}
@returns {any}
*/
const getStaticsBarOptions = (dataList: { xAxisData: string[] | number[]; barData: number[]; }) => {
return {
textStyle: {
fontFamily: "PingFang",
},
grid: {
left: '5%',
right: '2%',
top: 50,
bottom: 30,
containLabel: true,
},
xAxis: {
type: 'category',
data: dataList.xAxisData,
axisLabel: {
color: '#fff'
},
axisLine: {
lineStyle: {
color: '#fff'
}
},
axisTick: {
alignWithLabel: true
},
axisPointer: {
type: 'shadow',
label: {
color: '#000'
}
},
nameTextStyle: {
color: '#fff'
}
},
yAxis: {
type: 'value',
name: '数量(个)',
axisLabel: {
formatter: '{value}',
color: '#fff'
},
splitLine: {
show: false
},
nameTextStyle: {
color: '#fff'
}
},
tooltip: {
trigger: 'axis',
textStyle: {
fontSize: '22'
},
axisPointer: {
type: 'cross',
crossStyle: {
color: '#999'
}
},
formatter: function (params: any) {
return `
<div>${params[0].name}</div>
${params[0].value} 个</div>
`
},
},
series: [
{
type: "bar",
label: {
normal: {
show: true,
position: [22, -30],
fontSize: 14,
color: "#fff",
},
},
itemStyle: {
color: "transparent",
},
data: dataList.barData,
},
{
type: "custom",
renderItem: (params: any, api: { coord: (arg0: any[]) => any; value: (arg0: number) => any; }) => {
const location = api.coord([api.value(0), api.value(1)])
return {
type: "group",
children: [
{
type: "CubeLeft",
shape: {
api,
xValue: api.value(0),
yValue: api.value(1),
x: location[0],
y: location[1],
xAxisPoint: api.coord([api.value(0), 0]),
},
style: {
fill: new echarts.graphic.LinearGradient(0, 0, 0, 1, [
{
offset: 0,
color: linearArr[0],
},
{
offset: 1,
color: linearArr[1],
},
]),
},
},
{
type: "CubeRight",
shape: {
api,
xValue: api.value(0),
yValue: api.value(1),
x: location[0],
y: location[1],
xAxisPoint: api.coord([api.value(0), 0]),
},
style: {
fill: new echarts.graphic.LinearGradient(0, 0, 0, 1, [
{
offset: 0,
color: linearArr[2],
},
{
offset: 1,
color: linearArr[3],
},
]),
},
},
{
type: "CubeTop",
shape: {
api,
xValue: api.value(0),
yValue: api.value(1),
x: location[0],
y: location[1],
xAxisPoint: api.coord([api.value(0), 0]),
},
style: {
fill: new echarts.graphic.LinearGradient(0, 0, 0, 1, [
{
offset: 0,
color: linearArr[4],
},
{
offset: 1,
color: linearArr[5],
},
]),
},
},
{
type: "CubeBottom",
shape: {
api,
xValue: api.value(0),
yValue: api.value(1),
x: location[0],
y: location[1],
xAxisPoint: api.coord([api.value(0), 0]),
},
style: {
fill: new echarts.graphic.LinearGradient(0, 0, 0, 1, [
{
offset: 0,
color: linearArr[6],
},
{
offset: 1,
color: linearArr[7],
},
]),
},
},
],
}
},
data: dataList.barData,
},
],
}
};
const props = defineProps({
data: {
type: Array,
default: () => {
return [];
}
},
width: {
type: String,
default: '100%'
},
height: {
type: String,
default: '300px'
}
});
watch(
=> props.data,
async (newVal) => {
= await getDays(12, 'month', 'YYYY-MM');
= newVal as unknown as number[];
await threeDimensionalLine();
const options = await getStaticsBarOptions(dataList);
as EChartsOption, false);
},
immediate: true }
);
</script>

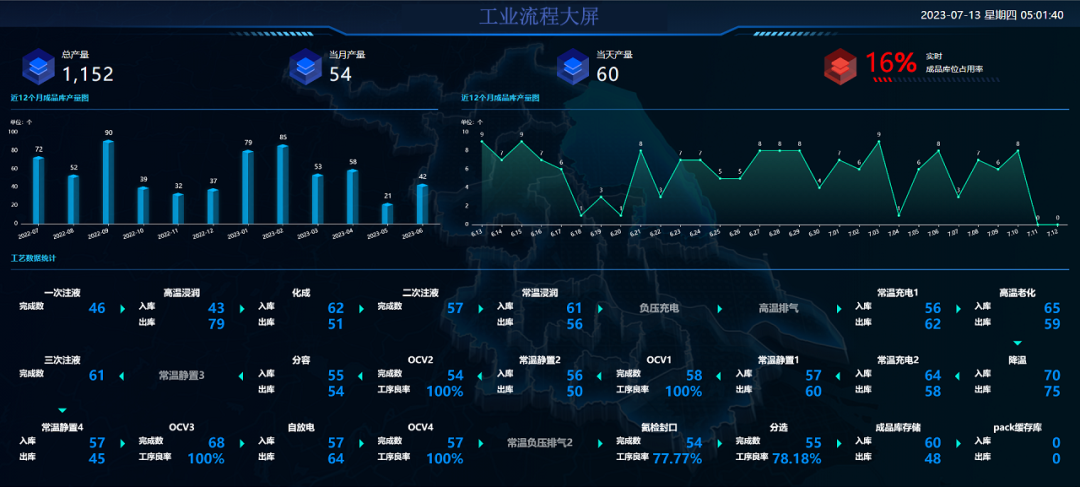
3、工艺流程图
通过分析,可以看出来可以分为两个部分,工艺卡片和箭头指向,工艺卡片中又可以分为:底图、文字信息等。
1.1、组合数据
        export const formatCraftData = (


          list: {


            id: string;


            name: string;


            inCount: number;


            outCount: number;


            complete: number;


            rate: number;


          }[]


        ) => {


          const craft = [];


          const arrow = [];


          let rollback = true;


          let yLoopIndex = -1;


          for (let i = 0; i < list.length; i++) {


            const element = list[i];


            const remainder = i % RowIndex;


            if (remainder === 0) {


              yLoopIndex++;


              rollback = !rollback;


            }


            const xLoopIndex = rollback ? RowIndex - remainder : remainder + 1;


            const log = [


              Math.round((halfGAPx + (CraftW + GAPx) * (xLoopIndex - 1)) * 1000) / 1000,


              H - Math.round((halfGAPy + (CraftH + GAPy) * yLoopIndex) * 1000) / 1000


            ];


            const item = [


              'craft',


              ...log,


              element.id,


              element.name,


              element.inCount,


              element.outCount,


              element,


              element.complete,


              element.rate


            ];


            craft.push(item);


            if (remainder === RowIndex - 1) {


              const log = [


                Math.round((halfGAPx + CraftW / 2 + (CraftW + GAPx) * (rollback ? 0 : remainder)) * 1000) /


                  1000,


                H - Math.round((halfGAPy + CraftH + (CraftH + GAPy) * yLoopIndex) * 1000) / 1000


              ];


              arrow.push(['arrow', ...log, 'B']);


            } else {


              if (yLoopIndex % 2 === 0) {


                const log = [


                  Math.round((halfGAPx + CraftW + (CraftW + GAPx) * remainder) * 1000) / 1000,


                  H - Math.round((halfGAPy + CraftH / 2 + (CraftH + GAPy) * yLoopIndex) * 1000) / 1000


                ];


                arrow.push(['arrow', ...log, 'R']);


              } else {


                const log = [


                  Math.round((halfGAPx + CraftW + GAPx + (CraftW + GAPx) * remainder) * 1000) / 1000,


                  H - Math.round((halfGAPy + CraftH / 2 + (CraftH + GAPy) * yLoopIndex) * 1000) / 1000


                ];


                arrow.push(['arrow', ...log, 'L']);


              }


            }


          }


          arrow.pop();


          return {


            craft,


            arrow


          };


        };
1.2
、绘制卡片
        function renderCraftItem(_param, api) {


          const [logX, logY, name, inCount, outCount, complete, rate] = [


            api.value(1),


            api.value(2),


            api.value(4), // name


            api.value(5), // 入库


            api.value(6), // 出库


            // api.value(7),


            api.value(8), // 完成数


            api.value(9) // 工序良率


          ];


          const [x, y] = api.coord([logX, logY]);


          const [w, h] = api.size([1, 1]);


          const _W = CraftW * w;


          const _H = CraftH * h;


          const px = 2 * w;


          const py = 5 * h;


          // 创建虚线样式


          const lineDash = [3, 8];


          // 创建纹理图像


          const textureImage = new Image();


          textureImage.src = '/public/bg.png'; // 替换为你的纹理图像路径


          if(dashData.includes(name)) {


            textureImage.src = '/public/bg-no.png'; // 替换为你的纹理图像路径


          }


          // 创建纹理图案


          const img = {


            type: 'image',


            style: {


              image: textureImage,


              x: x,


              y: y,


              width: _W,


              height: _H


            }


          }


          const rect = {


            type: 'rect',


            shape: {


              x: x,


              y: y,


              width: _W,


              height: _H


            },


            style: {


              fill: 'rgba(255, 255, 255, 0)',


              shadowBlur: 1 * w,


              shadowOffsetX: 0,


              shadowOffsetY: 0,


              shadowColor: 'rgba(196, 200, 229, 1)'


            }


          };


          if (dashData.includes(name)) {


            rect.style.lineDash = lineDash;


          }


          let labelText = [];


          let value: any[] = [];


          if (craftClassifyA.includes(name)) {


            labelText = ['完成数', '工序良率'];


            value = [complete, rate || 0];


          } else if (craftClassifyB.includes(name)) {


            labelText = ['完成数'];


            value = [complete];


          } else {


            labelText = ['入库', '出库'];


            value = [inCount, outCount];


          }


          let children = [];


          const color = craftClassifyA.includes(name) && rate <= WARNNUM ? 'red' : '#fff';


          if (dashData.includes(name)) {


            children = [


              img,


              rect,


              {


                type: 'text',


                x: x + _W / 2,


                y: y + 50,


                style: {


                  text: name,


                  font: `bolder 22px sans-serif`,


                  fill: '#ffffff96',


                  stroke: '#fff',


                  textAlign: 'center'


                }


              }


            ];


          } else {


            children = [


              img,


              rect,


              getText(x + _W / 2, y + py + 5, name, 20, 'center', color),


              getText(x + px, y + 20 * h, labelText[0], 18, 'left', color),


              getText(x + _W - px, y + 20 * h, value[0] || 0, 30, 'right', '#008BFF')


            ];


            if (labelText[1]) {


              const val = `${value[1] || 0}${craftClassifyA.includes(name) ? '%' : ''}`;


              children = [


                ...children,


                getText(x + px, y + 35 * h, labelText[1], 18, 'left', color),


                getText(x + _W - px, y + 35 * h, val, 30, 'right', '#008BFF')


              ];


            }


          }


          return {


            type: 'group',


            children: children


          };


        }


          function getText(


          x: number,


          y: number,


          text: string | number,


          textSize: number,


          textAlign: 'center' | 'left' | 'right' = 'center',


          color: string


        ) {


          return {


            type: 'text',


            x: x,


            y: y,


            style: {


              text: text,


              font: `bolder ${textSize}px PingFangSC-Semibold`,


              fill: color,


              stroke: color,


              textAlign: textAlign


            }


          };


        }
1.1
、
绘制箭头
        function renderArrowItem(_param, api) {


          const [X, Y, DIRECTION] = [


            api.value(1) as number,


            api.value(2) as number,


            api.value(3) as 'R' | 'T' | 'L' | 'B'


          ];


          const [x, y] = api.coord([X, Y]);


          const newX = DIRECTION === 'L' ? x - 10 : x + 10


          return {


            type: 'path',


            x: newX,


            y: DIRECTION === 'R' ? y - 10 : y + 10,


            rotation: (Math.PI / 2) * ArrowDire[DIRECTION],


            shape: {


              pathData: 'path://M0 0 L0 20 L10 10 Z'


            },


            style: {


              fill: '#00EEDA'


            }


          };


        }
1.1
、组合卡片,形成options
        export const getOptions = (data: {


          craft: (string | number | any)[][];


          arrow: (string | number | any)[][];


        }) => {


          return {


            tooltip: {


              backgroundColor: 'rgba(255,255,255,0.9)',


              extraCssText: 'min-width: 200px;',


              textStyle: {


                color: '#333'


              }


            },


            geo: {


              show: true, // 是否显示地理坐标系组件


              left: 0,


              right: 0,


              top: 0,


              bottom: 0,


              roam: false, // 是否开启鼠标缩放和平移漫游


              zoom: 1,


              scaleLimit: {


                max: 1,


                min: 1


              },


              silent: true, // 图形是否不响应和触发鼠标事件


              itemStyle: {


                color: 'rgba(0,0,0,0)',


                borderWidth: 0


              },


              map: 'CraftMap', // 使用 registerMap 注册的地图名称


              center: [100, 100]


            },


            series: [


              {


                type: 'custom',


                coordinateSystem: 'geo',


                geoIndex: 0,


                renderItem: renderCraftItem,


                data: data.craft,


                tooltip: {


                  show: false,


                  confine: true,


                  textStyle: {


                    fontSize: '22'


                  },


                  formatter: function (params: any) {


                    const [name, inCount, outCount, complete, rate, cuur] = [


                      params.value[4], // name


                      params.value[5], // 入库


                      params.value[6], // 出库


                      params.value[8], // 完成数


                      params.value[9], // 工序良率


                      params.value[7] // 当前


                    ];


                    let labelText = [];


                    if (craftClassifyA.includes(name)) {


                      labelText = ['完成数', '工序良率'];


                    } else {


                      labelText = ['入库', '出库'];


                    }


                    let HTML = `<div>${name}</div>`;


                    if (inCount || inCount === 0) {


                      HTML = HTML + `<div>${labelText[0]}: ${inCount}</div>`;


                    }


                    if (outCount || outCount === 0) {


                      HTML = HTML + `<div>${labelText[1]}: ${outCount}</div>`;


                    }


                    if (complete || complete === 0) {


                      HTML = HTML + `<div>${labelText[0]}: ${complete}</div>`;


                    }


                    if (rate || rate === 0) {


                      HTML = HTML + `<div>${labelText[1]}: ${rate}%</div>`;


                    }


                    return HTML;


                  }


                }


              },


              {


                type: 'custom',


                coordinateSystem: 'geo',


                geoIndex: 0,


                renderItem: renderArrowItem,


                data: data.arrow,


                tooltip: {


                  show: false


                }


              }


            ]


          } as EChartsOption;


        };

评论