
Python matplotlib绘制散点图

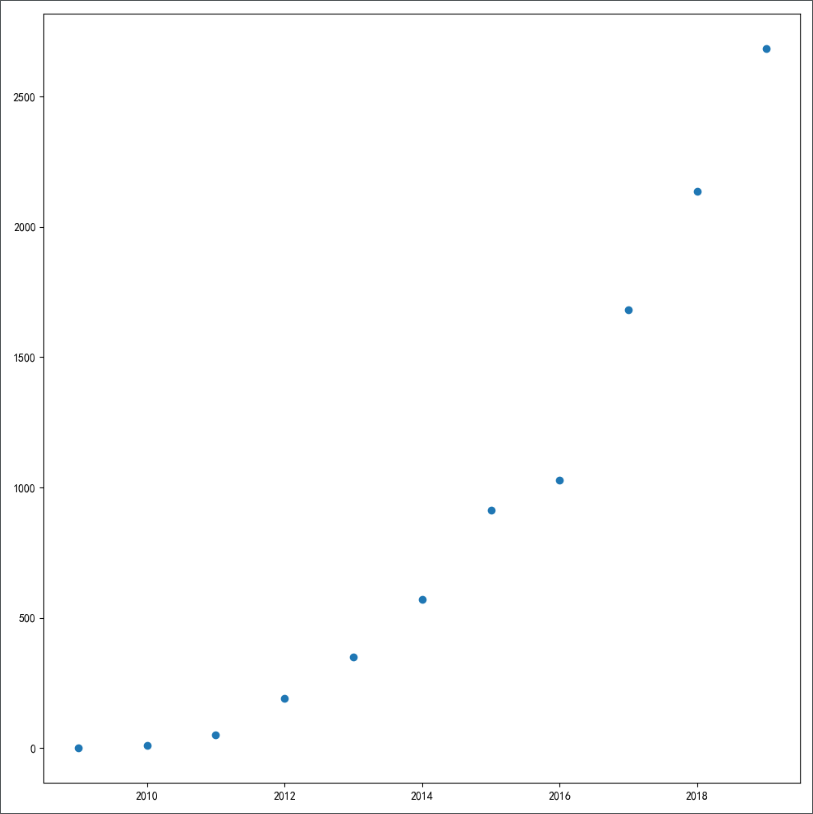
一、matplotlib绘制散点图
# coding=utf-8import matplotlib.pyplot as pltyears = [2009, 2010, 2011, 2012, 2013, 2014, 2015, 2016, 2017, 2018, 2019]turnovers = [0.5, 9.36, 52, 191, 350, 571, 912, 1027, 1682, 2135, 2684]plt.figure(figsize=(10, 10), dpi=100)plt.scatter(years, turnovers)plt.show()
二、matplotlib优化散点图
import matplotlib.pyplot as pltyears = [2009, 2010, 2011, 2012, 2013, 2014, 2015, 2016, 2017, 2018, 2019]turnovers = [0.5, 9.36, 52, 191, 350, 571, 912, 1027, 1682, 2135, 2684]plt.figure(figsize=(10, 15), dpi=100)plt.scatter(years, turnovers, c='red', s=100, label='成交额')plt.xticks(range(2008, 2020, 1))plt.yticks(range(0, 3200, 200))plt.xlabel("年份", fontdict={'size': 16})plt.ylabel("成交额", fontdict={'size': 16})plt.title("历年天猫双11总成交额", fontdict={'size': 20})plt.legend(loc='best')plt.show()

三、matplotlib散点图区分点的颜色和大小
import matplotlib.pyplot as pltimport numpy as npyears = [2009, 2010, 2011, 2012, 2013, 2014, 2015, 2016, 2017, 2018, 2019]turnovers = [0.5, 9.36, 52, 191, 350, 571, 912, 1027, 1682, 2135, 2684]plt.figure(figsize=(10, 15), dpi=100)size = list()for tur in turnovers:size.append(tur) if tur > 100 else size.append(100)plt.xticks(range(2008, 2020, 1))plt.yticks(range(0, 3200, 200))plt.scatter(years, turnovers, c=np.random.randint(0, 50, 11), s=size)plt.xlabel("年份", fontdict={'size': 16})plt.ylabel("成交额", fontdict={'size': 16})plt.title("历年天猫双11总成交额", fontdict={'size': 20})plt.show()

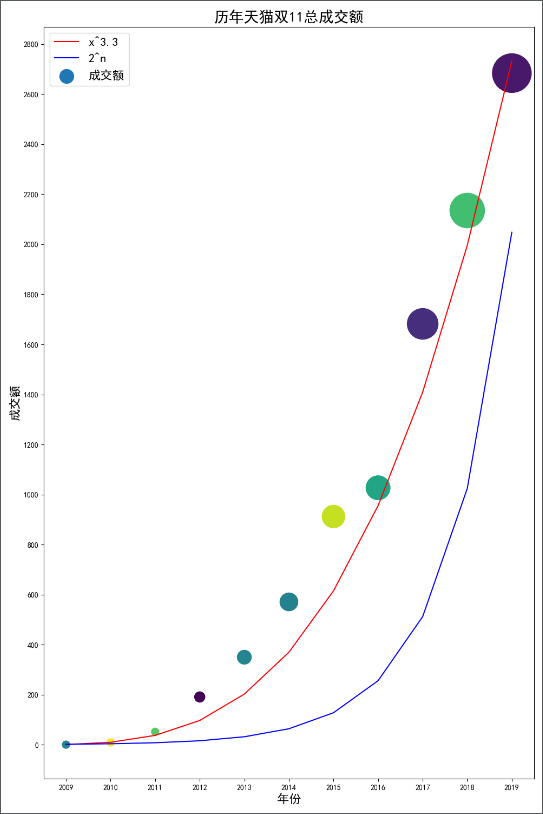
pip install numpy -i https://pypi.tuna.tsinghua.edu.cn/simple四、matplotlib散点图的趋势简单分析
import matplotlib.pyplot as pltimport numpy as npimport mathyears = [2009, 2010, 2011, 2012, 2013, 2014, 2015, 2016, 2017, 2018, 2019]turnovers = [0.5, 9.36, 52, 191, 350, 571, 912, 1027, 1682, 2135, 2684]squares = [math.pow(year-2008, 3.3) for year in years]powers = [math.pow(2, year-2008) for year in years]plt.figure(figsize=(10, 15), dpi=100)size = list()for tur in turnovers:size.append(tur) if tur > 100 else size.append(100)plt.xticks(range(2008, 2020, 1))plt.yticks(range(0, 3200, 200))plt.scatter(years, turnovers, c=np.random.randint(0, 50, 11), s=size, label='成交额')plt.plot(years, squares, color='red', label='x^3.3')plt.plot(years, powers, color='blue', label='2^n')plt.legend(loc='best', fontsize=16, markerscale=0.5)plt.xlabel("年份", fontdict={'size': 16})plt.ylabel("成交额", fontdict={'size': 16})plt.title("历年天猫双11总成交额", fontdict={'size': 20})plt.show()
评论