基于OpenCV实现海岸线变化检测
点击上方“小白学视觉”,选择加"星标"或“置顶”
重磅干货,第一时间送达

海岸是一个动态系统,其中因侵蚀现象导致的海岸线后退、或是由众多因素如气象,地质,生物和人类活动所导致线前进的是常见现象。
在海洋磨损作用大于沉积物的情况下,有明显的海岸侵蚀,我们称之为地球表面的崩解和破坏。

资料来源:弗林德斯大学(CC0)
本文的目标
在本文中,我们将对Landsat 8平台上的OLI(陆地成像仪)传感器获取的卫星图像使用Canny Edge Detection算法。
通过这种方法,我们将能够可视化的估计特定欧洲地区遭受强腐蚀作用的海岸线随时间的推移:霍德内斯海岸。

一下是处理流程:
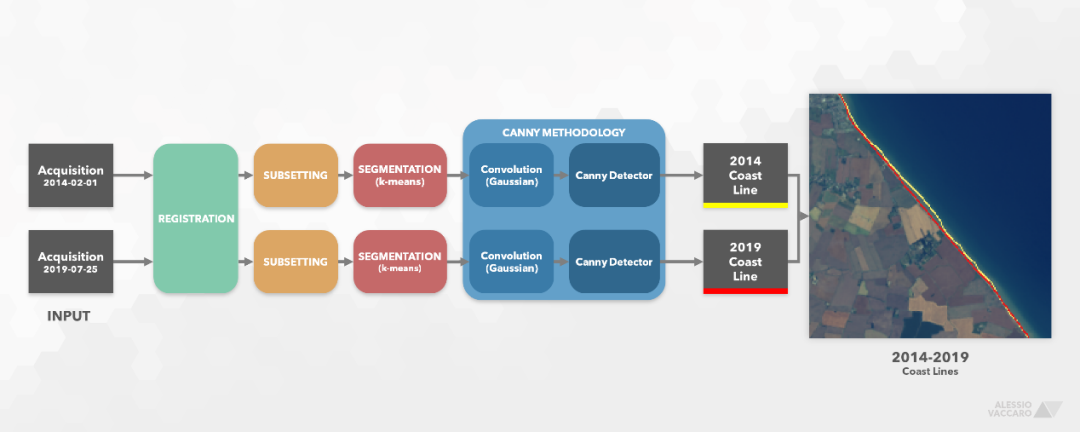
处理流程
在开始之前让我们先介绍一下OLI数据...
0.关于Landsat OLI数据的简要介绍
Landsat 8是一个轨道平台,安装在称为OLI(陆地成像仪)的11波段多光谱传感器上。
具体来说,在本文中,我们将仅使用分辨率为30米(即前7个)的波段。

美国地质调查局陆地卫星8号
该数据可以免费下载,注册后,获得USGS:https://earthexplorer.usgs.gov/。
而且,通常我摸并不使用入射太阳光作为原始数据,而是使用反射率,即从地球表面反射的太阳光量[0-1]。
1.包导入
在各种常见的包,我们将使用rasterio处理图像,利用OpenCV中的Canny 算法和Scikit-Learn分割图像。
from glob import globimport numpy as npimport rasterioimport json, re, itertools, osimport matplotlib.pyplot as pltimport cv2 as cvfrom sklearn import preprocessingfrom sklearn.cluster import KMeans
2.数据导入
让我们定义一个变量,该变量告诉我们要保留的波段数以及在JSON中输入的辅助数据:
N_OPTICS_BANDS = 7with open("bands.json","r") as bandsJson:bandsCharacteristics = json.load(bandsJson)
这个Json是Landsat OLI成像仪的信息集合。类似于一种说明手册:
# bands.json[{'id': '1', 'name': 'Coastal aerosol', 'span': '0.43-0.45', 'resolution': '30'},{'id': '2', 'name': 'Blue', 'span': '0.45-0.51', 'resolution': '30'},{'id': '3', 'name': 'Green', 'span': '0.53-0.59', 'resolution': '30'},{'id': '4', 'name': 'Red', 'span': '0.64-0.67', 'resolution': '30'},{'id': '5', 'name': 'NIR', 'span': '0.85-0.88', 'resolution': '30'},{'id': '6', 'name': 'SWIR 1', 'span': '1.57-1.65', 'resolution': '30'},{'id': '7', 'name': 'SWIR 2', 'span': '2.11-2.29', 'resolution': '30'},{'id': '8', 'name': 'Panchromatic', 'span': '0.50-0.68', 'resolution': '15'},{'id': '9', 'name': 'Cirrus', 'span': '1-36-1.38', 'resolution': '30'},{'id': '10', 'name': 'TIRS 1', 'span': '10.6-11.9', 'resolution': '100'},{'id': '11', 'name': 'TIRS 2', 'span': '11.50-12.51', 'resolution': '100'}]
bands.json文件包含有关我们将要使用的频段的所有有用信息。
注意,我们将仅使用分辨率为30 m的频段,因此仅使用前7个频段。如果您愿意使用较低的分辨率(100m),则也可以嵌入TIRS 1和TIRS 2频段。
正如上面几行已经提到的那样,我们将使用从Landsat-8 OLI上获取两组不同的数据:
• 2014/02/01
• 2019/07/25
为了简化两次采集的所需操作,我们将定义一个Acquisition()类,其中将封装所有必要的函数。
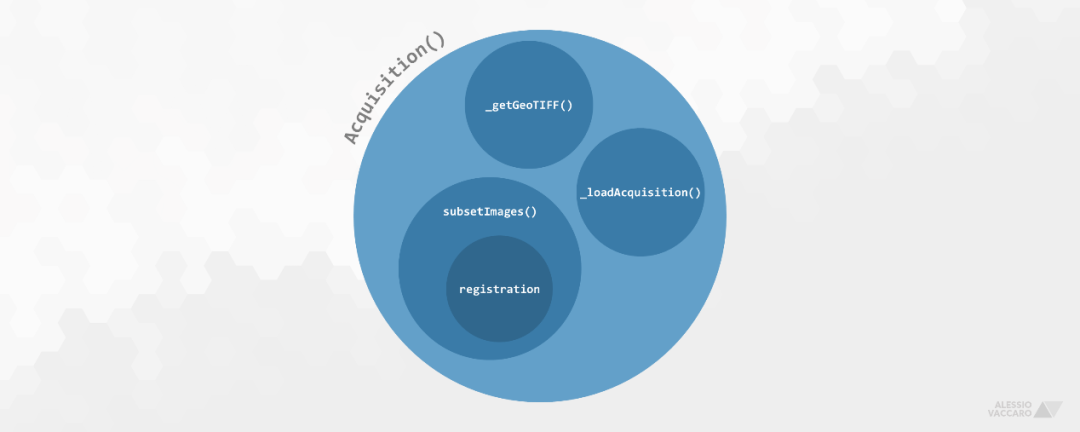
在执行代码期间,我们能够执行一些基础支持性的功能,例如:
• 在指定路径中搜索GeoTIFF;
• 加载采购;
• 购置登记 (调整);
• 收购子集
class Acquisition:def __init__(self, path, ext, nOpticsBands):self.nOpticsBands = nOpticsBandsself._getGeoTIFFs(path, ext)self.images = self._loadAcquisition()def _getGeoTIFFs(self, path, ext):# It searches for GeoTIFF files within the folder.print("Searching for '%s' files in %s" % (ext, path))self.fileList = glob(os.path.join(path,"*."+ext))self.opticsFileList = [ [list(filter(re.compile(r"band%s\."%a).search, self.fileList))[0] for a in range(1,self.nOpticsBands+1)]print("Found %d 'tif' files" % len(self.opticsFileList))def _loadAcquisition(self):# It finally reads and loads selected images into arrays.print("Loading images")self.loads = [rasterio.open(bandPath) for bandPath in self.opticsFileList]images = [load.read()[0] for load in self.loads]print("Done")return imagesdef subsetImages(self, w1, w2, h1, h2, leftBound):# This function subsets images according the defined sizes.print("Subsetting images (%s:%s, %s:%s)" % (w1, w2, h1, h2))cols = (self.loads[0].bounds.left - leftBound)/30registered = [np.insert(band,np.repeat(0,cols),0,axis=1) for band in self.images]subset = [band[w1:w2,h1:h2] for band in registered]print("Done")return subset
好的,让我们现在开始启动整个代码:
DATES = ["2014-02-01", "2019-07-25"]acquisitionsObjects = []for date in DATES:singleAcquisitionObject = Acquisition("Data/"+date, "tif", N_OPTICS_BANDS)acquisitionsObjects.append( singleAcquisitionObject )
运行结果如下:
Searching for 'tif' files in Data/2014-02-01
Found 7 'tif' files
Loading images
Done
Searching for 'tif' files in Data/2019-07-25
Found 7 'tif' files
Loading images
Done
现在我们已加载了14张OLI图像(在7个波段中各采集2个)。
2.1 子集多光谱立方体
在这个阶段中,先对两个多光谱立方体进行“对齐”(或正式注册),再切出不感兴趣的部分。
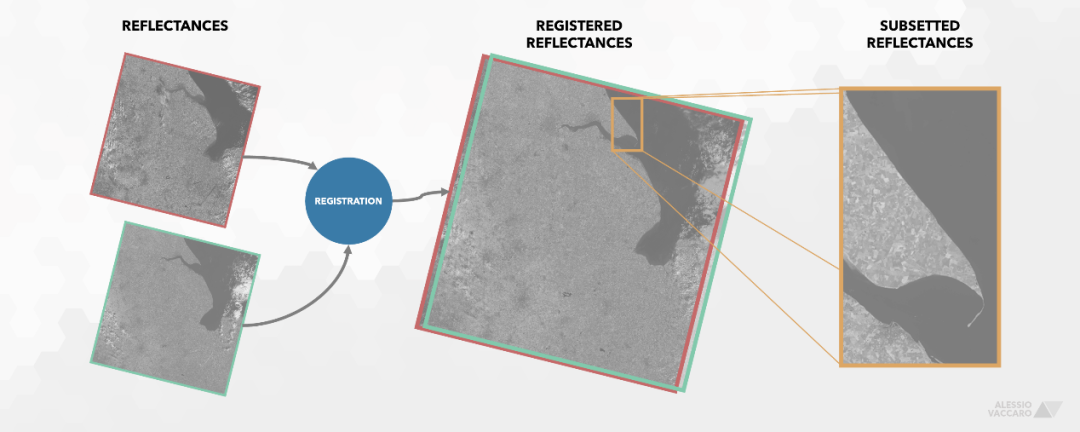
我们可以使用ImageImages()函数“剪切”不需要的数据。
因此,我们定义AOI(感兴趣的区域),并使用Acquisition()类中的subsetImages()函数进行设置:
W1, W2 = 950, 2300H1, H2 = 4500, 5300subAcquisitions = [acquisition.subsetImages(W1, W2, H1, H2, 552285.0) for acquisition in acquisitionsObjects].
完成!
3.数据探索
3.1可视化多光谱立方体
让我们尝试查看2019/07/25收购的所有范围。出于纯粹的美学原因,在绘制图像之前,让我们使用
StandardScaler()对图像进行标准化。
axs = range(N_OPTICS_BANDS)fig, axs = plt.subplots(2, 4, figsize=(15,12))axs = list(itertools.chain.from_iterable(axs))for b in range(N_OPTICS_BANDS):id_ = bandsCharacteristics[b]["id"]name_ = bandsCharacteristics[b]["name"]span_ = bandsCharacteristics[b]["span"]resolution_ = bandsCharacteristics[b]["resolution"]title = "%s - %s\n%s (%s m)" % (id_, name_, span_, resolution_)axs[b].imshow(preprocessing.StandardScaler().fit_transform(subAcquisitions[1][b]), cmap="Greys_r")axs[b].set_title(title); axs[b].set_xticklabels([]); axs[b].set_yticklabels([])plt.axis("off"); plt.tight_layout(w_pad=-10); plt.show()
以下是运行结果。
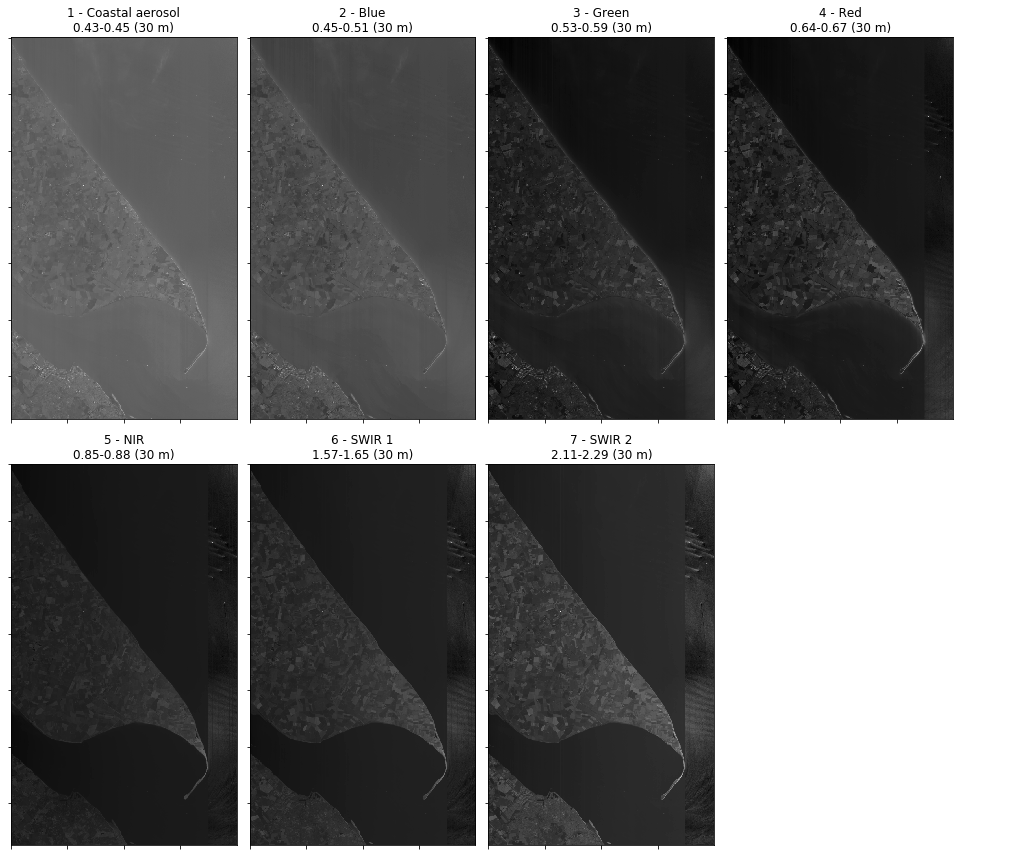
这些图中,有些波段比其他波段更亮。这很正常。
3.2可视化复合RGB中的多光谱立方体
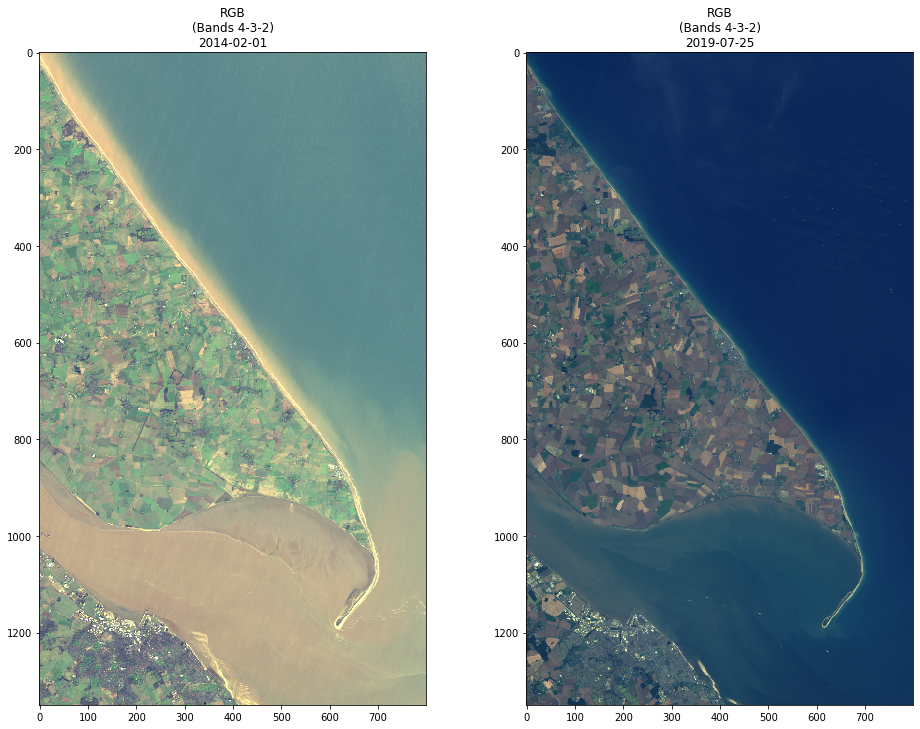
现在,让我们尝试可视化使用波段4(红色),3(绿色)和2(蓝色)获得的RGB复合图像中的两次采集。
定义BIAS和GAIN 仅是为了获得更好的效果。
BIAS = 1.5GAIN = [2.3,2.4,1.4]r1 = (subAcquisitions[0][3] - subAcquisitions[0][3].min()) / (subAcquisitions[0][3].max()-subAcquisitions[0][3].min()) * GAIN[0] * BIASg1 = (subAcquisitions[0][2] - subAcquisitions[0][2].min()) / (subAcquisitions[0][2].max()-subAcquisitions[0][2].min()) * GAIN[1] * BIASb1 = (subAcquisitions[0][1] - subAcquisitions[0][1].min()) / (subAcquisitions[0][1].max()-subAcquisitions[0][1].min()) * GAIN[2] * BIASr2 = (subAcquisitions[1][3] - subAcquisitions[1][3].min()) / (subAcquisitions[1][3].max()-subAcquisitions[1][3].min()) * GAIN[0] * BIASg2 = (subAcquisitions[1][2] - subAcquisitions[1][2].min()) / (subAcquisitions[1][2].max()-subAcquisitions[1][2].min()) * GAIN[1] * BIASb2 = (subAcquisitions[1][1] - subAcquisitions[1][1].min()) / (subAcquisitions[1][1].max()-subAcquisitions[1][1].min()) * GAIN[2] * BIASrgbImage1, rgbImage2 = np.zeros((W2-W1,H2-H1,3)), np.zeros((W2-W1,H2-H1,3))rgbImage1[:,:,0], rgbImage2[:,:,0] = r1, r2rgbImage1[:,:,1], rgbImage2[:,:,1] = g1, g2rgbImage1[:,:,2], rgbImage2[:,:,2] = b1, b2fig, (ax1,ax2) = plt.subplots(1,2,figsize=(16,12))ax1.imshow(rgbImage1); ax2.imshow(rgbImage2)ax1.set_title("RGB\n(Bands 4-3-2)\n2014-02-01"); ax2.set_title("RGB\n(Bands 4-3-2)\n2019-07-25")plt.show()
结果如下图所示!有趣的是,这两次获取的反射率完全的不同。
好的,继续进行海岸线检测。
4.自动化海岸线检测
在本段中,我们将使用Canny的算法执行边缘检测。
在进行实际检测之前,有必要准备数据集,尝试通过聚类算法对数据集进行分割以区分海洋和陆地。

4.1数据准备
在此阶段,我们将重塑两个多光谱立方体以进行聚类操作。
4.2用K均值进行图像分割
我们通过k均值对这两次采集进行细分(使用自己喜欢的模型即可)。
4.3细分结果
这是确定的代表新兴土地和水体的两个集群。

4.4Canny边缘检测算法
Canny的传统键技术分为以下几个阶段:
1. 高斯滤波器通过卷积降低噪声;
2. 四个方向(水平,垂直和2个倾斜)的图像梯度计算;
3. 梯度局部最大值的提取;
4. 带有滞后的阈值,用于边缘提取。
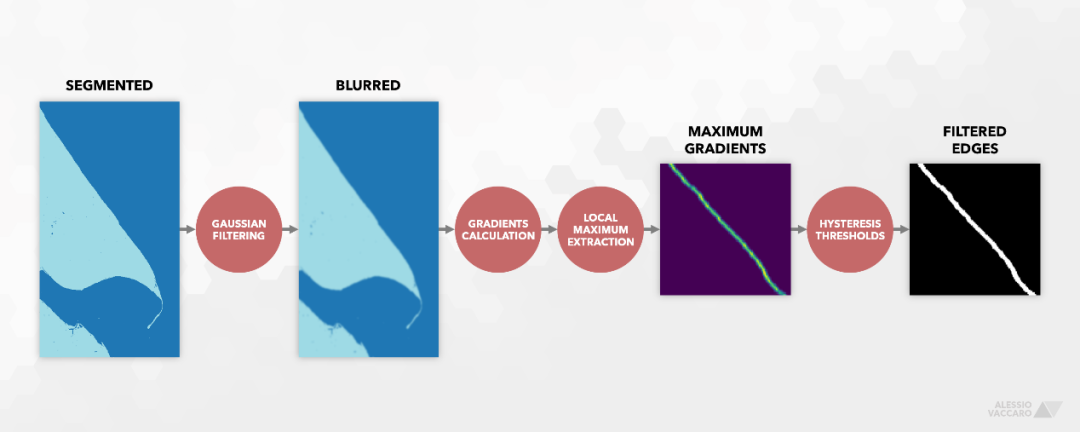
让我们开始,将聚类结果转换为图像,然后通过具有15x15内核的高斯滤波器降低噪声:
clusteredImages = [clusterLabels.reshape(subAcquisitions[0][0].shape).astype("uint8") for clusterLabels in clusters]blurredImages = [cv.GaussianBlur(clusteredImage, (15,15), 0) for clusteredImage in clusteredImages]fig, (ax1, ax2) = plt.subplots(1,2,figsize=(16,13))ax1.imshow(blurredImages[0])ax1.set_title("2014-02-01\nGaussian Blurred Image")ax2.imshow(blurredImages[1])ax2.set_title("2019-07-25\nGaussian Blurred Image")plt.show()
在图像稍微模糊之后,我们可以使用OpenCV Canny()模块:
rawEdges = [cv.Canny(blurredImage, 2, 5).astype("float").reshape(clusteredImages[0].shape) for blurredImage in blurredImages]edges = []for edge in rawEdges:edge[edge == 0] = np.nanedges.append(edge)
在单行代码中,我们获得了梯度,提取了局部最大值,然后对每次采集都应用了带有滞后的阈值。
注意:我们可以使用不同参数Canny()来探索处理结果。
4.5结果
plt.figure(figsize=(16,30))plt.imshow(rgbImage2)plt.imshow(edges[0], cmap = 'Set3_r')plt.imshow(edges[1], cmap = 'Set1')plt.title('CoastLine')plt.show()
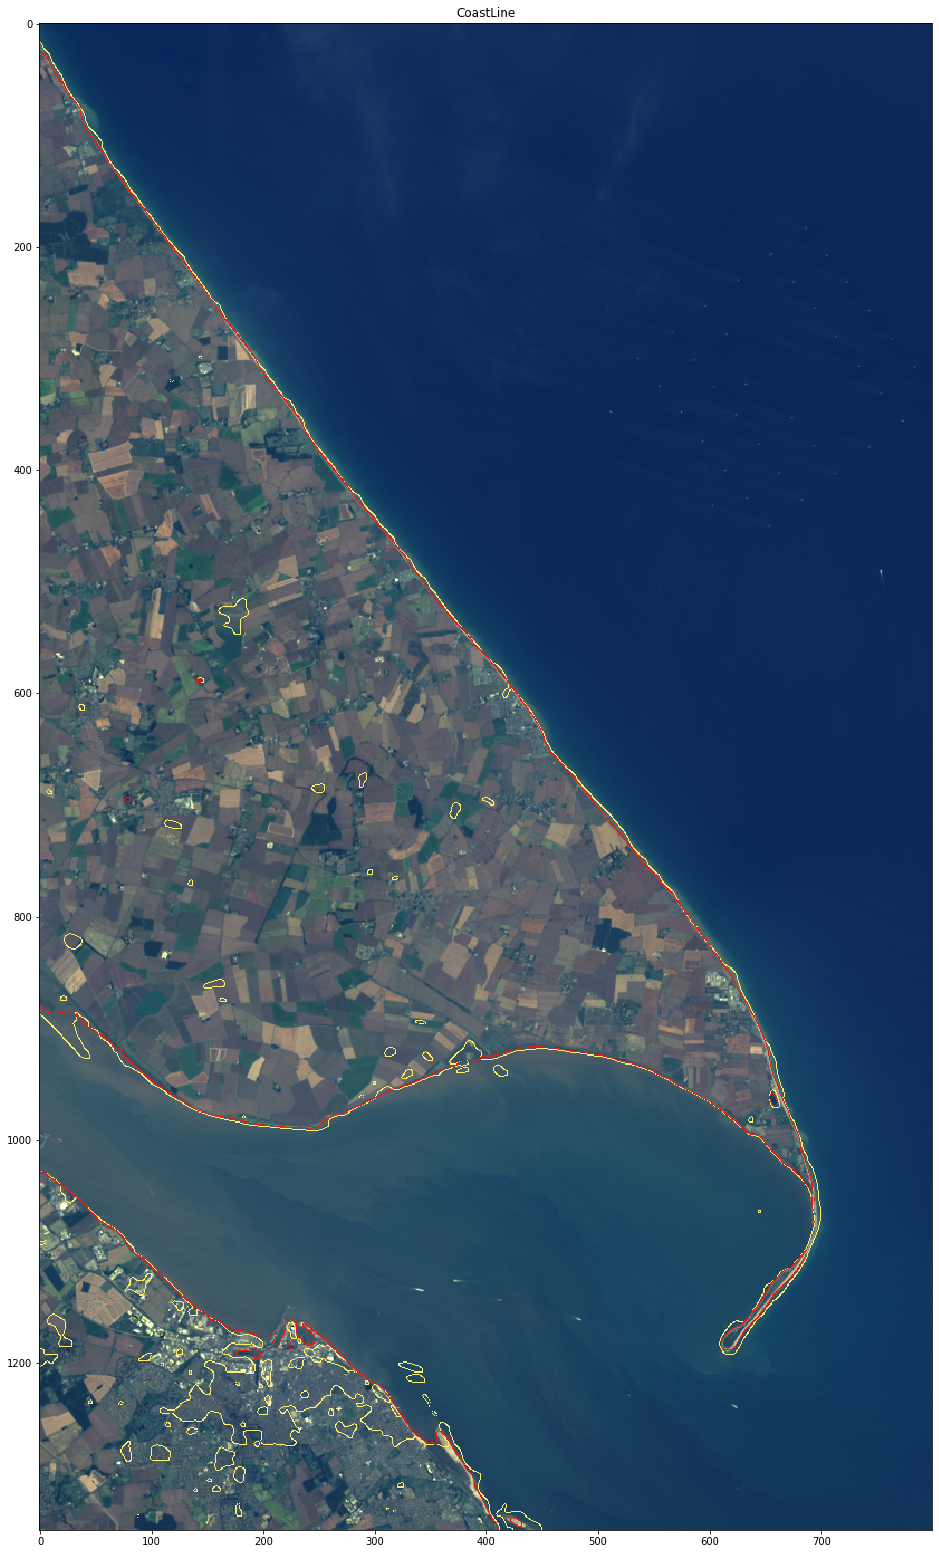
以下是一些详细信息:
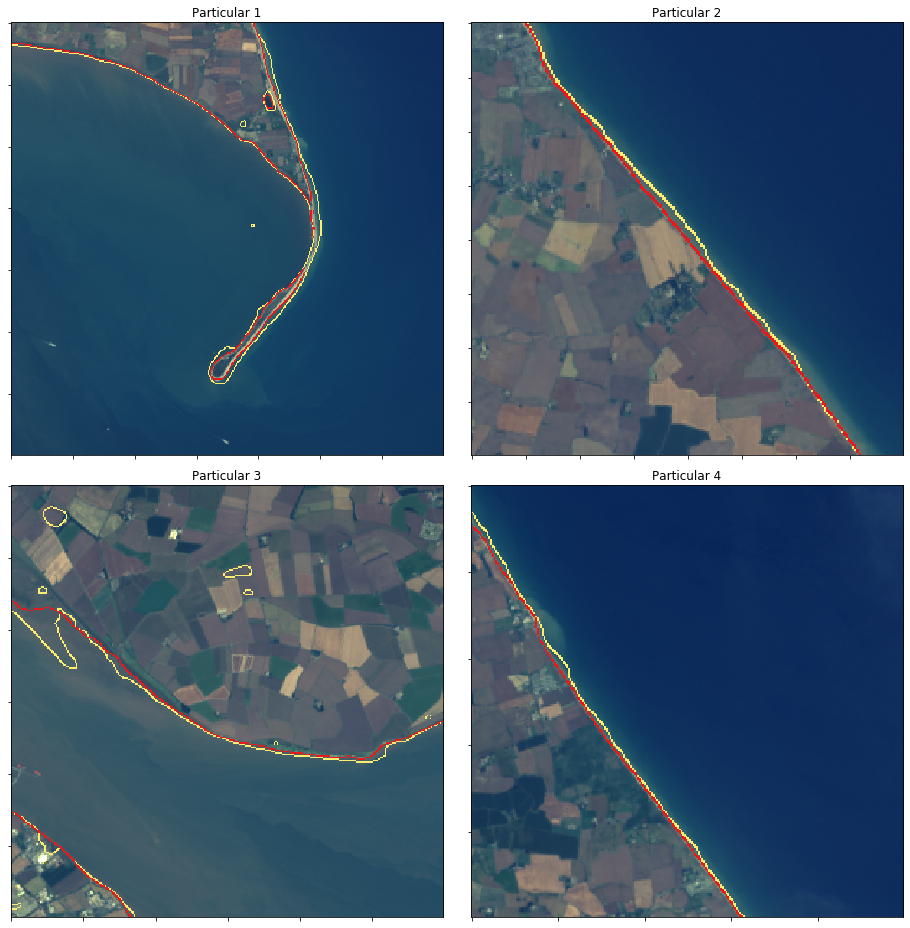
5结论
从结果中可以看到,Canny的算法在其原始管道中运行良好,但其性能通常取决于所涉及的数据。
实际上,所使用的聚类算法使我们能够对多光谱立方体进行细分。并行使用多个聚类模型可以总体上改善结果。
交流群
欢迎加入公众号读者群一起和同行交流,目前有SLAM、三维视觉、传感器、自动驾驶、计算摄影、检测、分割、识别、医学影像、GAN、算法竞赛等微信群(以后会逐渐细分),请扫描下面微信号加群,备注:”昵称+学校/公司+研究方向“,例如:”张三 + 上海交大 + 视觉SLAM“。请按照格式备注,否则不予通过。添加成功后会根据研究方向邀请进入相关微信群。请勿在群内发送广告,否则会请出群,谢谢理解~
