热文 | 卷积神经网络入门案例,轻松实现花朵分类

导入数据集
探索集数据,并进行数据预处理
构建模型(搭建神经网络结构、编译模型)
训练模型(把数据输入模型、评估准确性、作出预测、验证预测)
使用训练好的模型
优化模型、重新构建模型、训练模型、使用模型
导入数据集
探索集数据,并进行数据预处理
构建模型
训练模型
使用模型
优化模型、重新构建模型、训练模型、使用模型(过拟合、数据增强、正则化、重新编译和训练模型、预测新数据)

# 下载数据集
import pathlib
dataset_url = "https://storage.googleapis.com/download.tensorflow.org/example_images/flower_photos.tgz"
data_dir = tf.keras.utils.get_file('flower_photos', origin=dataset_url, untar=True)
data_dir = pathlib.Path(data_dir)

# 查看数据集图片的总数量
image_count = len(list(data_dir.glob('*/*.jpg')))
print(image_count)

# 查看郁金香tulips目录下的第1张图片;
tulips = list(data_dir.glob('tulips/*'))
PIL.Image.open(str(tulips[0]))

# 定义加载图片的一些参数,包括:批量大小、图像高度、图像宽度
batch_size = 32
img_height = 180
img_width = 180

# 将80%的图像用于训练
train_ds = tf.keras.preprocessing.image_dataset_from_directory(
  data_dir,
  validation_split=0.2,
  subset="training",
  seed=123,
  image_size=(img_height, img_width),
  batch_size=batch_size)

# 将20%的图像用于验证
val_ds = tf.keras.preprocessing.image_dataset_from_directory(
  data_dir,
  validation_split=0.2,
  subset="validation",
  seed=123,
  image_size=(img_height, img_width),
  batch_size=batch_size)

# 打印数据集中花朵的类别名称,字母顺序对应于目录名称
class_names = train_ds.class_names
print(class_names)
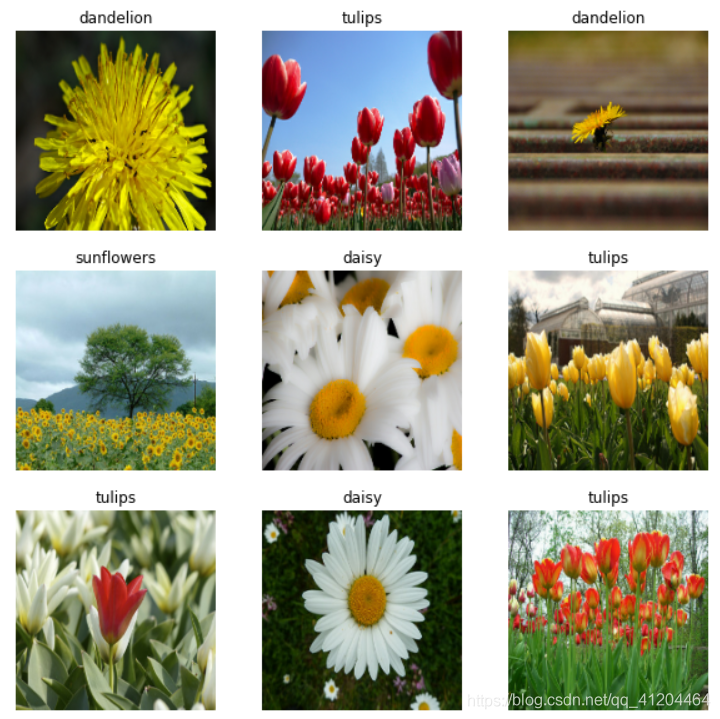
# 查看一下训练数据集中的9张图像
import matplotlib.pyplot as plt

plt.figure(figsize=(10, 10))
for images, labels in train_ds.take(1):
  for i in range(9):
    ax = plt.subplot(3, 3, i + 1)
    plt.imshow(images[i].numpy().astype("uint8"))
    plt.title(class_names[labels[i]])
    plt.axis("off")
for image_batch, labels_batch in train_ds:
  print(image_batch.shape)
  print(labels_batch.shape)
  break
# 将像素的值标准化至0到1的区间内。
normalization_layer = layers.experimental.preprocessing.Rescaling(1./255)
# 调用map将其应用于数据集:
normalized_ds = train_ds.map(lambda x, y: (normalization_layer(x), y))
image_batch, labels_batch = next(iter(normalized_ds))
first_image = image_batch[0]
# Notice the pixels values are now in `[0,1]`.
print(np.min(first_image), np.max(first_image))

特征提取——卷积层与池化层
实现分类——全连接层
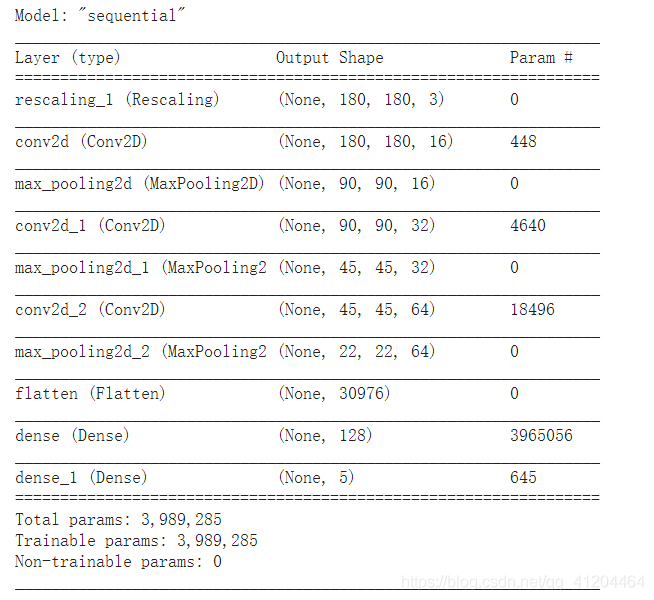
num_classes = 5

model = Sequential([
  layers.experimental.preprocessing.Rescaling(1./255, input_shape=(img_height, img_width, 3)),
  layers.Conv2D(16, 3, padding='same', activation='relu'),
  layers.MaxPooling2D(),
  layers.Conv2D(32, 3, padding='same', activation='relu'),
  layers.MaxPooling2D(),
  layers.Conv2D(64, 3, padding='same', activation='relu'),
  layers.MaxPooling2D(),
  layers.Flatten(),
  layers.Dense(128, activation='relu'),
  layers.Dense(num_classes)
])
model.compile(optimizer='adam',
              loss=tf.keras.losses.SparseCategoricalCrossentropy(from_logits=True),
              metrics=['accuracy'])

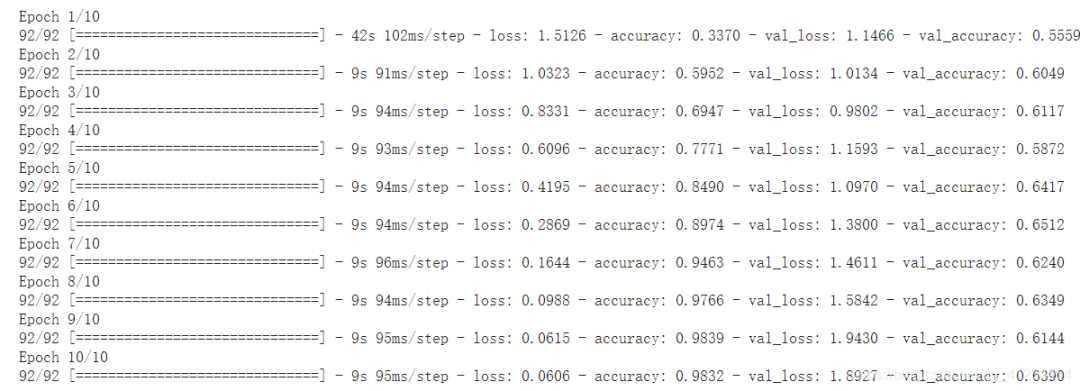
epochs=10
history = model.fit(
  train_ds,
  validation_data=val_ds,
  epochs=epochs
)
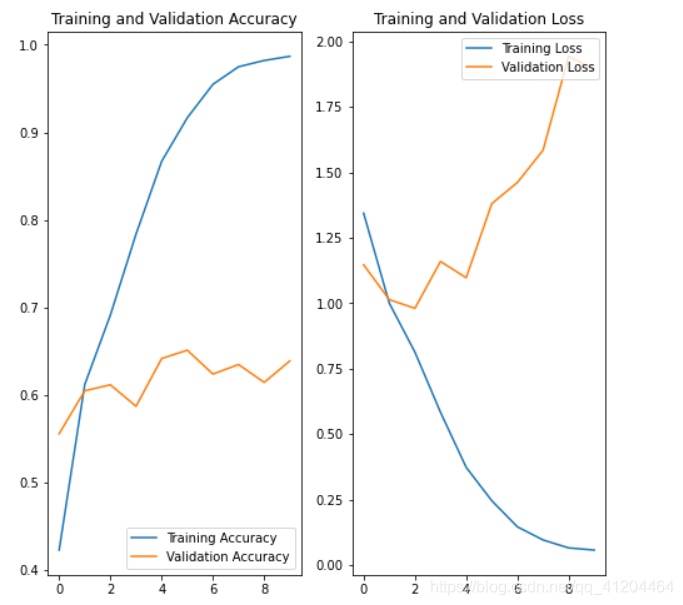
acc = history.history['accuracy']
val_acc = history.history['val_accuracy']

loss = history.history['loss']
val_loss = history.history['val_loss']

epochs_range = range(epochs)

plt.figure(figsize=(8, 8))
plt.subplot(1, 2, 1)
plt.plot(epochs_range, acc, label='Training Accuracy')
plt.plot(epochs_range, val_acc, label='Validation Accuracy')
plt.legend(loc='lower right')
plt.title('Training and Validation Accuracy')

plt.subplot(1, 2, 2)
plt.plot(epochs_range, loss, label='Training Loss')
plt.plot(epochs_range, val_loss, label='Validation Loss')
plt.legend(loc='upper right')
plt.title('Training and Validation Loss')
plt.show()


使用更完整的训练数据。(最好的解决方案)
使用正则化之类的技术。
简化神经网络结构。
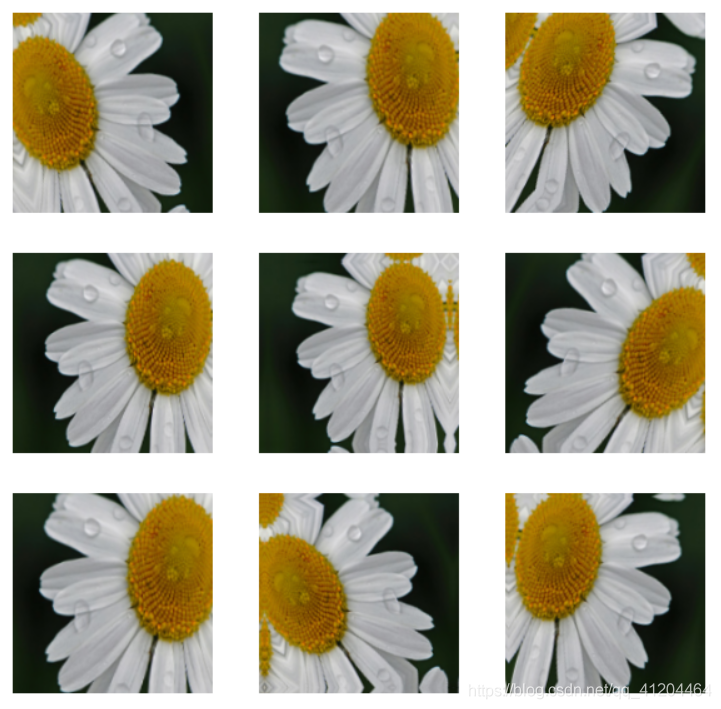
data_augmentation = keras.Sequential(
  [
    layers.experimental.preprocessing.RandomFlip("horizontal",
                                                 input_shape=(img_height,
                                                              img_width,
                                                              3)),
    layers.experimental.preprocessing.RandomRotation(0.1),
    layers.experimental.preprocessing.RandomZoom(0.1),
  ]
)
plt.figure(figsize=(10, 10))
for images, _ in train_ds.take(1):
  for i in range(9):
    augmented_images = data_augmentation(images)
    ax = plt.subplot(3, 3, i + 1)
    plt.imshow(augmented_images[0].numpy().astype("uint8"))
    plt.axis("off")
model = Sequential([
  data_augmentation,
  layers.experimental.preprocessing.Rescaling(1./255),
  layers.Conv2D(16, 3, padding='same', activation='relu'),
  layers.MaxPooling2D(),
  layers.Conv2D(32, 3, padding='same', activation='relu'),
  layers.MaxPooling2D(),
  layers.Conv2D(64, 3, padding='same', activation='relu'),
  layers.MaxPooling2D(),
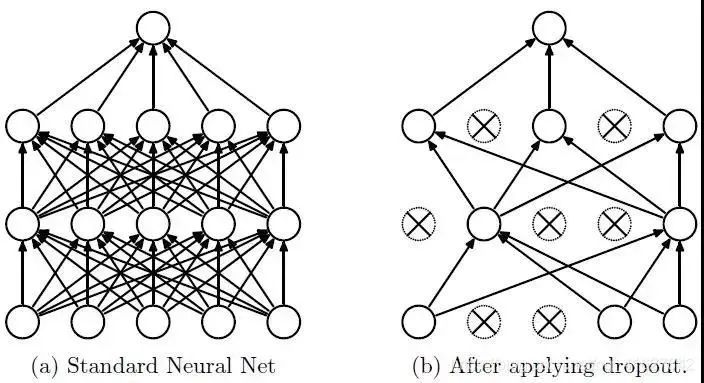
  layers.Dropout(0.2),
  layers.Flatten(),
  layers.Dense(128, activation='relu'),
  layers.Dense(num_classes)
])
# 编译模型
model.compile(optimizer='adam',
              loss=tf.keras.losses.SparseCategoricalCrossentropy(from_logits=True),
              metrics=['accuracy'])
# 查看网络结构
model.summary()
# 训练模型
epochs = 15
history = model.fit(
  train_ds,
  validation_data=val_ds,
  epochs=epochs
)
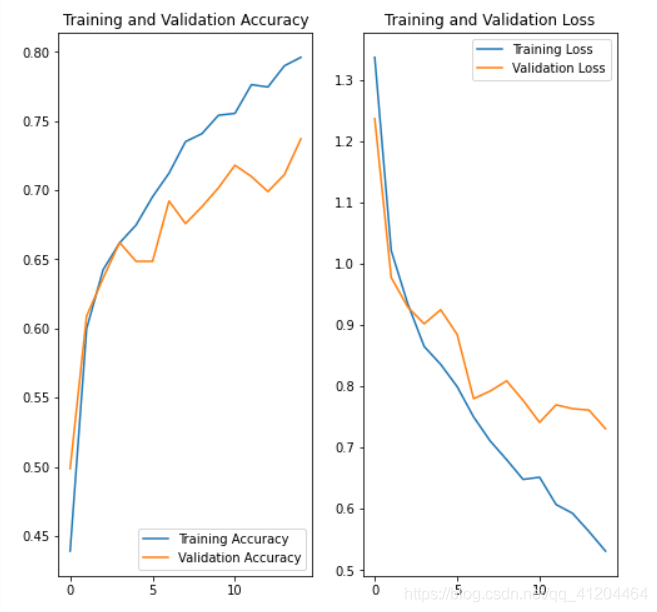
acc = history.history['accuracy']
val_acc = history.history['val_accuracy']

loss = history.history['loss']
val_loss = history.history['val_loss']

epochs_range = range(epochs)

plt.figure(figsize=(8, 8))
plt.subplot(1, 2, 1)
plt.plot(epochs_range, acc, label='Training Accuracy')
plt.plot(epochs_range, val_acc, label='Validation Accuracy')
plt.legend(loc='lower right')
plt.title('Training and Validation Accuracy')

plt.subplot(1, 2, 2)
plt.plot(epochs_range, loss, label='Training Loss')
plt.plot(epochs_range, val_loss, label='Validation Loss')
plt.legend(loc='upper right')
plt.title('Training and Validation Loss')
plt.show()

# 预测新数据 下载一张新图片,来预测它属于什么类型花朵
sunflower_url = "https://storage.googleapis.com/download.tensorflow.org/example_images/592px-Red_sunflower.jpg"
sunflower_path = tf.keras.utils.get_file('Red_sunflower', origin=sunflower_url)

img = keras.preprocessing.image.load_img(
    sunflower_path, target_size=(img_height, img_width)
)
img_array = keras.preprocessing.image.img_to_array(img)
img_array = tf.expand_dims(img_array, 0) # Create a batch

predictions = model.predict(img_array)
score = tf.nn.softmax(predictions[0])

print(
    "该图像最有可能属于{},置信度为 {:.2f}%"
    .format(class_names[np.argmax(score)], 100 * np.max(score))
)
'''
环境:Tensorflow2  Python3.x
'''

import matplotlib.pyplot as plt
import numpy as np
import os
import PIL
import tensorflow as tf

from tensorflow import keras
from tensorflow.keras import layers
from tensorflow.keras.models import Sequential

# 下载数据集
import pathlib
dataset_url = "https://storage.googleapis.com/download.tensorflow.org/example_images/flower_photos.tgz"
data_dir = tf.keras.utils.get_file('flower_photos', origin=dataset_url, untar=True)
data_dir = pathlib.Path(data_dir)

# 查看数据集图片的总数量
image_count = len(list(data_dir.glob('*/*.jpg')))
print(image_count)

# 查看郁金香tulips目录下的第1张图片;
tulips = list(data_dir.glob('tulips/*'))
PIL.Image.open(str(tulips[0]))

# 定义加载图片的一些参数,包括:批量大小、图像高度、图像宽度
batch_size = 32
img_height = 180
img_width = 180

# 将80%的图像用于训练
train_ds = tf.keras.preprocessing.image_dataset_from_directory(
  data_dir,
  validation_split=0.2,
  subset="training",
  seed=123,
  image_size=(img_height, img_width),
  batch_size=batch_size)

# 将20%的图像用于验证
val_ds = tf.keras.preprocessing.image_dataset_from_directory(
  data_dir,
  validation_split=0.2,
  subset="validation",
  seed=123,
  image_size=(img_height, img_width),
  batch_size=batch_size)

# 打印数据集中花朵的类别名称,字母顺序对应于目录名称
class_names = train_ds.class_names
print(class_names)


# 将像素的值标准化至0到1的区间内。
normalization_layer = layers.experimental.preprocessing.Rescaling(1./255)

# 调用map将其应用于数据集:
normalized_ds = train_ds.map(lambda x, y: (normalization_layer(x), y))
image_batch, labels_batch = next(iter(normalized_ds))
first_image = image_batch[0]
# Notice the pixels values are now in `[0,1]`.
print(np.min(first_image), np.max(first_image))

# 数据增强 通过对已有的训练集图片 随机转换(反转、旋转、缩放等),来生成其它训练数据
data_augmentation = keras.Sequential(
  [
    layers.experimental.preprocessing.RandomFlip("horizontal",
                                                 input_shape=(img_height,
                                                              img_width,
                                                              3)),
    layers.experimental.preprocessing.RandomRotation(0.1),
    layers.experimental.preprocessing.RandomZoom(0.1),
  ]
)

# 搭建 网络模型
model = Sequential([
  data_augmentation,
  layers.experimental.preprocessing.Rescaling(1./255),
  layers.Conv2D(16, 3, padding='same', activation='relu'),
  layers.MaxPooling2D(),
  layers.Conv2D(32, 3, padding='same', activation='relu'),
  layers.MaxPooling2D(),
  layers.Conv2D(64, 3, padding='same', activation='relu'),
  layers.MaxPooling2D(),
  layers.Dropout(0.2),
  layers.Flatten(),
  layers.Dense(128, activation='relu'),
  layers.Dense(num_classes)
])

# 编译模型
model.compile(optimizer='adam',
              loss=tf.keras.losses.SparseCategoricalCrossentropy(from_logits=True),
              metrics=['accuracy'])

# 查看网络结构
model.summary()

# 训练模型
epochs = 15
history = model.fit(
  train_ds,
  validation_data=val_ds,
  epochs=epochs
)

# 在训练和验证集上查看损失值和准确性
acc = history.history['accuracy']
val_acc = history.history['val_accuracy']

loss = history.history['loss']
val_loss = history.history['val_loss']

epochs_range = range(epochs)

plt.figure(figsize=(8, 8))
plt.subplot(1, 2, 1)
plt.plot(epochs_range, acc, label='Training Accuracy')
plt.plot(epochs_range, val_acc, label='Validation Accuracy')
plt.legend(loc='lower right')
plt.title('Training and Validation Accuracy')

plt.subplot(1, 2, 2)
plt.plot(epochs_range, loss, label='Training Loss')
plt.plot(epochs_range, val_loss, label='Validation Loss')
plt.legend(loc='upper right')
plt.title('Training and Validation Loss')
plt.show()
 End

声明:部分内容来源于网络,仅供读者学术交流之目的。文章版权归原作者所有。如有不妥,请联系删除。
评论
