机器学习之sklearn基础教程!
每日干货 & 每月组队学习,不错过
作者:李祖贤,深圳大学,Datawhale高校群成员
机器学习算法主要步骤有:
选择特征并且收集并训练样本 选择度量性能的指标 选择分类器并优化算法 评估模型性能 调整算法
本文内容:
数据准备 逻辑回归 支持向量机 决策树 随机森林 KNN
1. 数据准备
我们使用鸢尾花数据集,进行分析考核可视化
# 引入数据from sklearn import datasetsimport numpy as npiris = datasets.load_iris()X = iris.data[:,[2,3]]y = iris.targetprint("Class labels:",np.unique(y)) #打印分类类别的种类
切分训练数据和测试数据
# 切分训练数据和测试数据from sklearn.model_selection import train_test_split## 30%测试数据,70%训练数据,stratify=y表示训练数据和测试数据具有相同的类别比例X_train,X_test,y_train,y_test = train_test_split(X,y,test_size=0.3,random_state=1,stratify=y)
数据标准化
from sklearn.preprocessing import StandardScalersc = StandardScaler()## 估算训练数据中的mu和sigmasc.fit(X_train)## 使用训练数据中的mu和sigma对数据进行标准化X_train_std = sc.transform(X_train)X_test_std = sc.transform(X_test)
定制可视化函数:画出决策边界图(只有在2个特征才能画出来)
## 画出决策边界图(只有在2个特征才能画出来)import matplotlib.pyplot as plt%matplotlib inlinefrom matplotlib.colors import ListedColormapdef plot_decision_region(X,y,classifier,resolution=0.02):markers = ('s','x','o','^','v')colors = ('red','blue','lightgreen','gray','cyan')cmap = ListedColormap(colors[:len(np.unique(y))])# plot the decision surfacex1_min,x1_max = X[:,0].min()-1,X[:,0].max()+1x2_min,x2_max = X[:,1].min()-1,X[:,1].max()+1xx1,xx2 = np.meshgrid(np.arange(x1_min,x1_max,resolution),np.arange(x2_min,x2_max,resolution))Z = classifier.predict(np.array([xx1.ravel(),xx2.ravel()]).T)Z = Z.reshape(xx1.shape)plt.contourf(xx1,xx2,Z,alpha=0.3,cmap=cmap)plt.xlim(xx1.min(),xx1.max())plt.ylim(xx2.min(),xx2.max())# plot class samplesfor idx,cl in enumerate(np.unique(y)):plt.scatter(x=X[y==cl,0],y = X[y==cl,1],alpha=0.8,c=colors[idx],marker = markers[idx],label=cl,edgecolors='black')
2. 基于逻辑回归的分类概率建模
2.1 原理介绍
可参考阅读:一文详尽系列之逻辑回归
2.2 参考文档详细解释
class sklearn.linear_model.LogisticRegression(penalty='l2', *, dual=False, tol=0.0001, C=1.0, fit_intercept=True, intercept_scaling=1, class_weight=None, random_state=None, solver='lbfgs', max_iter=100, multi_class='auto', verbose=0, warm_start=False, n_jobs=None, l1_ratio=None)
2.2.1可选参数
penalty:正则化方式,可选择‘l1’, ‘l2’, ‘elasticnet’, ‘none’,默认'l2'
dual:是否选择对偶,当n_samples> n_features时,首选dual = False
tol:算法停止的误差条件,默认是0.0001
C:正则强度的倒数;必须为正浮点数,较小的值指定更强的正则化,默认为1.0
fit_intercept:是否应将常量(也称为偏差或截距)添加到决策函数。默认是True。
intercept_scaling:不常用
class_weight:对类别进行加权,可以使用字典形式加权,输入‘balanced’代表权重为类别频率,默认是"None"。
random_state:选择随机种子,打乱样本时候指定。
solver:指定优化器类型,可选‘newton-cg’, ‘lbfgs’, ‘liblinear’, ‘sag’, ‘saga’
具体的优化方法参考:机器学习中的优化算法!
max_iter:算法收敛的最大迭代次数,默认100。
multi_class:不常用。
verbose:对于liblinear和lbfgs,求解器将verbose设置为任何正数以表示详细程度。
warm_start:不常用。
n_jobs:使用内核数。
l1_ratio:弹性网络参数,其中0 <= l1_ratio <=1。仅当penalty=“ elasticnet”时使用。
2.2.2 返回标签
classes_:返回的类别标签 coef_:系数 intercept_:截距项 n_iter_:所有类的迭代次数
from sklearn.linear_model import LogisticRegressionlr = LogisticRegression(C=100.0,random_state=1)lr.fit(X_train_std,y_train)print("Class:",lr.classes_)print("Coef:",lr.coef_)print("intercept",lr.intercept_)print("n_iter",lr.n_iter_)

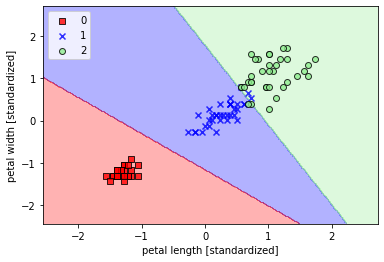
plot_decision_region(X_train_std,y_train,classifier=lr,resolution=0.02)plt.xlabel('petal length [standardized]')plt.ylabel('petal width [standardized]')plt.legend(loc='upper left')plt.show()
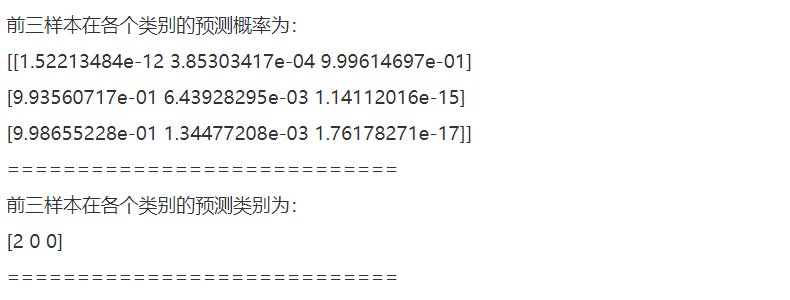
# 预测## 预测前三样本在各个类别的概率print("前三样本在各个类别的预测概率为:\n",lr.predict_proba(X_test_std[:3,:]))print("\n============================")## 获得前三个样本的分类标签print("\n前三样本在各个类别的预测类别为:\n",lr.predict(X_test_std[:3,:]))print("\n============================")
我们可以看到逻辑回归的决策边界是一个线性边界,这也就是为什么逻辑回归作为线性分类模型的原因了。大家不要小瞧线性模型,线性模型在现实生产中还发挥的重要作用,在金融、经济中尤为明显,因为线性模型的模型复杂度较小,它的可解释性很好,能够给决策者决策提供更加强大的依据,而不是像类似于深度学习那些复杂的网络模型一样是个黑箱子。
3. 基于支持向量机的分类模型
3.1 原理介绍
可参考阅读:一文详尽之支持向量机算法!
3.2 参考文档详细解释
class sklearn.svm.SVC(*, C=1.0, kernel='rbf', degree=3, gamma='scale', coef0=0.0, shrinking=True, probability=False, tol=0.001, cache_size=200, class_weight=None, verbose=False, max_iter=-1, decision_function_shape='ovr', break_ties=False, random_state=None)
C:正则化参数。正则化的强度与C成反比。必须严格为正。惩罚是平方的l2惩罚。(默认1.0) kernel:核函数类型,可选‘linear’, ‘poly’, ‘rbf’, ‘sigmoid’, ‘precomputed’; degree:当选择核函数为poly多项式时,表示多项式的阶数 gamma:可选‘scale’和‘auto’,表示为“ rbf”,“ poly”和“ Sigmoid”的内核系数。  ,默认是'scale',gamma取值为1 / (n_features * X.var());当选‘auto’参数时gamma取值为1 / n_features。
coef0:当核函数选为“ poly”和“ sigmoid”有意义。
shrinking:是否使用缩小的启发式方法,默认是True。 probability:是否启用概率估计,默认是False。必须在调用fit之前启用此功能,因为该方法内部使用5倍交叉验证,因而会减慢该方法的速度,并且predict_proba可能与dict不一致。 tol:算法停止的条件,默认为0.001。cache_size:指定内核缓存的大小(以MB为单位),默认是200。 class_weight:每个类样本的权重,可以用字典形式给出,选择'balanced',权重为n_samples / (n_classes * np.bincount(y));默认是None,表示每个样本权重一致。 verbose:是否使用详细输出,默认是False。 max_iter:算法迭代的最大步数,默认-1表示无限制 decision_function_shape:多分类的形式,1 vs 多(‘ovo’)还是1 vs 1(’ovr’),默认’ovr’. break_ties:如果为true,decision_function_shape ='ovr',并且类别数> 2,则预测将根据Decision_function的置信度值打破平局;否则,将返回绑定类中的第一类。请注意,与简单预测相比,打破平局的计算成本较高。 random_state:随机种子,随机打乱样本。
3.2.2 可选标签
support_: support_vectors_:支持向量 n_support_:每个类的支持向量数量 dual_coef_:对偶系数; coef_:原始问题的系数 intercept_:决策函数中的常数 fit_status_:如果正确拟合,则为0,否则为1(将发出警告) classes_:类别 class_weight_:类别的权重 shape_fit_:训练向量X的数组尺寸。
线性支持向量机:
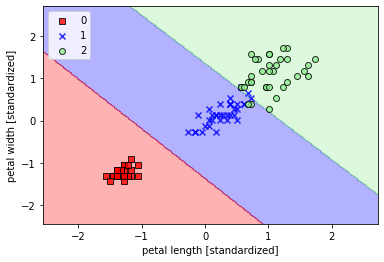
## 线性支持向量机from sklearn.svm import SVCsvm = SVC(kernel='linear',C=1.0,random_state=1)svm.fit(X_train_std,y_train)plot_decision_region(X_train_std,y_train,classifier=svm,resolution=0.02)plt.xlabel('petal length [standardized]')plt.ylabel('petal width [standardized]')plt.legend(loc='upper left')plt.show()
使用核函数对非线性分类问题建模(gamma=0.20)
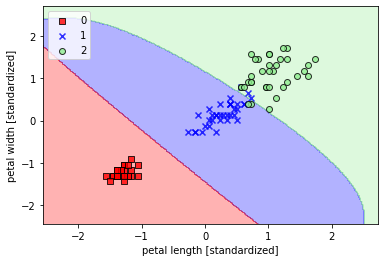
## 使用核函数对非线性分类问题建模(gamma=0.20)svm = SVC(kernel='rbf',random_state=1,gamma=0.20,C=1.0) ##较小的gamma有较松的决策边界svm.fit(X_train_std,y_train)plot_decision_region(X_train_std,y_train,classifier=svm,resolution=0.02)plt.xlabel('petal length [standardized]')plt.ylabel('petal width [standardized]')plt.legend(loc='upper left')plt.show()
使用核函数对非线性分类问题建模(gamma=100)
## 使用核函数对非线性分类问题建模(gamma=100)svm = SVC(kernel='rbf',random_state=1,gamma=100.0,C=1.0,verbose=1)svm.fit(X_train_std,y_train)plot_decision_region(X_train_std,y_train,classifier=svm,resolution=0.02)plt.xlabel('petal length [standardized]')plt.ylabel('petal width [standardized]')plt.legend(loc='upper left')plt.show()
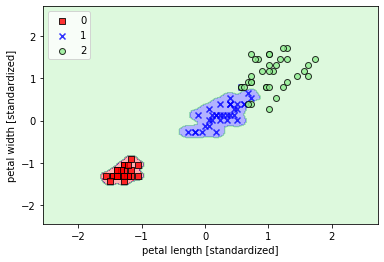
从不同的gamma取值的图像来看:对于高斯核函数,增大gamma值,将增大训练样本的影响范围,导致决策边界紧缩和波动;较小的gamma值得到的决策边界相对宽松。虽然较大的gamma值在训练样本中有很小的训练误差,但是很可能泛化能力较差,容易出现过拟合。
4. 构建决策树分类器
4.1 原理介绍
可参考阅读:最常用的决策树算法!Random Forest、Adaboost、GBDT 算法
4.2 参考文档详细解释
class sklearn.tree.DecisionTreeClassifier(*, criterion='gini', splitter='best', max_depth=None, min_samples_split=2, min_samples_leaf=1, min_weight_fraction_leaf=0.0, max_features=None, random_state=None, max_leaf_nodes=None, min_impurity_decrease=0.0, min_impurity_split=None, class_weight=None, presort='deprecated', ccp_alpha=0.0)
criterion:分裂节点所用的标准,可选“gini”, “entropy”,默认“gini”。 splitter:用于在每个节点上选择拆分的策略。可选“best”, “random”,默认“best”。 max_depth:树的最大深度。如果为None,则将节点展开,直到所有叶子都是纯净的(只有一个类),或者直到所有叶子都包含少于min_samples_split个样本。默认是None。 min_samples_split:拆分内部节点所需的最少样本数:如果为int,则将min_samples_split视为最小值。如果为float,则min_samples_split是一个分数,而ceil(min_samples_split * n_samples)是每个拆分的最小样本数。默认是2。 min_samples_leaf:在叶节点处需要的最小样本数。仅在任何深度的分割点在左分支和右分支中的每个分支上至少留下min_samples_leaf个训练样本时,才考虑。这可能具有平滑模型的效果,尤其是在回归中。如果为int,则将min_samples_leaf视为最小值。如果为float,则min_samples_leaf是分数,而ceil(min_samples_leaf * n_samples)是每个节点的最小样本数。默认是1。 min_weight_fraction_leaf:在所有叶节点处(所有输入样本)的权重总和中的最小加权分数。如果未提供sample_weight,则样本的权重相等。 max_features:寻找最佳分割时要考虑的特征数量:如果为int,则在每个拆分中考虑max_features个特征。如果为float,则max_features是一个分数,并在每次拆分时考虑int(max_features * n_features)个特征。如果为“auto”,则max_features = sqrt(n_features)。如果为“ sqrt”,则max_features = sqrt(n_features)。如果为“ log2”,则max_features = log2(n_features)。如果为None,则max_features = n_features。注意:在找到至少一个有效的节点样本分区之前,分割的搜索不会停止,即使它需要有效检查多个max_features功能也是如此。 random_state:随机种子,负责控制分裂特征的随机性,为整数。默认是None。 max_leaf_nodes:最大叶子节点数,整数,默认为None min_impurity_decrease:如果分裂指标的减少量大于该值,则进行分裂。 min_impurity_split:决策树生长的最小纯净度。默认是0。自版本0.19起不推荐使用:不推荐使用min_impurity_split,而建议使用0.19中的min_impurity_decrease。min_impurity_split的默认值在0.23中已从1e-7更改为0,并将在0.25中删除。 class_weight:每个类的权重,可以用字典的形式传入{class_label: weight}。如果选择了“balanced”,则输入的权重为n_samples / (n_classes * np.bincount(y))。 presort:此参数已弃用,并将在v0.24中删除。 ccp_alpha:将选择成本复杂度最大且小于ccp_alpha的子树。默认情况下,不执行修剪。
4.2.2 可选标签
classes_:类标签(单输出问题)或类标签数组的列表(多输出问题)。 feature_importances_:特征重要度。 max_features_:max_features的推断值。 n_classes_:类数(用于单输出问题),或包含每个输出的类数的列表(用于多输出问题)。 n_features_:执行拟合时的特征数量。 n_outputs_:执行拟合时的输出数量。 tree_:
决策树分类器:
## 决策树分类器from sklearn.tree import DecisionTreeClassifiertree = DecisionTreeClassifier(criterion='gini',max_depth=4,random_state=1)tree.fit(X_train_std,y_train)plot_decision_region(X_train_std,y_train,classifier=tree,resolution=0.02)plt.xlabel('petal length [standardized]')plt.ylabel('petal width [standardized]')plt.legend(loc='upper left')plt.show()
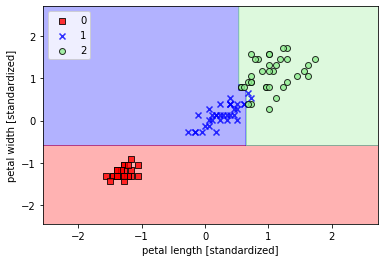
决策树可视化:
从http://www.graphviz.orz免费下载程序
pip3 install pydotplus
pip3 install graphviz
pip3 install pyparsing
## 决策树可视化from pydotplus import graph_from_dot_datafrom sklearn.tree import export_graphvizdot_data = export_graphviz(tree,filled=True,class_names=['Setosa','Versicolor','Virginica'],feature_names=['petal_length','petal_width'],out_file=None)graph = graph_from_dot_data(dot_data)graph.write_png('/home/leo/文档/大四下学期/zhihu/sklearn的基本分类模型详解/tree.png')
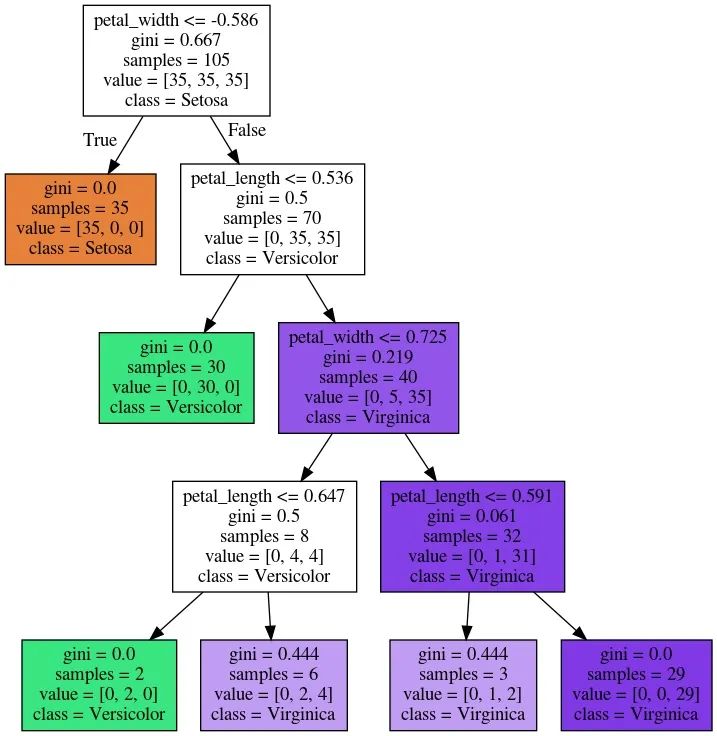
从树的边界来看,决策树在鸢尾花分类问题上表现不错,但是sklearn不提供手工决策树修剪功能。
5. 通过随机森林组合多棵决策树
5.1 原理介绍
可参考阅读:机器学习必知必会10大算法
5.2 参考文档详细解释
class sklearn.ensemble.RandomForestClassifier(n_estimators=100, *, criterion='gini', max_depth=None, min_samples_split=2, min_samples_leaf=1, min_weight_fraction_leaf=0.0, max_features='auto', max_leaf_nodes=None, min_impurity_decrease=0.0, min_impurity_split=None, bootstrap=True, oob_score=False, n_jobs=None, random_state=None, verbose=0, warm_start=False, class_weight=None, ccp_alpha=0.0, max_samples=None)
n_estimators:森林中决策树的数量。默认100 criterion:分裂节点所用的标准,可选“gini”, “entropy”,默认“gini”。 max_depth:树的最大深度。如果为None,则将节点展开,直到所有叶子都是纯净的(只有一个类),或者直到所有叶子都包含少于min_samples_split个样本。默认是None。 min_samples_split:拆分内部节点所需的最少样本数:如果为int,则将min_samples_split视为最小值。如果为float,则min_samples_split是一个分数,而ceil(min_samples_split * n_samples)是每个拆分的最小样本数。默认是2。 min_samples_leaf:在叶节点处需要的最小样本数。仅在任何深度的分割点在左分支和右分支中的每个分支上至少留下min_samples_leaf个训练样本时,才考虑。这可能具有平滑模型的效果,尤其是在回归中。如果为int,则将min_samples_leaf视为最小值。如果为float,则min_samples_leaf是分数,而ceil(min_samples_leaf * n_samples)是每个节点的最小样本数。默认是1。 min_weight_fraction_leaf:在所有叶节点处(所有输入样本)的权重总和中的最小加权分数。如果未提供sample_weight,则样本的权重相等。 max_features:寻找最佳分割时要考虑的特征数量:如果为int,则在每个拆分中考虑max_features个特征。如果为float,则max_features是一个分数,并在每次拆分时考虑int(max_features * n_features)个特征。如果为“auto”,则max_features = sqrt(n_features)。如果为“ sqrt”,则max_features = sqrt(n_features)。如果为“ log2”,则max_features = log2(n_features)。如果为None,则max_features = n_features。注意:在找到至少一个有效的节点样本分区之前,分割的搜索不会停止,即使它需要有效检查多个max_features功能也是如此。 max_leaf_nodes:最大叶子节点数,整数,默认为None min_impurity_decrease:如果分裂指标的减少量大于该值,则进行分裂。 min_impurity_split:决策树生长的最小纯净度。默认是0。自版本0.19起不推荐使用:不推荐使用min_impurity_split,而建议使用0.19中的min_impurity_decrease。min_impurity_split的默认值在0.23中已从1e-7更改为0,并将在0.25中删除。 bootstrap:是否进行bootstrap操作,bool。默认True。 oob_score:是否使用袋外样本来估计泛化精度。默认False。 n_jobs:并行计算数。默认是None。 random_state:控制bootstrap的随机性以及选择样本的随机性。 verbose:在拟合和预测时控制详细程度。默认是0。 warm_start:不常用 class_weight:每个类的权重,可以用字典的形式传入{class_label: weight}。如果选择了“balanced”,则输入的权重为n_samples / (n_classes * np.bincount(y))。 ccp_alpha:将选择成本复杂度最大且小于ccp_alpha的子树。默认情况下,不执行修剪。 max_samples:如果bootstrap为True,则从X抽取以训练每个基本分类器的样本数。如果为None(默认),则抽取X.shape [0]样本。如果为int,则抽取max_samples样本。如果为float,则抽取max_samples * X.shape [0]个样本。因此,max_samples应该在(0,1)中。是0.22版中的新功能。
5.2.2 可选标签
base_estimator_:使用的基本分类器 estimators_:子分类器的集合。 classes_:类标签(单输出问题)或类标签数组的列表(多输出问题)。 n_classes_:类数(用于单输出问题),或包含每个输出的类数的列表(用于多输出问题)。 n_features_:执行拟合时的特征数量。 n_outputs_:执行拟合时的输出数量。 oob_score_:使用袋外估计获得的训练数据集的分数。仅当oob_score为True时,此属性才存在。 oob_decision_function_:使用训练集上的实际估计值计算的决策函数。如果n_estimators小,则有可能在引导过程中从未遗漏任何数据点。在这种情况下,oob_decision_function_可能包含NaN。仅当oob_score为True时,此属性才存在。
使用随机森林分类器:
## 使用随机森林分类器from sklearn.ensemble import RandomForestClassifierforest = RandomForestClassifier(criterion='gini',n_estimators=25,random_state=1,n_jobs=2,verbose=1)forest.fit(X_train_std,y_train)plot_decision_region(X_train_std,y_train,classifier=forest,resolution=0.02)plt.xlabel('petal length [standardized]')plt.ylabel('petal width [standardized]')plt.legend(loc='upper left')plt.show()

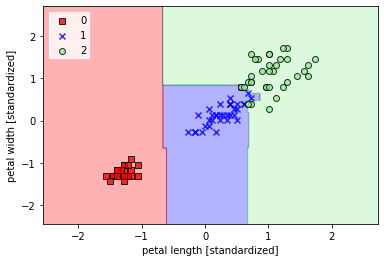
6. K近邻(KNN)
6.1 原理介绍
可参考阅读:机器学习必知必会10大算法
6.2 参考文档详细解释
class sklearn.neighbors.KNeighborsClassifier(n_neighbors=5, _, weights='uniform', algorithm='auto', leaf_size=30, p=2, metric='minkowski', metric_params=None, n_jobs=None, *_kwargs)
n_neighbors:寻找的邻居数,默认是5。 weights:预测中使用的权重函数。可能的取值:‘uniform’:统一权重,即每个邻域中的所有点均被加权。‘distance’:权重点与其距离的倒数,在这种情况下,查询点的近邻比远处的近邻具有更大的影响力。[callable]:用户定义的函数,该函数接受距离数组,并返回包含权重的相同形状的数组。 algorithm:用于计算最近邻居的算法:“ ball_tree”将使用BallTree,“ kd_tree”将使用KDTree,“brute”将使用暴力搜索。“auto”将尝试根据传递给fit方法的值来决定最合适的算法。注意:在稀疏输入上进行拟合将使用蛮力覆盖此参数的设置。 leaf_size:叶大小传递给BallTree或KDTree。这会影响构造和查询的速度,以及存储树所需的内存。最佳值取决于问题的性质。默认30。 p:Minkowski距离的指标的功率参数。当p = 1时,等效于使用manhattan_distance(l1)和p=2时使用euclidean_distance(l2)。对于任意p,使用minkowski_distance(l_p)。默认是2。 metric:树使用的距离度量。默认度量标准为minkowski,p = 2等于标准欧几里德度量标准。 metric_params:度量函数的其他关键字参数。 n_jobs:并行计算数
6.2.2 可选标签
classes_:类别 effective_metric_:使用的距离度量。它将与度量参数相同或与其相同,例如如果metric参数设置为“ minkowski”,而p参数设置为2,则为“ euclidean”。 effective_metric_params_:度量功能的其他关键字参数。对于大多数指标而言,它与metric_params参数相同,但是,如果将valid_metric_属性设置为“ minkowski”,则也可能包含p参数值。 outputs_2d_:在拟合的时候,当y的形状为(n_samples,)或(n_samples,1)时为False,否则为True。
使用KNN分类器:
## 使用KNN分类器from sklearn.neighbors import KNeighborsClassifierknn = KNeighborsClassifier(n_neighbors=2,p=2,metric="minkowski")knn.fit(X_train_std,y_train)plot_decision_region(X_train_std,y_train,classifier=knn,resolution=0.02)plt.xlabel('petal length [standardized]')plt.ylabel('petal width [standardized]')plt.legend(loc='upper left')plt.show()
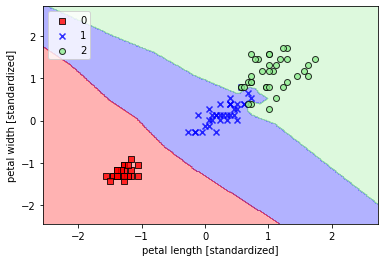
值得注意的是:KNN容易过拟合,因为在高维空间上,随着维数越来越大,特征空间越来越稀疏,大家可以想象在一个球体里面,大部分的信息集中在球面,那KNN需要找最近的点就会十分困难,那么也就无法合适进行估计。
本文电子版 后台回复 sklearn 获取
“整理不易,点赞三连↓
