使用Pyhon+Flux+Julia实现手写数字识别
点击上方“小白学视觉”,选择加"星标"或“置顶”
重磅干货,第一时间送达

为什么使用Flux和Julia?
机器学习概论
线性代数的核心思想。(https://medium.com/@Jernfrost/the-core-idea-of-linear-algebra-7405863d8c1d) 线性代数基本上是关于向量和矩阵的,这是你在机器学习中经常用到的东西。 使用引用。(https://medium.com/@Jernfrost/working-with-and-emulating-references-in-julia-e02c1cae5826) 它看起来有点不太好理解,但是如果你想理解像Flux这样的ML库,那么理解Julia中的引用是很重要的。 Flux的实现。(https://medium.com/@Jernfrost/implementation-of-a-modern-machine-learning-library-3596badf3be) 如何实现Flux-ML库的初学者指南。 机器学习简介。(https://medium.com/@Jernfrost/machine-learning-for-dummies-in-julia-6cd4d2e71a46) 机器学习概论。
简单多层感知机
using Flux, Flux.Data.MNIST, Statistics
using Flux: onehotbatch, onecold, crossentropy, throttle
using Base.Iterators: repeated

# Load training data. 28x28 grayscale images of digits
imgs = MNIST.images()

# Reorder the layout of the data for the ANN
imagestrip(image::Matrix{<:Gray}) = Float32.(reshape(image, :))
X = hcat(imagestrip.(imgs)...)

# Target output. What digit each image represents.
labels = MNIST.labels()
Y = onehotbatch(labels, 0:9)

# Defining the model (a neural network)
m = Chain(
 Dense(28*28, 32, relu),
 Dense(32, 10),
 softmax)

loss(x, y) = crossentropy(m(x), y)
dataset = repeated((X, Y), 200)
opt = ADAM()

evalcb = () -> @show(loss(X, Y))

# Perform training on data
Flux.train!(loss, params(m), dataset, opt, cb = throttle(evalcb, 10))
探索输入数据
imgs = MNIST.images()
julia> size(imgs)
(60000,)
julia> eltype(imgs)
Array{Gray{FixedPointNumbers.Normed{UInt8,8}},2}
julia> eltype(imgs) <: Matrix{T} where T <: Gray
true
imgs中的每个元素都是某种值矩阵,这些值属于某种类型T,它是Gray类型的子类型。什么是Gray类型?help?> Gray
Gray is a grayscale object. You can extract its value with gray(c).
julia> size(imgs[1])
(28, 28)

julia> size(imgs[2])
(28, 28)
Plots库使你可以绘制函数和图像。julia> using Plots
julia> plot(imgs[2])
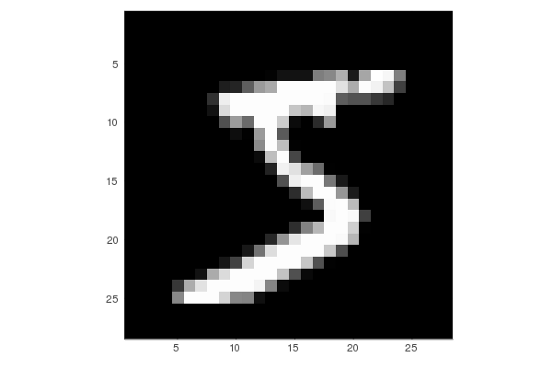
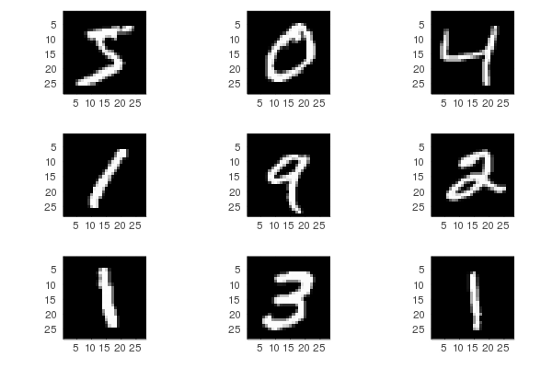
imgplots = plot.(imgs[1:9])
plot(imgplots...)
准备输入数据
28x28=784的长像素带。reshape函数来改变数组的形状。下面是一些你如何使用它的例子。A:julia> A = collect(1:4)
4-element Array{Int64,1}:
1
2
3
4
reshape我们把它变成一个二乘二的矩阵B:julia> B = reshape(A, (2, 2))
2×2 Array{Int64,2}:
1 3
2 4
julia> reshape(B, 4)
4-element Array{Int64,1}:
 1
 2
 3
 4
julia> reshape(B, :)
4-element Array{Int64,1}:
 1
 2
 3
 4
imagestrip函数的实际功能了,它将28x28的灰度矩阵转换为784个32位浮点值的列向量。imagestrip(image::Matrix{<:Gray}) = Float32.(reshape(image, :))
.符号用于将函数应用于数组的每个元素,因此Float32.(xs)与map(Float32, xs)是相同的。imagestrip函数应用于6万张灰度图像中的每一张,生成784x6000个输入矩阵X。X = hcat(imagestrip.(imgs)...)
imagestrip.(imgs)将图像转换为单个输入值的数组,例如[X₁, X₂, X₃, ..., Xₙ],其中n = 60,000,每个Xᵢ都是784个浮点值。...,我们将其转换为所有这些列向量的水平连接,以产生模型输入。X = hcat(X₁, X₂, X₃, ..., Xₙ)
size(X)。接下来,我们加载标签。labels = MNIST.labels()
imgplots = plot.(imgs[1:9])
plot(imgplots...)
labels[1:9]
独热编码
julia> Flux.onehot('B', ['A', 'B', 'C'])
3-element Flux.OneHotVector:
0
1
0

julia> Flux.onehot("foo", ["foo", "bar", "baz"])
3-element Flux.OneHotVector:
1
0
0
onehot函数,因为我们正在创建一批独热编码标签,我们将把60000张图片作为一个批次来处理。Y = onehotbatch(labels, 0:9)
构造神经网络模型
m = Chain(
  Dense(28^2, 32, relu),
  Dense(32, 10),
  softmax)
Chain用于将各个层连接在一起。第一层Dense(28^2, 32, relu)有784(28x28)个输入节点,对应于每个图像中的像素数。sigmoid和tanh。relu等激活函数,这些激活函数在大多数情况下都工作得很好,包括图像的分类。Softmax函数
softmax函数,它以前一层的输出的矩阵作为输入,并沿着每一列进行归一化。julia> ys = rand(1:10, 10)
10-element Array{Int64,1}:
9
6
10
5
10
2
6
6
7
9
LinearAlgebra模块的normalize,因为它与Julia捆绑在一起。softmax:julia> softmax(ys)
10-element Array{Float64,1}:
0.12919082661651196
0.006432032517257137
0.3511770763952676
0.002366212528045101
0.3511770763952676
0.00011780678490667763
0.006432032517257137
0.006432032517257137
0.017484077111717768
0.12919082661651196
julia> sum(softmax(ys))
0.9999999999999999
normalize的功能进行对比:julia> using LinearAlgebra
julia> normalize(ys)
10-element Array{Float64,1}:
0.38446094597254243
0.25630729731502827
0.4271788288583805
0.21358941442919024
0.4271788288583805
0.0854357657716761
0.25630729731502827
0.25630729731502827
0.2990251802008663
0.38446094597254243
julia> sum(normalize(ys))
2.9902518020086633
julia> norm(normalize(ys))
1.0
julia> norm(softmax(ys))
0.52959100847191
normalize归一化的值求和,它们只会得到一些随机值,然而如果我们把结果反馈给norm,我们得到的结果正好是1.0。normalize将向量中的值进行了归一化,以便它们可以表示单位向量,即长度正好为一的向量。norm给出向量的大小。softmax不会将这些值视为向量,而是将其视为概率分布,每个元素表示输入图像为该数字的概率。softmax得到一个输出值是[0.1,0.7,0.2],那么输入图像有10%的可能性是A的图形,有70%的可能性是B的图形,最后有20%的可能性是C的图形。softmax作为最后一层的原因。用神经网络不能绝对确定输入图像是什么,但是我们可以给出一个概率分布,它表示更有可能是哪个数字。定义损失函数
loss(x, y) = crossentropy(m(x), y)
指定Epoch
repeat重复我们的批处理200次。它实际上不会重复我们的数据200次,它只是用迭代器创建了这样的错觉。dataset = repeated((X, Y), 200)
dataset = [(X1, Y1), (X2, Y2), ..., (X200, Y200)]
优化器
Descent类型提供的。opt = ADAM()
进行训练
evalcb = () -> @show(loss(X, Y))
Flux.train!(loss, params(m), dataset, opt, cb = throttle(evalcb, 10))
评价模型预测精度
accuracy(x, y) = mean(onecold((m(x))) .== onecold(y))
@show accuracy(X, Y)
julia> onecold([0.1, 0.7, 0.2])
2

julia> onecold([0.9, 0.05, 0.05])
1
onecold(y)进行比较。用测试数据验证模型
tX = hcat(float.(reshape.(MNIST.images(:test), :))...)
tY = onehotbatch(MNIST.labels(:test), 0:9)

@show accuracy(tX, tY)
最后
评论
