
Matlab中legend函数详解及legend边框去掉的方法
🚩legend函数的基本用法
⭐️用法一
LEGEND(string1,string2,string3, ...)plot(x,sin(x),'.b',x,cos(x),'+r')
legend('sin','cos')
⭐️用法二
LEGEND(...,'Location',LOC) %指定图例标识框的位置'North' inside plot box near top
'South' inside bottom
'East' inside right
'West' inside left
'NorthEast' inside top right (default)
'NorthWest inside top left
'SouthEast' inside bottom right
'SouthWest' inside bottom left
'NorthOutside' outside plot box near top
'SouthOutside' outside bottom
'EastOutside' outside right
'WestOutside' outside left
'NorthEastOutside' outside top right
'NorthWestOutside' outside top left
'SouthEastOutside' outside bottom right
'SouthWestOutside' outside bottom left
'Best' least conflict with data in plot
'BestOutside' least unused space outside plot
'North' 图例标识放在图顶端
'South' 图例标识放在图底端
'East' 图例标识放在图右方
'West' 图例标识放在图左方
'NorthEast' 图例标识放在图右上方(默认)
'NorthWest 图例标识放在图左上方
'SouthEast' 图例标识放在图右下角
'SouthWest' 图例标识放在图左下角
(以上几个都是将图例标识放在框图内)
'NorthOutside' 图例标识放在图框外侧上方
'SouthOutside' 图例标识放在图框外侧下方
'EastOutside' 图例标识放在图框外侧右方
'WestOutside' 图例标识放在图框外侧左方
'NorthEastOutside' 图例标识放在图框外侧右上方
'NorthWestOutside' 图例标识放在图框外侧左上方
'SouthEastOutside' 图例标识放在图框外侧右下方
'SouthWestOutside' 图例标识放在图框外侧左下方
(以上几个将图例标识放在框图外)
'Best' 图标标识放在图框内不与图冲突的最佳位置
'BestOutside' 图标标识放在图框外使用最小空间的最佳位置
legend('sin','cos','location','northwest')⭐️用法三
legend(字符串1,字符串2,字符串3,...,参数)🚩示例
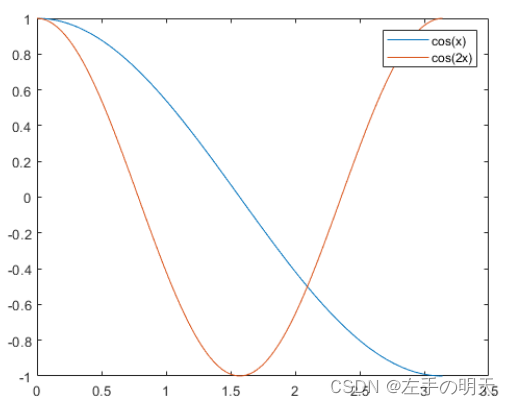
🍊在当前坐标区上添加图例
x = linspace(0,pi);
y1 = cos(x);
plot(x,y1)
hold on
y2 = cos(2*x);
plot(x,y2)
legend('cos(x)','cos(2x)')
y3 = cos(3*x);
plot(x,y3,'DisplayName','cos(3x)')
hold off

legend('off')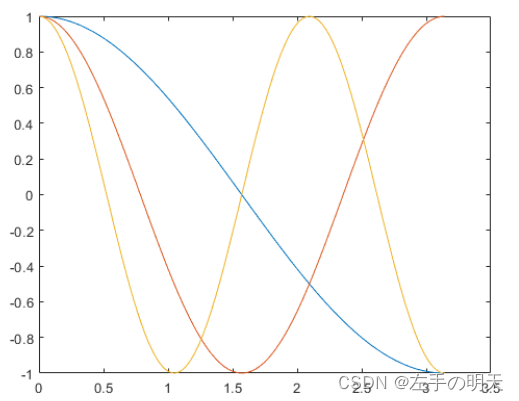
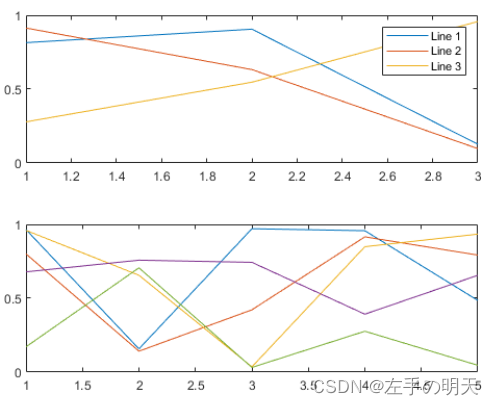
🍊在特定坐标区上添加图例
tiledlayout(2,1)
y1 = rand(3);
ax1 = nexttile;
plot(y1)
y2 = rand(5);
ax2 = nexttile;
plot(y2)
legend(ax1,{'Line 1','Line 2','Line 3'})
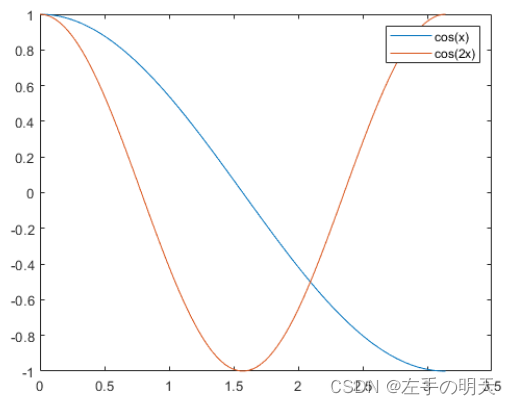
🍊在执行绘图命令的过程中指定图例标签
x = linspace(0,pi);
y1 = cos(x);
plot(x,y1,'DisplayName','cos(x)')
hold on
y2 = cos(2*x);
plot(x,y2,'DisplayName','cos(2x)')
hold off
legend
🍊从图例中排除线条
x = 0:0.2:10;
plot(x,sin(x),x,sin(x+1));
hold on
yline(0,'--')
legend('sin(x)','sin(x+1)','')

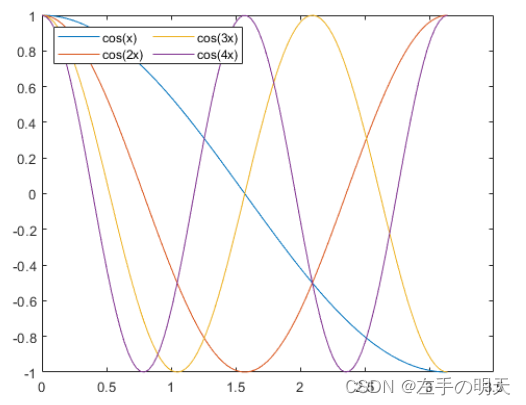
🍊图例位置和列数
x = linspace(0,pi);
y1 = cos(x);
plot(x,y1)
hold on
y2 = cos(2*x);
plot(x,y2)
y3 = cos(3*x);
plot(x,y3)
y4 = cos(4*x);
plot(x,y4)
hold off
legend({'cos(x)','cos(2x)','cos(3x)','cos(4x)'},...
'Location','northwest','NumColumns',2)
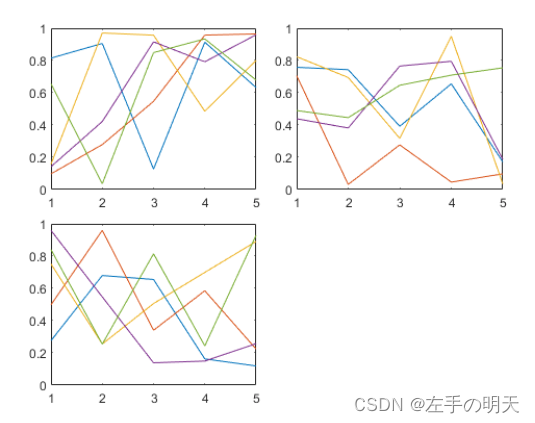
🍊在分块图布局中显示共享图例
t = tiledlayout('flow','TileSpacing','compact');
nexttile
plot(rand(5))
nexttile
plot(rand(5))
nexttile
plot(rand(5))
lgd = legend;
lgd.Layout.Tile = 4;
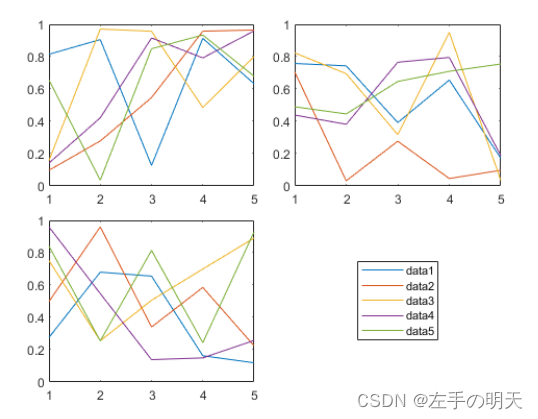
nexttile
plot(rand(5))
lgd.Layout.Tile = 'east';

🍊在图例中包含部分图形对象
x = linspace(0,pi);
y1 = cos(x);
p1 = plot(x,y1);
hold on
y2 = cos(2*x);
p2 = plot(x,y2);
y3 = cos(3*x);
p3 = plot(x,y3);
hold off
legend([p1 p3],{'First','Third'})

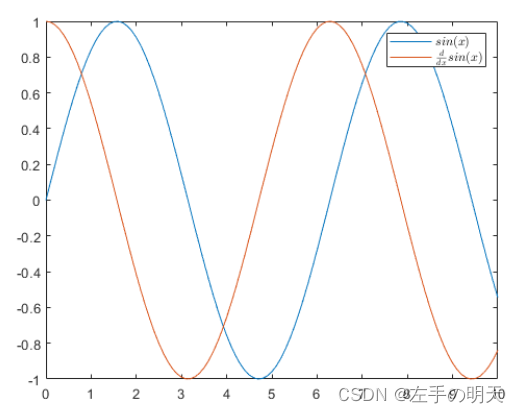
🍊创建包含 LaTeX 标记的图例
x = 0:0.1:10;
y = sin(x);
dy = cos(x);
plot(x,y,x,dy);
legend('$sin(x)$','$\frac{d}{dx}sin(x)$','Interpreter','latex');
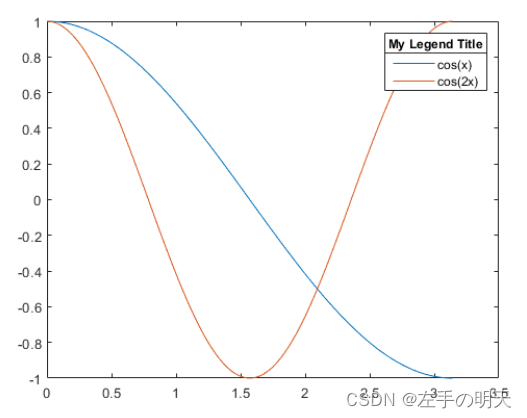
🍊为图例添加标题
x = linspace(0,pi);
y1 = cos(x);
plot(x,y1)
hold on
y2 = cos(2*x);
plot(x,y2)
hold off
lgd = legend('cos(x)','cos(2x)');
title(lgd,'My Legend Title')
🍊删除图例背景
x = linspace(0,pi);
y1 = cos(x);
plot(x,y1)
hold on
y2 = cos(2*x);
plot(x,y2)
hold off
legend({'cos(x)','cos(2x)'},'Location','southwest')
legend('boxoff')

🍊修改图例外观
rdm = rand(4);
plot(rdm)
lgd = legend({'Line 1','Line 2','Line 3','Line 4'},...
'FontSize',12,'TextColor','blue');
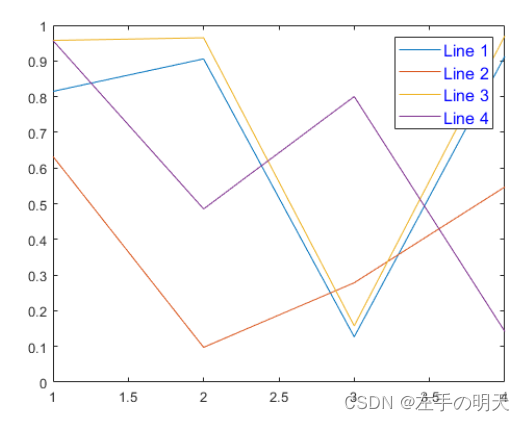
lgd.NumColumns = 2;
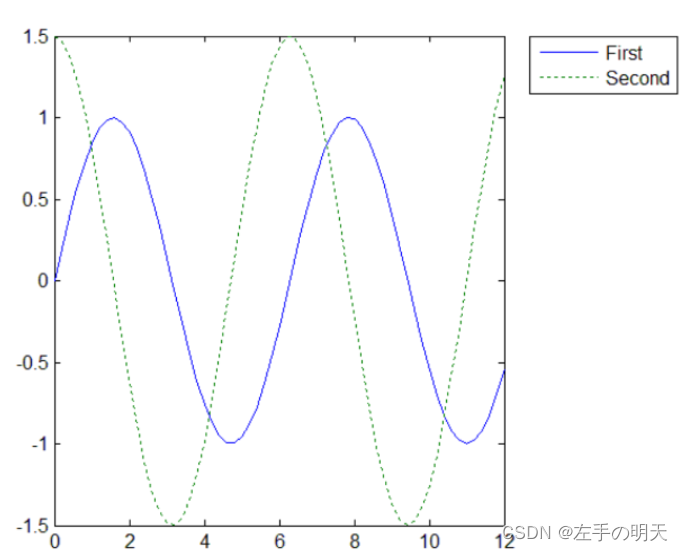
🍊其他
x=0:0.2:12;
plot(x,sin(x),'-',x,1.5*cos(x),':')
legend('First','Second',-1); %强行将注释视窗放在图形视窗的外右边。
x = 0:.2:12;plot(x,bessel(1,x),x,bessel(2,x),x,bessel(3,x));legend('First','Second','Third');legend('First','Second','Third','Location','NorthEastOutside')b = bar(rand(10,5),'stacked');colormap(summer);hold onx = plot(1:10,5*rand(10,1),'marker','square','markersize',12,...'markeredgecolor','y','markerfacecol or',[.6 0 .6],... 'linestyle','-','color','r','linewidth',2);hold offlegend([b,x],'Carrots','Peas','Peppers','Green Beans',...'Cucumbers','Eggplant')

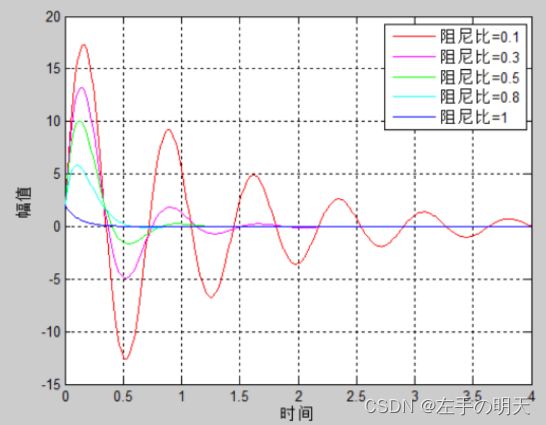
m=400;k=30000;phaser=0.1;A=20;Cratio=[0.1,0.3,0.5,0.8,1]n=length(cratio);t=0:0.01:8;cols=['r','m','g','c','b','y','k'];for nn=1:naratio=-cratio(nn)*sqrt(k/m);wd=sqrt(k/m)*sqrt(1-cratio(nn)^2);z=A*exp(aratio*t).*sin(wd*t+phaser);plot(t,z,cols(nn));jfd(nn)={'阻尼比='};dhd(nn)={num2str(cratio(nn))};hold onendxlabel('时间');ylabel('幅值')jus=strcat(jfd,dhd);legend(jus(1:n)')grid on;hold off;
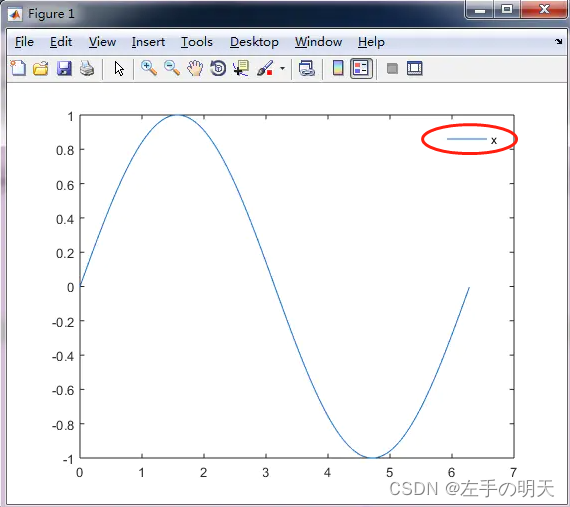
🚩去除legend边框
⭐️问题描述

⭐️解决方案
h = legend('x')
set(h,'box','off')
legend boxofft = 0:0.01:2*pi;
figure
plot(t,sin(t))
h = legend('x');
set(h,'box','off')

推荐阅读
(点击标题可跳转阅读)
【初学不要怕】教你全方位理解python函数及其使用(包括lambda函数和递归函数详解系列)
【加解密算法实现】全面剖析RSA加解密算法(附完整C/Python源码)
【专家推荐】保姆级开源工具推荐,一用一个爽,非常劲爆(收藏系列)
老铁,三连支持一下,好吗?↓↓↓


点分享

点点赞

点在看