
太赞了!100个案例,Matplotlib 从入门到大神!(附源代码)
大家好,今天来跟大家分享下 Matplotlib 从入门到进阶的精彩内容。
Matplotlib 是 Python数据科学生态系统中非常重要的一个 Python库,是 Python可视化中使用最多,同时其他许多可视化库也是在这个基础上衍生或延展而来的。
从下面这张图,可以看出 Matplotlib 在 Python可视化生态系统中的强大之处。
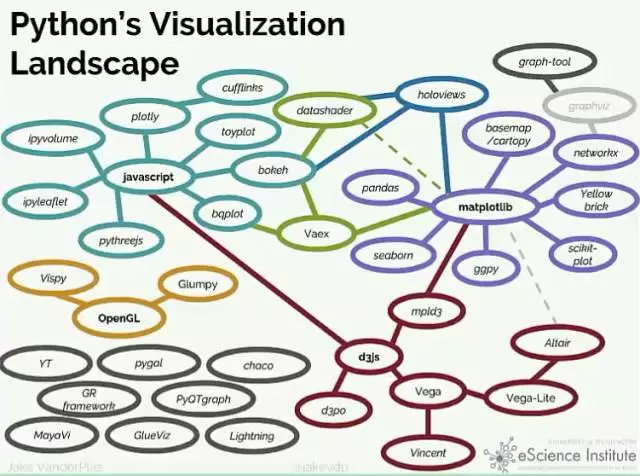
因此,熟练使用 Matplotlib 也是进阶 Python数据分析的必由之路。
这里给大家分享下国外一位大神写的 Python入门到进阶的内容,有差不多 100张图,很好的阐述了 Matplotlib 的基本用法。
Lemon 将内容全部整理成 pdf 文件,有 100 多页,大家可以来免费获取,主要内容如下:
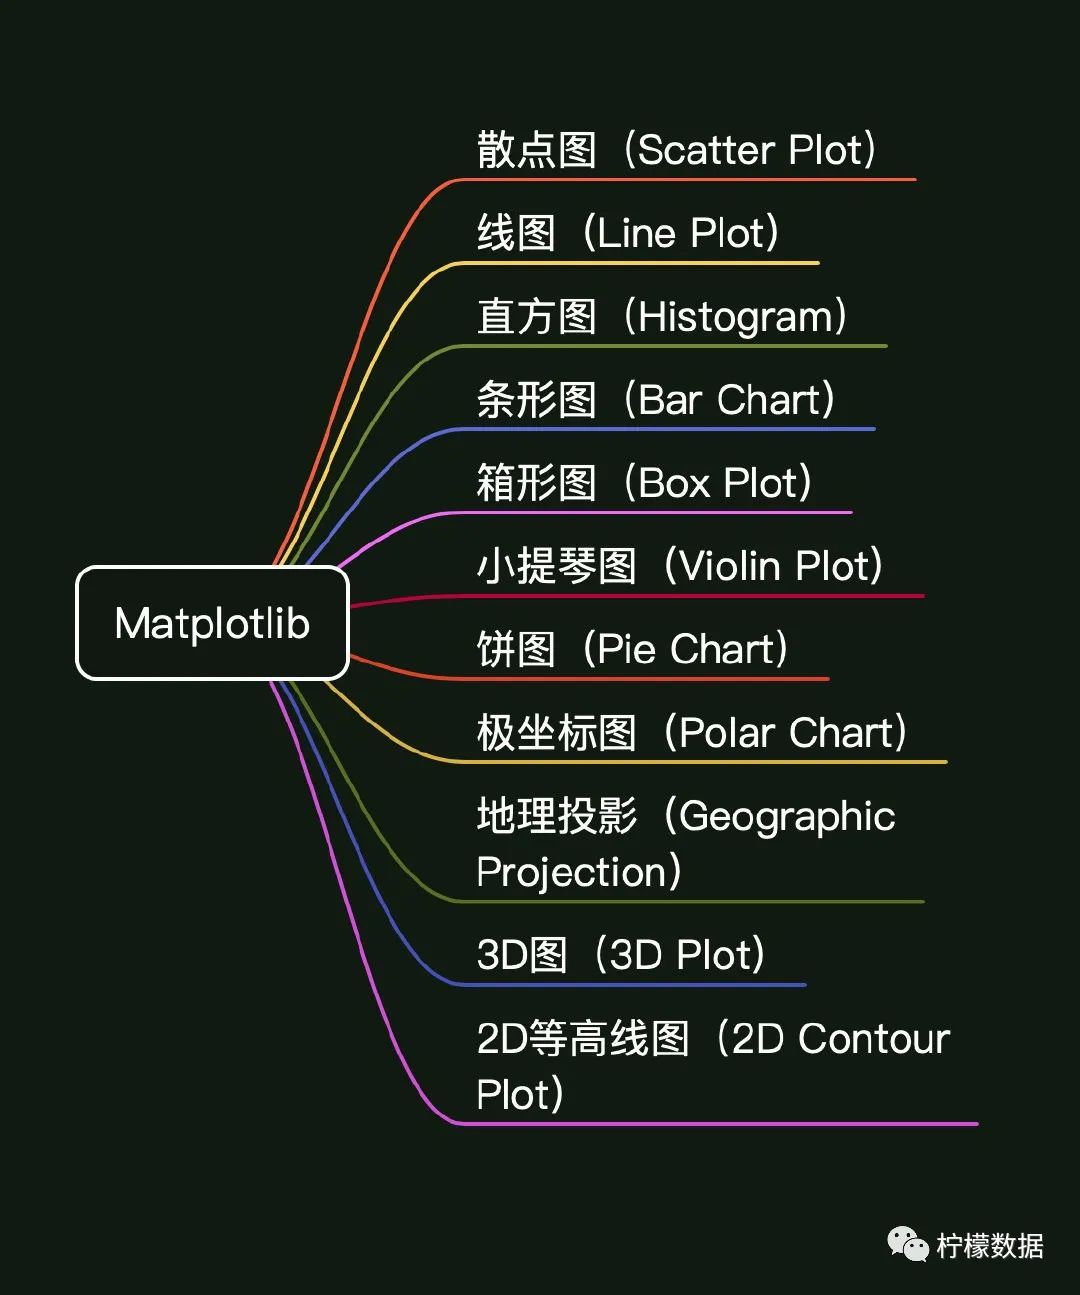
下面简单介绍下其中的部分内容:
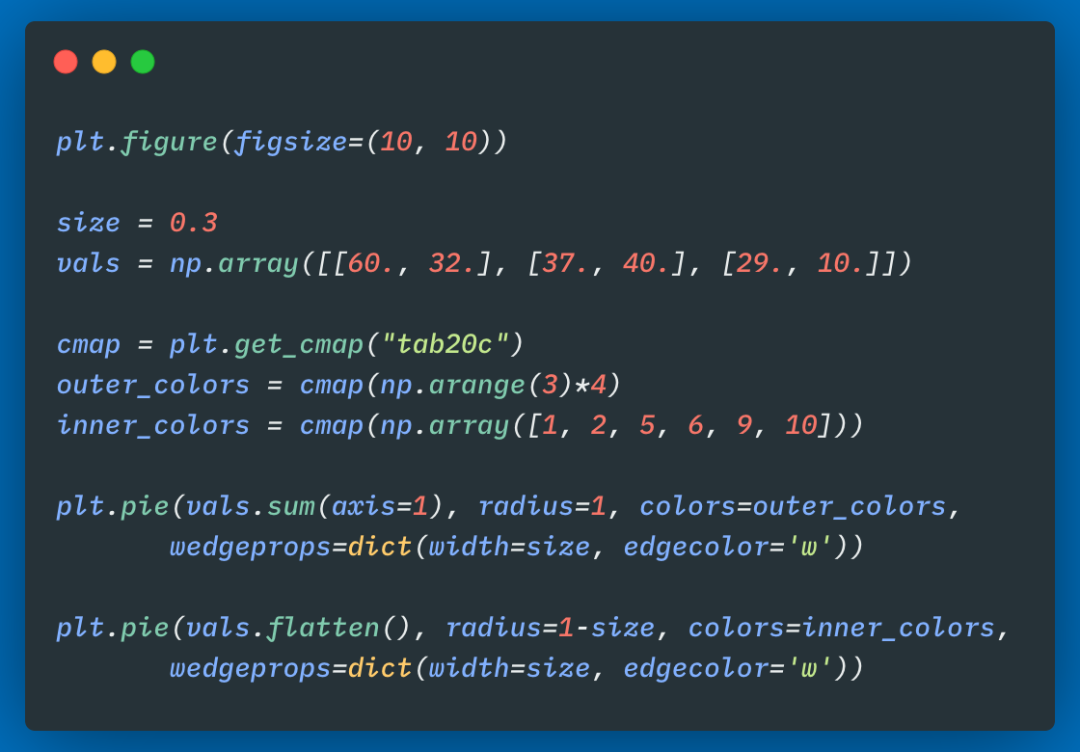
双层的环形图
效果如下图所示:

以下是生成上图的代码:
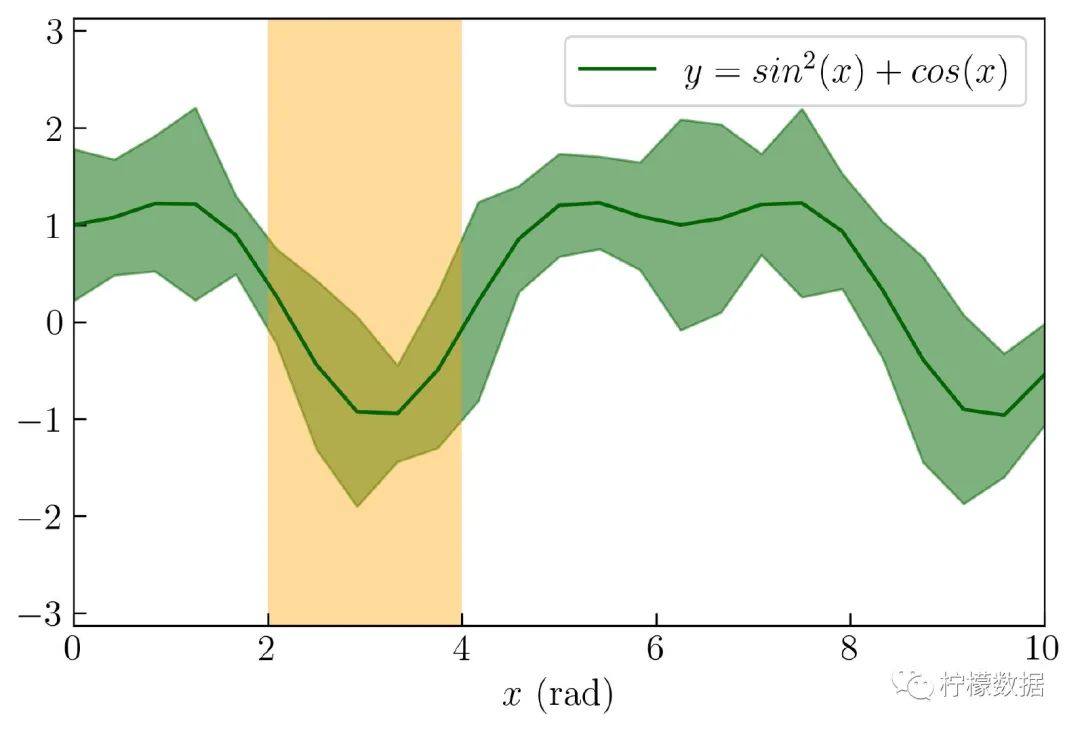
区间填充的折线图
效果如下图所示:
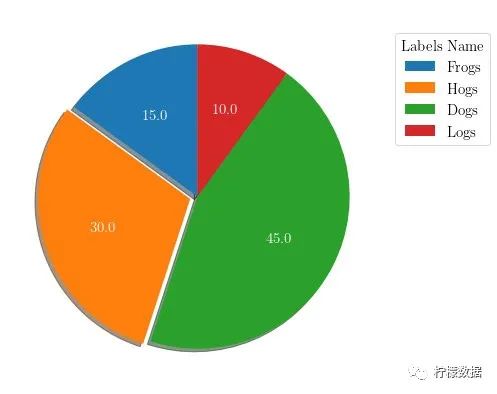
带阴影的饼图
效果如下图所示:
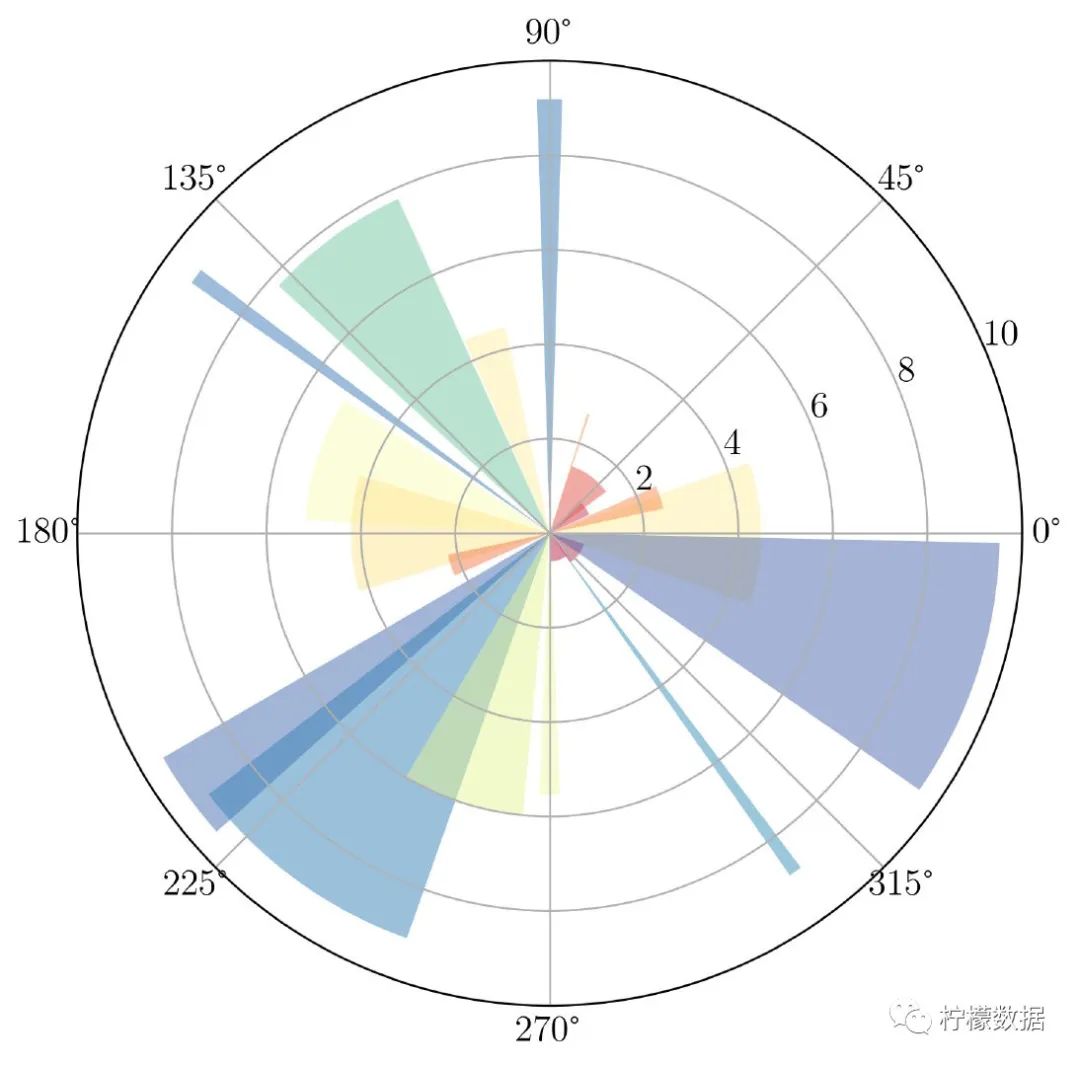
酷酷的极坐标图
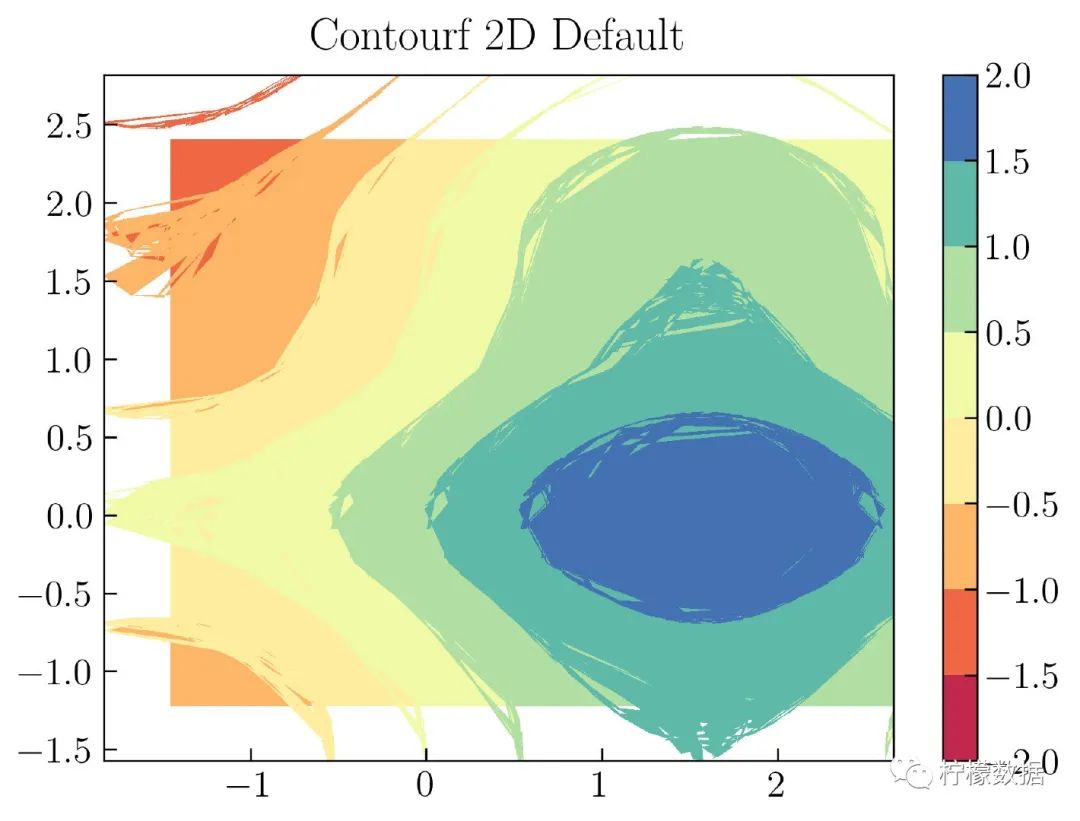
等高线图
效果如下图所示:
等等……
以上展示出来的案例,以及更多的 Matplotlib 绘图案例,在整理好的文件中均包含了完整的代码,大家可以免费来获取。
?长按上方二维码 2 秒 回复「mat」即可获取资料
评论