Python matplotlib绘制柱状图

一、数据准备
data = {"DWG-DRX1": [[(3, 2, 4), (2, 0, 4), (1, 0, 1), (3, 1, 4), (0, 0, 4)],[]],"DWG-DRX2": [[(1, 2, 8), (6, 1, 5), (2, 1, 8), (3, 1, 7), (0, 2, 7)],[]],"DWG-DRX3": [[(2, 2, 10), (7, 0, 6), (5, 0, 8), (3, 1, 6), (4, 4, 4)],[]],"SN-JDG1": [[(4, 2, 9), (3, 1, 9), (5, 1, 11), (7, 3, 10), (1, 6, 7)],[]],"SN-JDG2": [[(7, 2, 12), (7, 2, 14), (2, 0, 16), (9, 0, 12), (1, 4, 13)],[]],"SN-JDG3": [[(5, 1, 5), (5, 1, 9), (3, 1, 8), (3, 1, 7), (1, 3, 11)],[]],"SN-JDG4": [[(2, 2, 4), (3, 2, 5), (1, 0, 10), (7, 1, 5), (0, 2, 12)],[]],"TES-FNC1": [[(2, 3, 8), (4, 2, 6), (2, 0, 8), (6, 0, 8), (1, 0, 10)],[]],"TES-FNC2": [[(0, 2, 10), (8, 1, 4), (4, 0, 6), (4, 1, 5), (1, 2, 13)],[]],"TES-FNC3": [[(3, 1, 4), (3, 1, 9), (3, 1, 7), (7, 1, 2), (0, 2, 12)],[]],"TES-FNC4": [[(1, 2, 7), (10, 1, 7), (6, 2, 5), (0, 4, 16), (1, 4, 12)],[]],"TES-FNC5": [[(1, 2, 1), (4, 1, 6), (4, 0, 6), (4, 1, 5), (0, 1, 6)],[]],"G2-GEN1": [[(4, 0, 7), (2, 2, 11), (4, 1, 11), (6, 1, 6), (3, 0, 10)],[]],"G2-GEN2": [[(3, 3, 14), (4, 3, 12), (11, 0, 11), (9, 2, 13), (1, 3, 15)],[]],"G2-GEN3": [[(2, 5, 11), (7, 2, 10), (6, 3, 13), (7, 3, 11), (1, 1, 18)],[]],"DWG-G21": [[(4, 0, 12), (7, 2, 9), (4, 2, 11), (6, 0, 9), (1, 2, 8)],[]],"DWG-G22": [[(4, 2, 7), (5, 1, 9), (6, 2, 11), (7, 3, 9), (3, 1, 11)],[]],"DWG-G23": [[(3, 1, 9), (6, 2, 5), (5, 2, 6), (8, 2, 7), (0, 3, 13)],[]],"DWG-G24": [[(5, 0, 3), (2, 0, 7), (2, 0, 10), (2, 1, 3), (4, 1, 4)],[]],"SN-TES1": [[(5, 1, 5), (3, 1, 6), (1, 0, 4), (2, 3, 3), (0, 2, 3)],[]],"SN-TES2": [[(5, 1, 4), (1, 2, 5), (3, 1, 7), (3, 3, 4), (0, 0, 7)],[]],"SN-TES3": [[(3, 0, 7), (2, 2, 4), (2, 1, 4), (5, 2, 4), (1, 2, 7)],[]],"SN-TES4": [[(5, 2, 4), (1, 3, 16), (8, 1, 8), (6, 4, 9), (1, 8, 13)],[]],"DWG-SN1": [[(2, 2, 11), (5, 3, 9), (8, 1, 11), (4, 2, 12), (2, 4, 7)],[]],"DWG-SN2": [[(10, 1, 4), (2, 1, 10), (3, 3, 11), (3, 3, 10), (2, 4, 7)],[]],"DWG-SN3": [[(3, 3, 10), (5, 2, 8), (3, 3, 3), (5, 1, 6), (0, 2, 8)],[]],"DWG-SN4": [[(2, 0, 12), (8, 0, 7), (1, 3, 5), (9, 1, 5), (4, 3, 4)],[]],}
二、matplotlib绘制柱状图
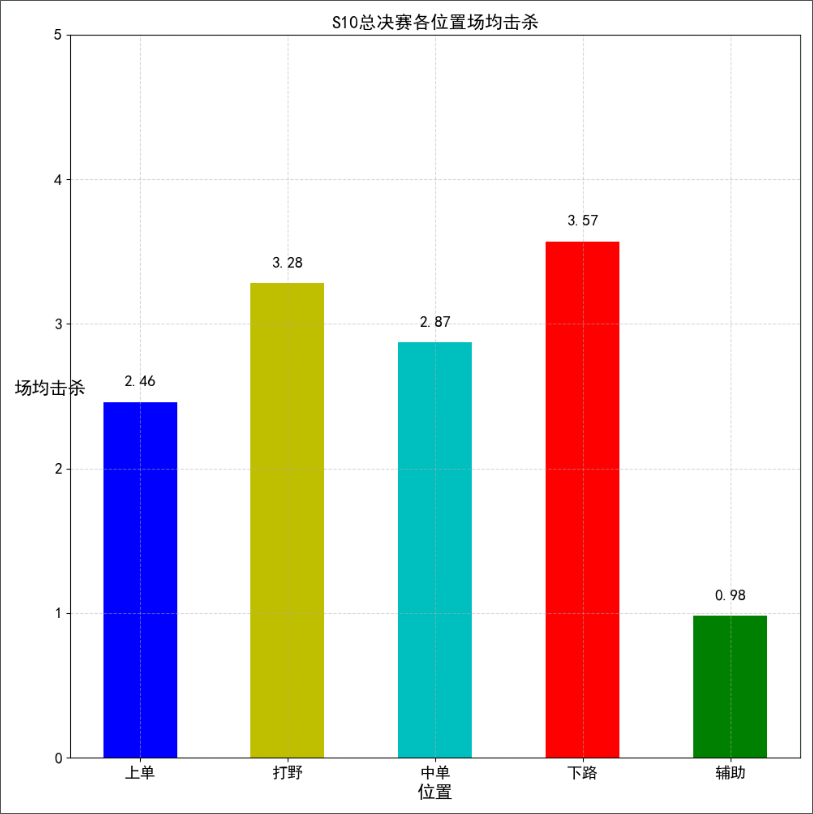
import matplotlib.pyplot as pltfrom numpy import meanlocation = ["上单", "打野", "中单", "下路", "辅助"]up_kill = [[team[0][0] for team in value] for value in data.values()]wild_kill = [[team[1][0] for team in value] for value in data.values()]mid_kill = [[team[2][0] for team in value] for value in data.values()]down_kill = [[team[3][0] for team in value] for value in data.values()]aux_kill = [[team[4][0] for team in value] for value in data.values()]# noinspection PyTypeCheckeravg_kill = [round(mean(kill), 2) for kill in [up_kill, wild_kill, mid_kill, down_kill, aux_kill]]plt.figure(figsize=(10, 10), dpi=100)plt.bar(location, avg_kill, width=0.5, color=['b', 'y', 'c', 'r', 'g'])plt.xticks(fontsize=14)plt.yticks(range(0, 6, 1), fontsize=14)for a, b in zip(range(5), avg_kill):plt.text(a, b+0.1, '%.02f' % b, ha='center', va='bottom', fontsize=14)plt.grid(linestyle="--", alpha=0.5)plt.xlabel("位置", fontsize=16)plt.ylabel("场均击杀", fontsize=16, rotation=0)plt.title("S10总决赛各位置场均击杀", fontsize=16)plt.show()

三、matplotlib绘制多组柱状图
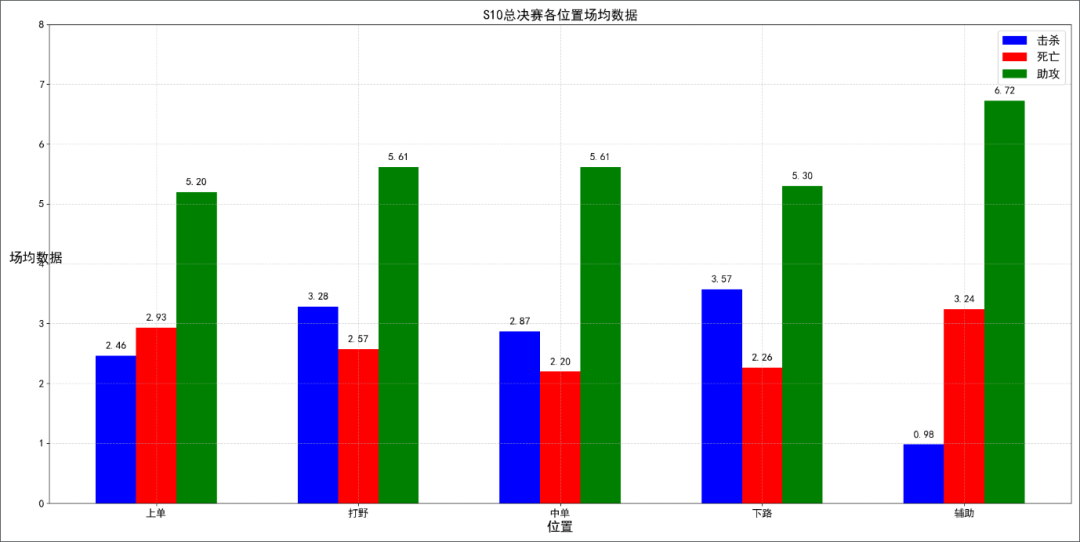
import matplotlib.pyplot as pltfrom numpy import meanlocation = ["上单", "打野", "中单", "下路", "辅助"]loc_kill, loc_die, loc_assists = [[list() for _ in range(5)] for _ in range(3)]for i in range(5):loc_kill[i] = [[team[i][0] for team in value] for value in data.values()]loc_die[i] = [[team[i][1] for team in value] for value in data.values()]loc_assists[i] = [[team[i][2] for team in value] for value in data.values()]avg_kill = [round(mean(kill), 2) for kill in loc_kill]avg_die = [round(mean(die), 2) for die in loc_die]avg_assists = [round(mean(assists), 2) for assists in loc_assists]plt.figure(figsize=(20, 10), dpi=100)x = range(len(location))plt.bar([i-0.2 for i in x], avg_kill, width=0.2, color='b')plt.bar(x, avg_die, width=0.2, color='r')plt.bar([i+0.2 for i in x], avg_assists, width=0.2, color='g')for a, b in zip(x, avg_kill):plt.text(a-0.2, b+0.1, '%.02f' % b, ha='center', va='bottom', fontsize=14)for a, b in zip(x, avg_die):plt.text(a, b+0.1, '%.02f' % b, ha='center', va='bottom', fontsize=14)for a, b in zip(x, avg_assists):plt.text(a+0.2, b+0.1, '%.02f' % b, ha='center', va='bottom', fontsize=14)plt.xticks(x, location, fontsize=14)plt.yticks(range(0, 9, 1), fontsize=14)plt.grid(linestyle="--", alpha=0.5)plt.legend(['击杀', '死亡', '助攻'], fontsize=16, markerscale=0.5)plt.xlabel("位置", fontsize=18)plt.ylabel("场均数据", fontsize=18, rotation=0)plt.title("S10总决赛各位置场均数据", fontsize=18)plt.show()

四、matplotlib绘制多张多组柱状图
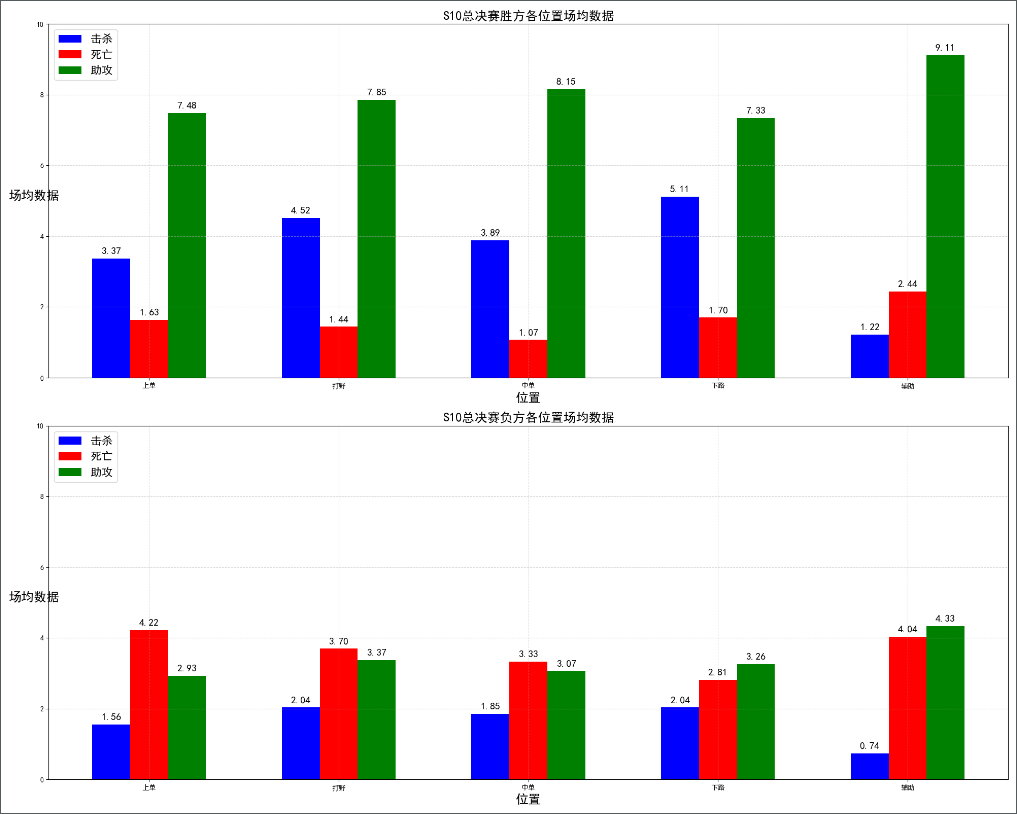
import matplotlib.pyplot as pltfrom matplotlib import tickerfrom numpy import meanlocation = ["上单", "打野", "中单", "下路", "辅助"]win_loc_kill, win_loc_die, win_loc_assists = [[list() for _ in range(5)] for _ in range(3)]lose_loc_kill, lose_loc_die, lose_loc_assists = [[list() for _ in range(5)] for _ in range(3)]for i in range(5):win_loc_kill[i] = [value[0][i][0] for value in data.values()]win_loc_die[i] = [value[0][i][1] for value in data.values()]win_loc_assists[i] = [value[0][i][2] for value in data.values()]lose_loc_kill[i] = [value[1][i][0] for value in data.values()]lose_loc_die[i] = [value[1][i][1] for value in data.values()]lose_loc_assists[i] = [value[1][i][2] for value in data.values()]win_avg_kill = [round(mean(kill), 2) for kill in win_loc_kill]win_avg_die = [round(mean(die), 2) for die in win_loc_die]win_avg_assists = [round(mean(assists), 2) for assists in win_loc_assists]lose_avg_kill = [round(mean(kill), 2) for kill in lose_loc_kill]lose_avg_die = [round(mean(die), 2) for die in lose_loc_die]lose_avg_assists = [round(mean(assists), 2) for assists in lose_loc_assists]fig, axs = plt.subplots(nrows=2, ncols=1, figsize=(20, 16), dpi=100)x = range(len(location))axs[0].bar([i-0.2 for i in x], win_avg_kill, width=0.2, color='b')axs[0].bar(x, win_avg_die, width=0.2, color='r')axs[0].bar([i+0.2 for i in x], win_avg_assists, width=0.2, color='g')axs[1].bar([i-0.2 for i in x], lose_avg_kill, width=0.2, color='b')axs[1].bar(x, lose_avg_die, width=0.2, color='r')axs[1].bar([i+0.2 for i in x], lose_avg_assists, width=0.2, color='g')for a, b in zip(x, win_avg_kill):axs[0].text(a-0.2, b+0.1, '%.02f' % b, ha='center', va='bottom', fontsize=14)for a, b in zip(x, win_avg_die):axs[0].text(a, b+0.1, '%.02f' % b, ha='center', va='bottom', fontsize=14)for a, b in zip(x, win_avg_assists):axs[0].text(a+0.2, b+0.1, '%.02f' % b, ha='center', va='bottom', fontsize=14)for a, b in zip(x, lose_avg_kill):axs[1].text(a-0.2, b+0.1, '%.02f' % b, ha='center', va='bottom', fontsize=14)for a, b in zip(x, lose_avg_die):axs[1].text(a, b+0.1, '%.02f' % b, ha='center', va='bottom', fontsize=14)for a, b in zip(x, lose_avg_assists):axs[1].text(a+0.2, b+0.1, '%.02f' % b, ha='center', va='bottom', fontsize=14)for i in range(2):axs[i].xaxis.set_major_locator(ticker.FixedLocator(x))axs[i].xaxis.set_major_formatter(ticker.FixedFormatter(location))axs[i].set_yticks(range(0, 11, 2))axs[i].grid(linestyle="--", alpha=0.5)axs[i].legend(['击杀', '死亡', '助攻'], loc='upper left', fontsize=16, markerscale=0.5)axs[i].set_xlabel("位置", fontsize=18)axs[i].set_ylabel("场均数据", fontsize=18, rotation=0)axs[0].set_title("S10总决赛胜方各位置场均数据", fontsize=18)axs[1].set_title("S10总决赛负方各位置场均数据", fontsize=18)plt.show()

评论
