Science | 单细胞分析人类胸腺发育的细胞图谱
关于人类胸腺细胞的发育及T细胞的发育成熟
NGS系列文章包括NGS基础、转录组分析 (Nature重磅综述|关于RNA-seq你想知道的全在这)、ChIP-seq分析 (ChIP-seq基本分析流程)、单细胞测序分析 (重磅综述:三万字长文读懂单细胞RNA测序分析的最佳实践教程 (原理、代码和评述))、DNA甲基化分析、重测序分析、GEO数据挖掘(典型医学设计实验GEO数据分析 (step-by-step) - Limma差异分析、火山图、功能富集)等内容。

The human thymus is the organ responsible for the maturation of many types of T cells, which are immune cells that protect us from infection. However, it is not well known how these cells develop with a full immune complement that contains the necessary variation to protect us from a variety of pathogens. By performing single-cell RNA sequencing on more than 250,000 cells, Park et al. examined the changes that occur in the thymus over the course of a human life. They found that development occurs in a coordinated manner among immune cells and with their developmental microenvironment. These data allowed for the creation of models of how T cells with different specific immune functions develop in humans.
?滑动查看?
该文章由Sanger研究所团队于2020年2月21日发表在Science上,题为A cell atlas of human thymic development defines T cell repertoire formation ,揭示人类胸腺细胞的发育及T细胞的发育成熟,对重建T细胞发育过程意义重大。
研究背景
胸腺介导T细胞的成熟和选择,在建立适应性免疫和中枢耐受中起着至关重要的作用。该器官在生命的早期退化、T细胞输出减少与年龄相关的癌症、感染和自身免疫性发病率相关。来自胎儿肝脏或骨髓的T细胞前体迁移到胸腺中,在那里它们分化成各种类型的成熟T细胞。胸腺微环境协同支持T细胞分化。尽管胸腺上皮细胞(TEC)对T细胞命运至关重要,但其他细胞类型也参与了该过程,例如进行抗原呈递的树突状细胞(DC)和支持TEC分化的间充质细胞。最近,单细胞RNA测序(scRNA-seq)揭示了小鼠胸腺器官发生的新型TECs。然而,人体器官以物种独特的模式和节奏成熟,因此需要对人类胸腺进行全基因组的全面研究。
T细胞发育涉及阶段性T淋巴细胞分化的并行过程,并伴随着用于抗原识别的多种TCR repertoire的获得。这是通过基因组重组过程实现的,该过程从多个基因组拷贝中选择变异(V),连接(J),在某些情况下还选择了多样性(D)基因片段。V(D)J基因重组可以优先包含某些基因片段,从而导致库的偏移(淋巴细胞发育中免疫球蛋白可变区基因片段经重组而形成完整可变区序列的过程。重链可变区基因由V、D、J各1个基因片段组成,轻链可变区基因由V、J各1个基因片段组成,VDJ基因均有多个拷贝,各片段通过随机组合(即重排)而形成多样性的抗体可变区。)。迄今为止,我们对VDJ重组和库偏倚的大多数了解都来自动物模型和人类外周血分析,而关于人胸腺TCR repertoire的综合数据很少。
在这里,作者应用scRNA-seq生成了胚胎、胎儿、幼儿和成年阶段胸腺细胞的综合转录组图谱,并将其与TCR repertoire分析相结合以重建T细胞分化过程。
研究方案
sample: 受孕后的7到17周之间抽取了跨越胸腺发育阶段的15个胚胎和胎儿胸腺,以及儿科和成年个体的9个产后胸腺(在所有参与者的书面知情同意下,根据《赫尔辛基2000年宣言》中的指南获得了本研究的所有组织样品)。通过FACS捕获表面Marker为CD45, CD3在, EpCAM的细胞。(CD45是免疫细胞的marker,CD3是T细胞的marker,EpCAM是上皮细胞的marker。)
测序数据分析介绍:
工具: Single Cell 3′ and 5′ Reagent Kit (10X Genomics),Illumina Nextera XT kit.
比对: Cell Ranger Single-Cell Software Suite (version 2.0.2 for 3′ chemistry and version 2.1.0 for 5′ chemistry, 10x Genomics Inc. ),GRCh38.
筛选:
Cells with fewer than 2000 UMI counts and 500 detected genes were considered as empty droplets and removed from the dataset. Cells with more than 7000 detected genes were considered as potential doublets and removed from the dataset.
结果分析
1. 整个生命周期中人胸腺的细胞组成
作者对15个产前胸腺进行了scRNA-seq检测,范围从7个PCW(受孕后的几周,post-conception weeks)(可分离出胸腺残基)到17个PCW(胸腺发育完成)(图1A和B),还分析了九个产后样本,涵盖了整个胸腺活动期。在单细胞转录组分析与TCRαβ谱分析结合之前,根据CD45、CD3或上皮细胞粘附分子(EpCAM)的表达对分离的单细胞进行分类,将胸腺细胞和非胸腺细胞分离获取。在进行QC后(对一篇单细胞RNA综述的评述:细胞和基因质控参数的选择),从产前胸腺中获得了138,397个细胞,从产后胸腺中获得了117,504个细胞。
利用标记基因将细胞亚群注释为40多种不同的细胞类型或细胞状态(图1C和1D)。分化中的T细胞在数据集中得到了很好的表示,包括双阴性(DN,CD4-CD8-)、双阳性(DP,CD4+CD8+)、CD4+单阳性(CD4+)、CD8+单阳性(CD8+)、FOXP3+调节性(Treg)、CD8αα+和γδT细胞。还确定了其他免疫细胞,包括B细胞、自然杀伤(NK)细胞、先天性淋巴样细胞(ILC)、巨噬细胞、单核细胞和DC。DC可以进一步分为髓样/常规DC1和DC2以及浆细胞样DC(pDC)。
该数据集还鉴定了非免疫细胞的胸腺微环境。作者将非免疫细胞进一步分型,包括TEC、成纤维细胞、血管平滑肌细胞(VSMC)、内皮细胞和淋巴管内皮细胞(图1E)。胸腺成纤维细胞鉴定为两种之前未被报道过的亚型:亚型1(Fb1)(COLEC11,C7,GDF10)和2型成纤维细胞(Fb2)(PI16,FN1,FBN1)(图1E)。Fb1细胞独特地表达COLEC11和ALDH1A2,COLEC11在先天免疫中起重要作用,ALDH1A2是负责产生视黄酸的酶,调节上皮细胞的生长。为了探索这些成纤维细胞亚型的定位模式,作者对Fb1和Fb2标记基因(COLEC11和FBN1)以及普通成纤维细胞(PDGFRA),内皮细胞(CDH5)和VSMC(ACTA2)标记基因进行原位杂交荧光染色定位(图1F)。结果表明,Fb1细胞为小叶周细胞,而Fb2细胞为小叶内细胞,通常与VSMC的大血管相关,这与其调节血管发育的基因的转录组谱一致,并证实了GDF10和ALDH1A2在小叶周围区域的表达(图1F)。
除成纤维细胞外,作者还鉴定了人类TEC(图1E)的亚群,例如髓质和皮质TEC(mTEC和cTEC)。为了注释人类TEC,作者将人类数据集与已发布的鼠TEC数据集进行了比较,确定物种之间保守的TEC亚群,包括PSMB11阳性cTEC、KRT14阳性mTEC(I)、表达AIRE的mTEC(II)和表达KRT1的mTEC(III)(图1E)。作者注意到了两种对人类具有特异性的EpCAM+细胞类型:(i)表达MYOD1和MYOG的肌样细胞[TEC(myo)s]和(ii)表达NEUROD1、NEUROG1-和CHGA的TEC(neuro)s,类似于神经内分泌细胞(图1E)。值得注意的是,与自身免疫性重症肌无力相关的CHRNA1,除了mTEC(II)以外,还由这两种细胞类型特异性表达(图1E),从而扩大了可能参与重症肌无力的耐受性诱导。为了支持这种可能性,作者检测到位于胸腺髓质中的MYOD1和NEUROG1表达细胞(图1F)。
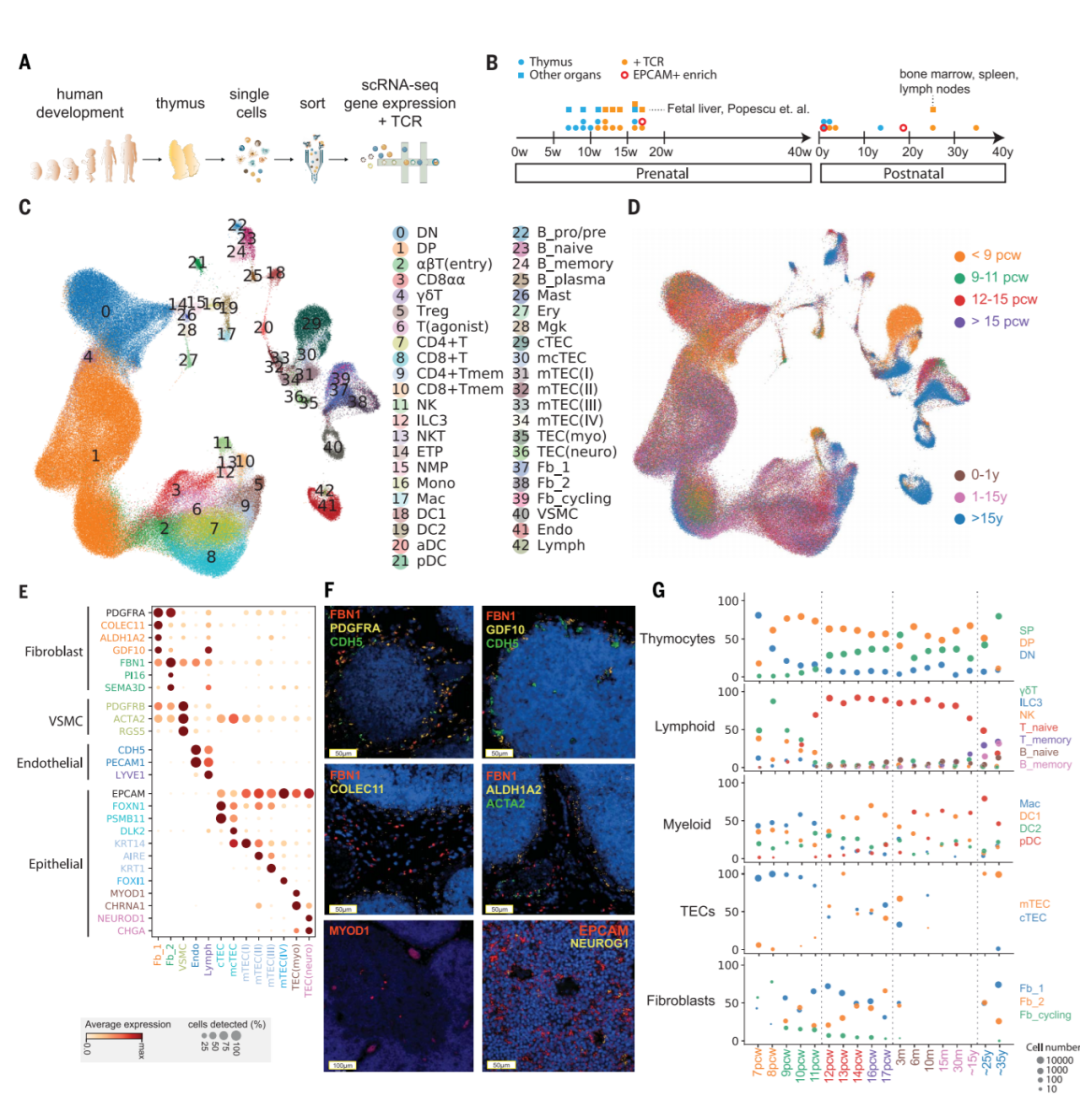
图1. Cellular composition of the developing human thymus
(A) Schematic of single-cell transcriptome profiling of the developing human thymus.
(B) Summary of gestational stage/age of samples, organs (circles denote thymus; rectangles denote fetal liver or adult bone marrow, adult spleen, and lymph nodes), and 10x Genomics chemistry (colors).
(C) UMAP visualization of the cellular composition of the human thymus colored by cell type (DN, double-negative T cells; DP, double-positive T cells; ETP, early thymic progenitor; aDC, activated dendritic cells; pDC, plasmacytoid dendritic cells; Mono, monocyte; Mac, macrophage; Mgk, megakaryocyte; Endo, endothelial cells; VSMC, vascular smooth muscle cells; Fb, fibroblasts; Ery, erythrocytes).
(D) Same UMAP plot colored by age groups, indicated by post-conception weeks (PCW) or postnatal years (y).
(E) Dot plot for expression of marker genes in thymic stromal cell types. Here and in later figures, color represents maximum-normalized mean expression of marker genes in each cell group, and size indicates the proportion of cells expressing marker genes.
(F) RNA smFISH in human fetal thymus slides with probes targeting stromal cell populations. Top left: Fb2 population marker FBN1 and general fibroblast markers PDGFRA and CDH5. Top right: Fb1 marker GDF10, FBN1, and CDH5. Middle left: Fb1 marker COLEC11 and FBN1. Middle right: Fb1 marker ALDH1A2, VSMC marker ACTA2, and FBN1. Bottom left: TEC(myo) marker MYOD1. Bottom right: Epithelial cell marker EPCAM and TEC(neuro) marker NEUROG1. Data are representative of two experiments.
(G) Relative proportion of cell types throughout different age groups. Dot size is proportional to absolute cell numbers detected in the dataset. Statistical testing for population dynamics was performed by t tests using proportions between stage groups. The x axis shows age of samples, which are colored in the same scheme as (D).
?滑动查看?
2. 胸腺基质和T细胞的协调发育
作者研究了整个发育过程中不同胸腺细胞类型的动力学(图1G)。
在早期胎儿样本(7至8个PCW)中,淋巴区包含NK细胞、γδT细胞和ILC3s,几乎没有分化的αβT细胞。分化的T细胞被发现主要是在7个PCW的样品的DN阶段。他们逐渐从DP发展到SP阶段,在12 PCW左右达到平衡,先天淋巴细胞的比例则是下降趋势。
值得注意的是,成人样本显示出胸腺变性的形态学证据。将胸腺与同一供体的脾脏和淋巴结的比较显示,胸腺中存在终末分化的T细胞,这表明终末分化的T细胞再次进入胸腺或出现循环细胞污染(图1G)。另一方面,表达IL10、穿孔素和颗粒酶的细胞毒性CD4+ T淋巴细胞(CD4+ CTL)在退化的胸腺样品中富集。在其他样本中也证实了记忆T细胞和B细胞增加的趋势(图1G;记忆T细胞的P=9.3×10^(-6),记忆B细胞的P=0.0096)。
胸腺基质细胞的相应变化反映了T细胞发育的趋势。作者观察到TEC亚群的时间变化与T细胞成熟的开始一致,从富集的cTECs转变到cTECs和mTECs的平衡(图1G;P=0.0054)。这支持了“thymic cross-talk”的概念,其中的上皮细胞和成熟的T细胞协同相互作用可以支持它们的相互分化。
此外,成纤维细胞的组成在发育过程中也发生了变化。上面提到的Fb1亚群在早期发育中占主导地位,而在较晚的发育时间点观察到了相似数量的Fb1和Fb2细胞(P=0.014),并且细胞周期相关细胞数量减少(图1G)。
最后,其他免疫细胞也在妊娠和产后生活中发生动态变化。早期妊娠期间巨噬细胞丰富,DC在整个发育过程中均增加(图1G)。12 PCW后DC1占主导,产后生活中pDC比例增加(巨噬细胞,P = 2.7×10^(–8);DC1,P = 1.05×10^(–3);DC2,P = 4.86×10^(–5))。
为了进一步研究介导胸腺基质和T细胞协调发展的因素,作者使用公共数据库CellPhoneDB.org系统研究了细胞相互作用,以预测在它们之间特异性表达的配体-受体对(哇!单细胞测序-配体受体互作分析原来可以这么简单又高大上!)。在预测的相互作用中,作者核对了已知跨不同细胞类型和发育阶段的参与胸腺发育的信号转导因子的表达模式。淋巴毒素信号转导(LTB:LTBR)来自多种免疫细胞,并被大多数基质细胞状态所接受。与此相反的是RANKL-RANK(TNFRSF11:TNFRSF11A)信号传导被限制在ILC3和mTEC(II)s/淋巴管内皮细胞之间。FGF信号传导(FGF7:FGFR2)来自于成纤维细胞向TECs发出信号,成年胸腺中FGFR2的表达减少。对于Notch信号传导,NOTCH1是早期胸腺祖细胞(ETP)中表达的主要受体,不同的细胞类型表达了不同的Notch配体:cTEC和内皮细胞均表达JAG2和DLL4,其他TEC则广泛表达JAG1。
3. 传统T细胞分化轨迹
当胸腺形成时,胎儿肝脏是主要的造血器官和来源,是造血干细胞和多能祖细胞(HSCs/MPPs)的来源,因此作者分析了来自同一胎儿的一对胸腺和肝脏样品。作者合并了胸腺和肝脏数据,并选择了包括肝HSC/MPP,胸腺ETP和DN胸腺细胞的细胞群进行数据分析(图2A和2B)。
为了研究下游T细胞分化轨迹(NBT|45种单细胞轨迹推断方法比较,110个实际数据集和229个合成数据集),作者决定显示分化T细胞的连续轨迹。为了证实这一轨迹的有效性,使用T细胞分化的标志性基因:CD4/CD8A/CD8B基因(图2D),细胞周期(CDK1)和重组(RAG1)基因(图2E)以及完全重组的TCRαs/TCRβs(图2F)。轨迹从CD4-CD8-DN细胞开始,逐渐表达CD4和CD8成为CD4+CD8+ DP细胞,然后过渡到CCR9highTαβ(进入)阶段,分化为成熟的CD4+或CD8+ SP细胞(图2D)。通过细胞周期基因的表达将DN和DP细胞分为两个阶段(图2E)。作者将具有强烈细胞周期特征的早期亚群称为增殖(P),将晚期亚群称为静止(Q)(图2C)。VDJ重组基因(RAG1和RAG2)的表达从增殖后期开始增加,并在静止期达到高峰。这种模式反映了每轮重组之前T细胞的增殖。
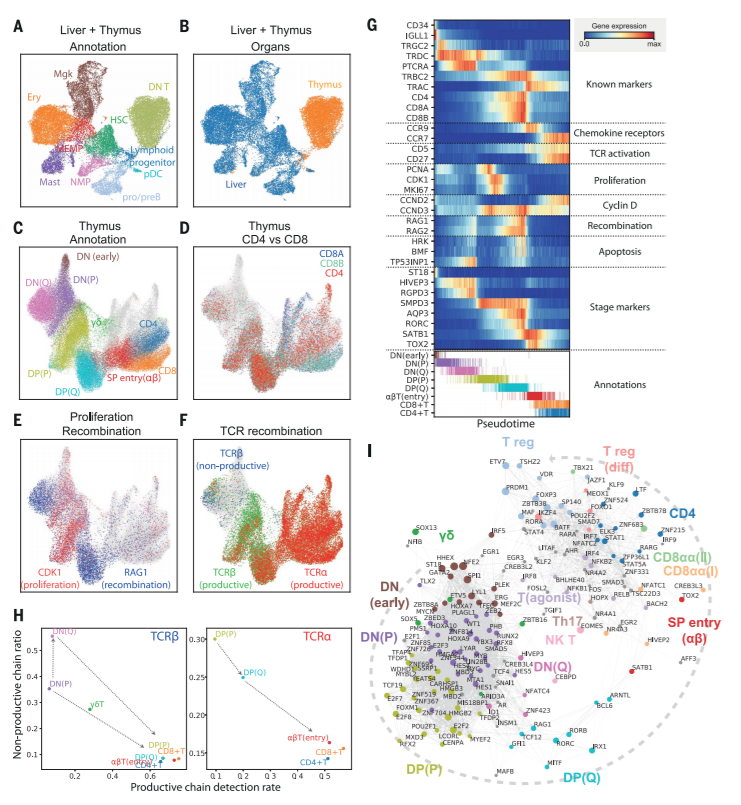
图2. Thymic seeding of early thymic progenitors (ETPs) and T cell differentiation trajectory
(A) UMAP visualization of ETP and fetal liver hematopoietic stem cells (HSCs) and early progenitors. NMP, neutrophil-myeloid progenitor; MEMP, megakaryocyte/erythrocyte/mast cell progenitor.
(B) The same UMAP colored by organ (liver in blue, thymus in yellow/red).
(C) UMAP visualization of developing thymocytes after batch correction. DN, double-negative T cells; DP, double-positive T cells; SP, single-positive T cells; P, proliferating; Q, quiescent). The data contain cells from all sampled developmental stages. Cells from abundant clusters are downsampled for better visualization. The reproducibility of structure is confirmed across individual samples. Unconventional T cells are in gray.
(D to F) The same UMAP plot showing CD4, CD8A, and CD8Bgene expression (D), CDK1 cell cycle and RAG1 recombination gene expression (E), and TCRα, productive TCRβ, and nonproductive TCRβ VDJ genes (F).
(G) Heat map showing differentially expressed genes across T cell differentiation pseudotime. Top: The x axis represents pseudo-temporal ordering. Gene expression levels across the pseudotime axis are maximum-normalized and smoothed. Genes are grouped by their functional categories and expression patterns. Bottom: Cell type annotation of cells aligned along the pseudotime axis. Colors are as in (C).
(H) Scatterplot showing the rate of productive chain detection within cells in specific cell types (x axis) and the ratio of nonproductive/productive TCR chains detected in specific cell types (y axis). Left: TCRβ; right, TCRα.
(I) Graph showing correlation-based network of transcription factors expressed by thymocytes. Nodes represent transcription factors; edge widths are proportional to the correlation coefficient between two transcription factors. Transcription factors with significant association to specific cell types are depicted in color. Node size is proportional to the significance of association to specific cell types.
?滑动查看?
4. Treg和非经典T细胞的发育
除了构成发育中胸腺T细胞中大多数的常规CD4+或CD8+ T细胞外,单细胞数据还按标记基因的表达进行分组,确定了多种非常规T细胞类型(图2I和图3A和3B)。
接下来,作者调查了这些非经典T细胞的发育是否依赖于胸腺。作者认为,如果一个细胞群体是胸腺依赖性的,它将在胸腺成熟(约10 PCW)后积累,并且相对于其他造血器官会在胸腺中富集。通过绘制散点图展示胎儿肝和胸腺之间以及胸腺成熟前后(10 PCW)每种细胞类型的相对丰度发现结果与这个想法一致,所有非常规T细胞都在胸腺富集,尤其是在胸腺成熟后,这表明它们是来源于胸腺(图3D)。
Tregs是胸腺中最丰富的非经典T细胞。在αβT细胞和Tregs之间有清晰的分化轨迹,作者将过渡态定义为区分的Treg(Treg(diff))(图3A)。相对于常规的Treg,Treg(diff)细胞的FOXP3和CTLA4表达较低,IKZF4、GNG8和PTGIR的表达则较高(图3B)。这些基因与自身免疫和Treg分化有关。
其他非经典T细胞群体包括CD8αα+ T细胞、NKT样细胞和TH17样细胞(图3B)。存在三种不同的CD8αα+ T细胞种群:GNG4+CD8αα+ T(I)细胞,ZNF683+CD8αα+ T(II)细胞和以EOMES标记的CD8αα+ NKT样细胞亚群(图3E)。GNG4+CD8αα+ T(I)细胞和ZNF683+CD8αα+ T(II)细胞在早期阶段共享PDCD1表达,并在其终末分化状态下降低。GNG4+CD8αα+ T(I)细胞显示出与DP晚期不同的轨迹(αβTSP进入细胞),而ZNF683+CD8αα+ T(II)细胞具有混合的αβ和γδT细胞信号,并位于GNG4+CD8αα+ T(I)细胞和γδT细胞旁边。
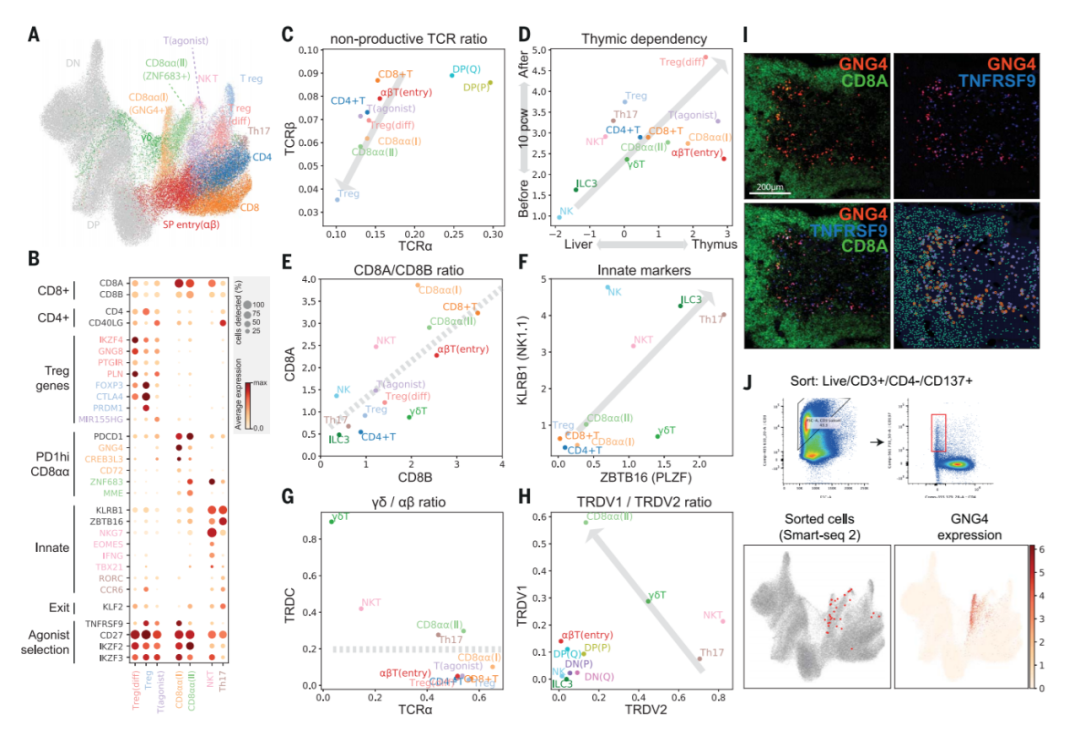
图3. Identification of GNG4+ CD8αα T cells in the thymic medulla
(A) UMAP visualization of mature T cell populations in the thymus. Axes and coordinates are as in 图2C. (The cell annotation color scheme used here is maintained throughout this figure.)
(B) Dot plot showing marker gene expression for the mature T cell types. Genes are stratified according to associated cell types or functional relationship.
(C) Scatterplot showing the ratio of nonproductive/productive TCR chains detected in specific cell types in TCRα chain (x axis) and TCRβ chain (y axis). The gray arrow indicates a trendline for decreasing nonproductive TCR chain ratio in unconventional versus conventional T cells.
(D) Scatterplot showing the relative abundance of each cell type between fetal liver and thymus (x axis) and before and after thymic maturation (delimited at 10 PCW) (y axis). Gray arrow indicates trendline for increasing thymic dependency.
(E to H) Scatterplots comparing the characteristics of unconventional T cells based on CD8A versus CD8B expression levels (E), KLRB1 versus ZBTB16 expression levels (F), TCRα productive chain versus TRDC detection ratio (G), and TRDV1 versus TRDV2 expression levels (H). Gray arrows or lines are used to set boundaries between groups [(E), (G), (H)] or to indicate the trend of innate marker gene expression (F).
(I) RNA smFISH showing GNG4, TNFRSF9, and CD8A in a 15 PCW thymus. Lower right panel shows detected spots from the image on top of the tissue structure based on 4′,6-diamidino-2-phenylindole (DAPI) signal. Color scheme for spots is the same as in the image.
(J) FACS gating strategy to isolate CD8αα(I) cells (live/CD3+/CD4–/CD137+) and Smart-seq2 validation of FACS-isolated cells projected to the UMAP presentation of total mature T cells from the discovery dataset (lower left). GNG4 expression pattern is overlaid onto the same UMAP plot (lower right).
?滑动查看?
5. 胸腺髓质中GNG4+CD8ααT细胞的发现和表征
在确定了非经典T细胞及其在胸腺T细胞发育中的起源后,作者将重点放在新型GNG4+CD8αα+ T(I)细胞上,因为它们具有独特的基因表达谱(GNG4,CREB3L3和CD72),这与CD8αα+ T(II)细胞形成对比,CD8αα+ T(II)表达CD8αα+ T细胞的已知标记基因,例如ZNF683和MME(53)。此外,胸腺迁徙的调节因子KLF2在CD8αα+ T(I)细胞中的表达水平极低,这表明它们可能是胸腺驻留(图3B)。为了定位和验证CD8αα+ T(I)细胞,作者在胎儿胸腺组织切片中进行了靶向GNG4的RNA smFISH,GNG4 RNA探针鉴定出一组富含胸腺髓质并与CD8A RNA共定位的细胞(图3I)。
由于CD137是CD8αα+ T(I)细胞和Tregs的表面marker基因,作者使用该marker富集了这些细胞,然后使用CD3 +CD137+CD4- FACS进一步细化,这样能够特异性富集CD8αα+ T(I)细胞,并通过Smart-seq2 scRNA seq确认其身份,从而为这些细胞提供更多的转录表型(图3J)。
6. 胸腺细胞选择的DC招募和激活
T细胞的选择由特异性的TEC和DC协调。作者首先确定了三个以前表征明确的胸腺DC亚型:DC1(XCR1+CLEC9A+),DC2(SIRPA+CLEC10A+)和pDC(IL3RA+CLEC4C +)。然后作者还鉴定了以前没有描述的细胞群,称其为“活化的DC”(aDC),其特征在于LAMP3和CCR7表达(图4A和B)。aDCs表达高水平的趋化因子和共刺激分子,以及转录因子,表明它们可能与人类扁桃体和胸腺中先前描述的AIRE+CCR7+ DC相对应。
单细胞数据揭示了aDC组中的三个亚组,分别由不同的基因表达谱识别:aDC1、aDC2和aDC3(图4A和B)。aDC1和aDC2亚型分别与DC1和DC2共享部分标记基因。为了系统地比较aDC亚型和经典DC,作者通过总结marker基因的表达来计算每个DC亚群的同一性得分,并证明了aDC1-DC1和aDC2-DC2对之间存在明确的关系,这表明每种aDC亚型均来自不同的DC群体。有趣的是,aDC1和aDC2显示出不同的趋化因子表达模式,这说明了这些aDC的功能多样化(图4B)。此外,相对于其他aDC亚群,aDC3细胞的II类主要组织相容性复合物(MHC)和共刺激分子表达降低,这可能反映了激活后的DC状态。确定了两个典型的TECs和各种DC亚群后,作者再使用CellPhoneDB分析来鉴定这些抗原呈递细胞与分化T细胞之间的特异性相互作用。
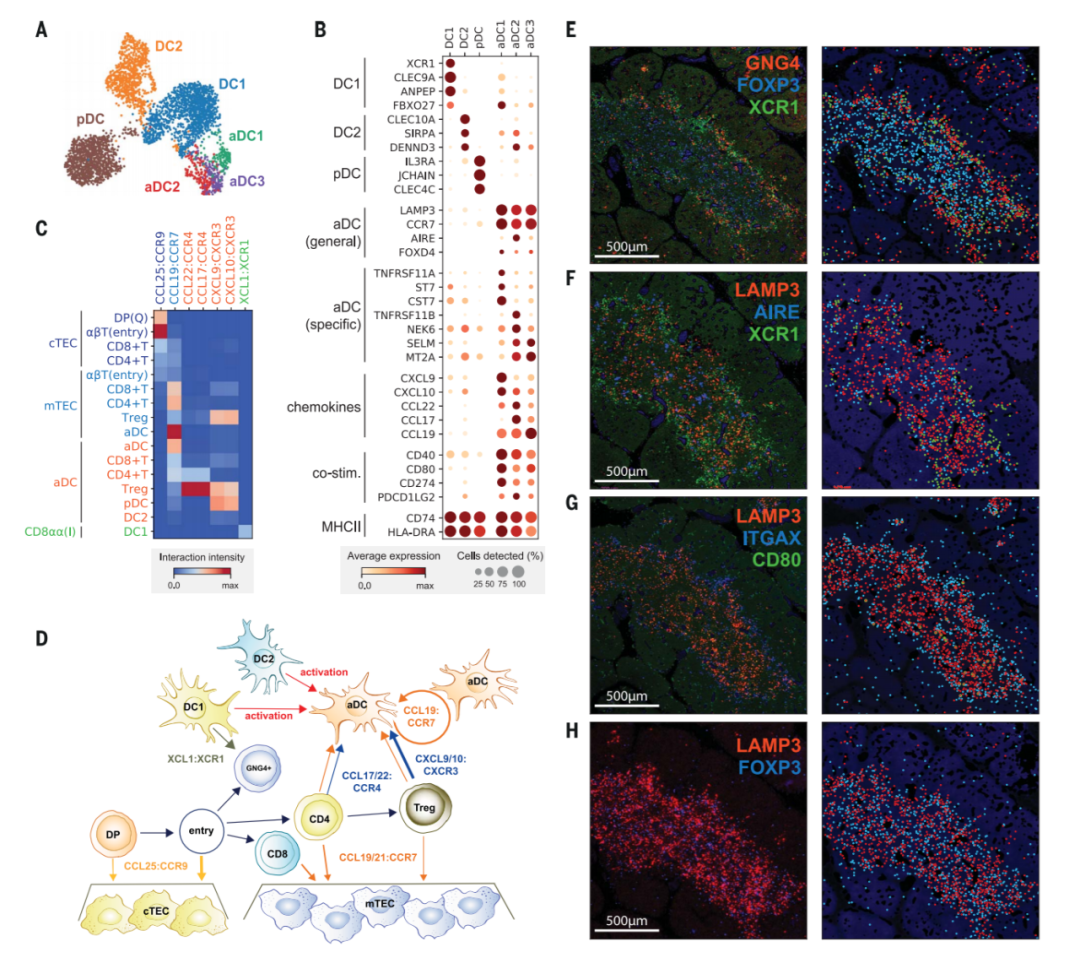
图4. Recruitment and activation of dendritic cells for thymocyte selection
(A and B) UMAP visualization of thymic DC populations (A) and dot plot of their marker genes (B).
(C) Heat map of chemokine interactions among T cells, DCs, and TECs, where the chemokine is expressed by the outside cell type and the cognate receptor by the inside cell type.
(D) Schematic model summarizing the interactions of TECs, DCs, and T cells. The ligand is secreted by the cell at the beginning of an arrow, and the receptor is expressed by the cell at the end of that arrow.
(E) Left: RNA smFISH detection of GNG4, XCR1, and FOXP3 in 15 PCW thymus. Right: Computationally detected spots are shown as solid circles over the tissue structure based on DAPI signal. Color schemes for circles are the same as in the image.
(F to H) Sequential slide sections from the same sample are stained for the detection of LAMP3, AIRE, and XCR1 (F), LAMP3, ITGAX, and CD80 (G), and LAMP3and FOXP3 (H). Spot detection and representation are as in (E). Data are representative of two experiments.
?滑动查看?
7. 人TCR repertoire构成和选择中的偏移
从富含TCR的5’测序文库中检测到TCR链,对其进行全长重组体的过滤,并与细胞类型注释关联,这样能够分析TCR repertoire的形成和选择模式(图5A和5B)
对于TCRβ位点,作者观察到VDJ基因的使用存在强烈偏移,这种偏移从重组(DN细胞)开始到成熟的T细胞阶段持续存在(图5A)。重组信号序列(RSS)得分未能解释该偏移。在小鼠中观察得到偏移确实与基因组位置有很好的相关性,这与基因座的环状结构是一致的(图5C),但是在小鼠中未发现在人体内可以观察到的V基因使用偏移。作者还观察到D2基因与J2基因有优先关联,而D1基因可以与J1和J2基因以相似的频率重组。TCRβV-D或V-J对之间则没有明确的关联。
对于TCRα位点,作者发现发育时机与VJ配对之间存在明确的关联:首先重组近端对,然后重组远端对(图5B),这反过来又限制了V、J基因之间的配对。这为TCRα基因座进行重组提供了直接证据(图5D)。另外相对于DP细胞,近端对在成熟T细胞中耗竭,这表明在阳性选择步骤中存在进一步的偏差。
为了研究不同细胞类型之间是否存在差异性TCR repertoire偏倚,作者通过主成分分析比较不同细胞类型的TCR repertoire(图5E),观察到CD8+ T细胞和其他细胞类型清晰地分开。而且相对于其他细胞类型,CD8+ T细胞的TRAV-TRAJ repertoire偏向远端V-J对(图5F)。考虑到远端repertoire是在TCRα重组的后期产生的,这可能是CD8+ T谱系的反应较慢或效率较低造成的(图5D)。
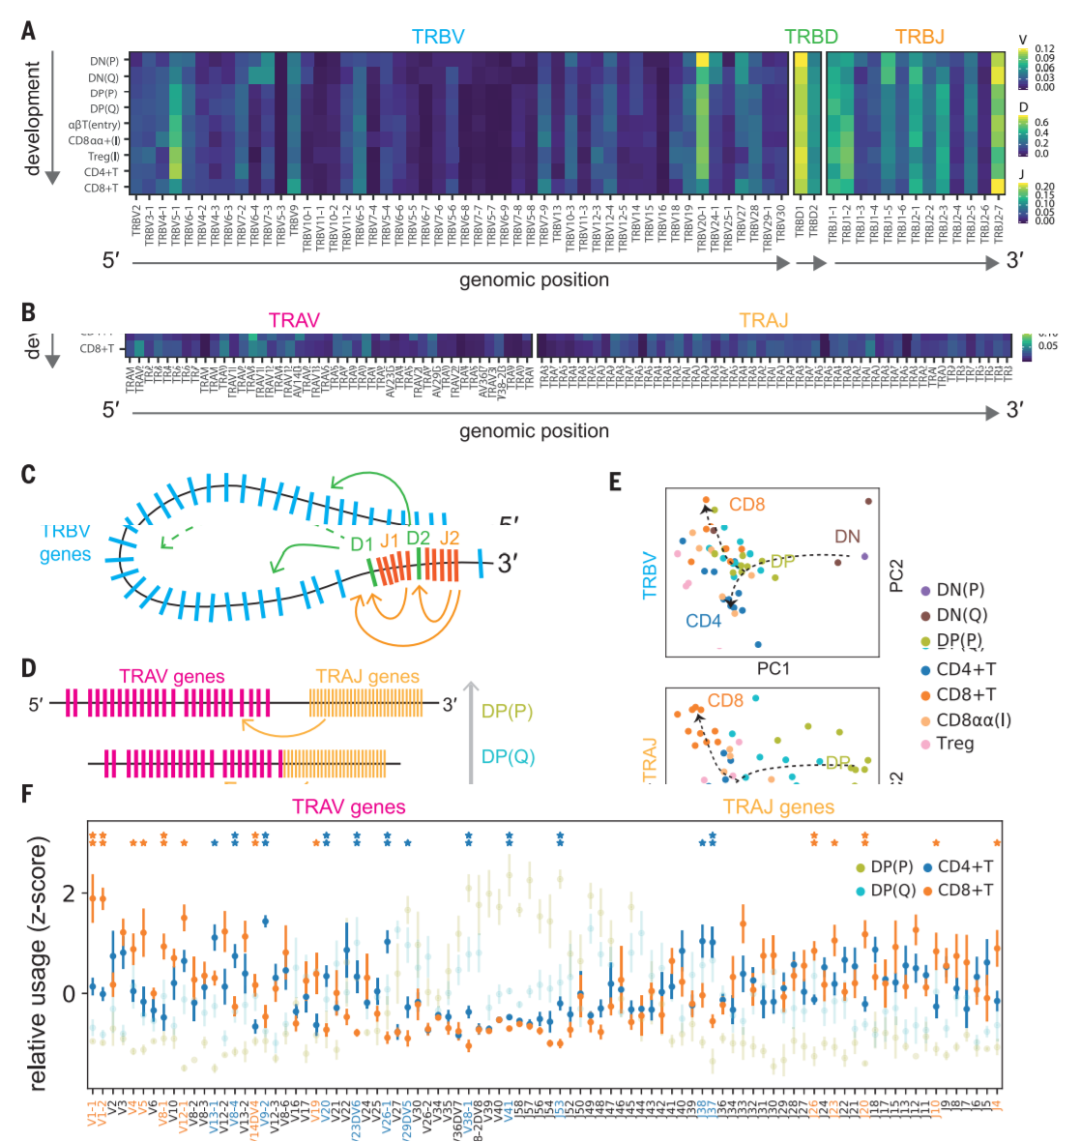
图5. Intrinsic bias in human TCR repertoire formation and selection
(A) Heat map showing the proportion of each TCRb V, D, and J gene segment present at progressive stages of T cell development. Gene segments are positioned according to genomic location.
(B) Same scheme as in (A) applied to TCRa V and J gene segments. Although there is a usage bias of segments at the beginning of development, segments are evenly used by the late developmental stages, indicating progressive recombination leading to even usage of segments.
(C and D) Schematics illustrating a hypothetical chromatin loop that may explain genomic location bias in recombination of TCRb locus (C) and the mechanism of progressive recombination of TCRa locus leading to even usage of segments (D).
(E) Principal components analysis plots showing TRBV or TRAV and TRAJ gene usage pattern in different Tcell types. Arrows depict T cell developmental order. For TRBV, there is a strong effect from beta selection, after which point the CD4+ and CD8+ repertoires diverge. The development for TRAV+ TRAJ is more progressive, with stepwise divergence into the CD4+ and CD8+ repertoires.
(F) Relative usage of TCRa V and J gene segments according to cell type. The z-score for each segment is calculated from the distribution of normalized proportions stratified by the cell type and sample. P value is calculated by comparing z-scores in CD4+ T and CD8+ T cells using t test, and false discovery rate (FDR) is calculated using BenjaminiHochberg correction: P < 0.05, *FDR < 10%. Gene names and asterisks are colored by significant enrichment in CD4+ T cells (blue) or CD8+ T cells (orange).
?滑动查看?
参考文献
Park JE, Botting RA et al. A cell atlas of human thymic development defines T cell repertoire
formation. Science. 2020 Feb 21;367(6480). pii: eaay3224. doi 10.1126/science.aay3224
文章解读:Tiger
文章校对:生信宝典
你可能还想看
往期精品(点击图片直达文字对应教程)
后台回复“生信宝典福利第一波”或点击阅读原文获取教程合集


