机器学习模型可解释性的6种Python工具包,总有一款适合你!
点击左上方蓝字关注我们

作者 | 木瓜子@知乎
链接 | https://zhuanlan.zhihu.com/p/385424638
在这篇文章中,我想向大家介绍我的一些顶级机器学习可解释性 Python 工具包,有所收获,欢迎点赞分享。
我们开始吧!
1、Yellowbrick
Yellowbrick 是一个开源的 Python 包,它通过可视化分析和诊断工具扩展了 scikit-learn API。对数据科学家而言,Yellowbrick 用于评估模型性能和可视化模型行为。
Yellowbrick 是一个多用途软件包,你可以在日常建模工作中使用。尽管来自 Yellowbrick 的大多数解释API都处于基本级别,但它对于我们的第一个建模步骤仍然有用。
让我们用一个数据集示例来尝试 Yellowbrick 包。对于初学者,让我们安装软件包。
pip install yellowbrick
安装完成后,我们可以使用 Yellowbrick 的 dataset 示例来测试包。
#Pearson Correlation
from yellowbrick.features import rank2d
from yellowbrick.datasets import load_credit
X, _ = load_credit()
visualizer = rank2d(X)
 通过一条直线,我们可以使用 Pearson 相关方法来可视化特征之间的相关性。它是可定制的,因此你可以使用另一个相关函数。
让我们尝试开发模型来评估模型性能并解释模型。我将使用 Yellowbrick 用户指南中的示例数据集,并生成一个判别阈值图,以找到分隔二进制类的最佳阈值。
from yellowbrick.classifier import discrimination_threshold
from sklearn.linear_model import LogisticRegression
from yellowbrick.datasets import load_spam
X, y = load_spam()
visualizer = discrimination_threshold(LogisticRegression(multi_class="auto", solver="liblinear"), X,y)
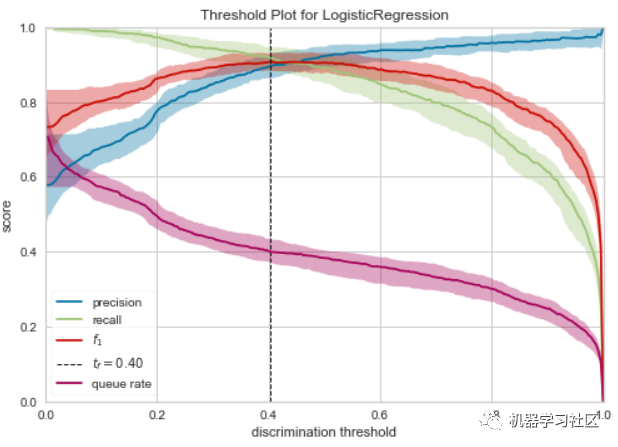
使用 Yellowbrick 阈值图,我们可以解释模型在0.4概率阈值下表现最好。
如果你想知道 Yellowbrick 能做什么,请访问主页了解更多信息。
https://www.scikit-yb.org/en/latest/about.html
2、ELI5
ELI5 是一个 Python 包,有助于机器学习的可解释性。取自Eli5软件包,此软件包的基本用法是:
检查模型参数,试图弄清楚模型是如何全局工作的 检查模型的单个预测,并找出模型做出决策的原因
如果 Yellowbrick 侧重于特征和模型性能解释,ELI5 侧重于模型参数和预测结果。就我个人而言,我更喜欢 ELI5,因为它的解释非常简单,商业人士可以理解它。
让我们用一个示例数据集和随机森林模型分类器来尝试 ELI5 包。我将使用 seaborn 包中的数据集,因为它是最简单的数据集。
#Preparing the model and the dataset
from sklearn.ensemble import RandomForestClassifier
from sklearn.model_selection import train_test_split
mpg = sns.load_dataset('mpg').dropna()
mpg.drop('name', axis =1 , inplace = True)
#Data splitting
X_train, X_test, y_train, y_test = train_test_split(mpg.drop('origin', axis = 1), mpg['origin'], test_size = 0.2, random_state = 121)
#Model Training
clf = RandomForestClassifier()
clf.fit(X_train, y_train)
最基本的 ELI5 函数是表示分类器权重和分类器预测结果。让我们尝试这两个函数来理解解释是如何产生的。
import eli5
eli5.show_weights(clf, feature_names = list(X_test.columns))
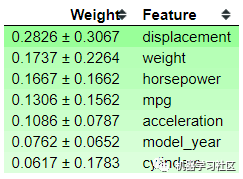
从上图中,可以看到分类器显示了分类器特征的重要性及其偏差。你可以看到'displacement'特征是最重要的特征,但是它们有很高的偏差,这表明模型中存在偏差。让我们试着展示一下预测结果的可解释性。
eli5.show_prediction(clf, X_train.iloc[0])

利用 ELI5 的 show_prediction 函数,得到特征贡献信息。哪些特征对某些预测结果有贡献?这些特征对概率的影响有多大。这是一个很好的函数,你可以轻松地向业务人员解释模型预测。
但是,最好记住上面的函数是基于树的解释(因为我们使用随机森林模型)。它可能足够好给你一个商业人士的解释;然而,由于模型的原因,它可能是有偏差的。这就是为什么 ELI5 提供了另一种基于模型度量来解释黑盒模型的方法——它被称为置换重要性(Permutation Importance)。
让我们先试试置换重要性函数。
#Permutation Importance
perm = PermutationImportance(clf, scoring = 'accuracy',random_state=101).fit(X_test, y_test)
show_weights(perm, feature_names = list(X_test.columns))
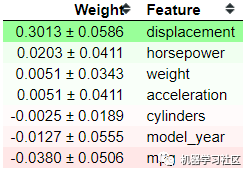
置换重要性背后的思想是评分(准确度、精确度、召回等)如何随特征的存在或不存在而变化。从以上结果可以看出,displacement 的得分最高,为0.3013。当置换位移特征时,模型的精度会有0.3013的变化。正负号后面的值就是不确定值。置换重要性法的本质上是一个随机过程;这就是为什么我们有不确定值。
位置越高,影响得分的特征就越关键。底部的一些特征显示一个负值,这很有趣,因为这意味着当我们排列特征时,该特征会增加得分。就我个人而言,ELI5 为我提供了足够的机器学习解释能力。如果你想了解更多,可以参考如下链接:
https://github.com/TeamHG-Memex/eli5
3、SHAP
我之前文章中已多次提及了,如果我们在讨论机器学习的解释性,SHAP 是绕不开的。对于从未听说过的人,SHAP或(SHapley Additive exPlanations)是一种博弈论方法,用来解释任何机器学习模型的输出。简单地说,SHAP 是使用 SHAP 值来解释每个特性的重要性。
让我们尝试使用示例数据集和模型来更详细地解释SHAP。首先,我们需要安装SHAP包。
#Installation via pip
pip install shap
#Installation via conda-forge
conda install -c conda-forge shap
在这个示例中,我将使用泰坦尼克号示例数据集。
#Preparing the model and the dataset
from sklearn.ensemble import RandomForestClassifier
from sklearn.model_selection import train_test_split
titanic = sns.load_dataset('titanic').dropna()
titanic = titanic[['survived', 'age', 'sibsp', 'parch']]
#Data splitting for rfc
X_train, X_test, y_train, y_test = train_test_split(titanic.drop('survived', axis = 1), titanic['survived'], test_size = 0.2, random_state = 121)
#Model Training
clf = RandomForestClassifier() clf.fit(X_train, y_train)
我们已经用泰坦尼克号的数据训练了我们的数据,现在我们可以试着用SHAP来解释数据。让我们使用模型的全局可解释性来理解SHAP是如何工作的。
import shap
shap_values = shap.TreeExplainer(clf).shap_values(X_train) shap.summary_plot(shap_values, X_train)
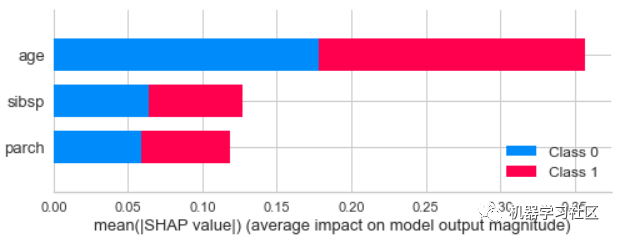
从预测结果可以看出,年龄特征对预测结果的贡献最大。如果你想查看特定的类对预测的贡献,我们只需要稍微调整一下代码。假设我们想看看类0,这意味着我们使用以下代码。
shap.summary_plot(shap_values[0], X_train)
 从上图中,我们可以看到每个数据对预测概率的贡献。颜色越红,值越高,反之亦然。此外,当值为正时,它有助于0级预测结果概率。
SHAP不局限于全局可解释性;它还提供了解释单个数据集的函数。让我们试着解释第一行的预测结果。
explainer = shap.TreeExplainer(clf)
shap_value_single = explainer.shap_values(X = X_train.iloc[0,:])
shap.force_plot(base_value = explainer.expected_value[1],shap_values = shap_value_single[1],features = X_train.iloc[0,:])
 从上图中可以看出,预测更接近于类0,因为它是由年龄和 sibsp 特征推送的,而parch特征只提供了一点贡献。
4、Mlxtend
Mlxtend 是一个用于数据科学日常工作的 Python 包。包中的api不仅限于可解释性,还扩展到各种功能,如统计评估、数据模式、图像提取等。但是,我们将讨论我们当前文章的可解释性API—决策区域。
Decision Regions plot API 将生成一个 Decision region plot,以可视化特征如何决定分类模型预测。让我们尝试使用示例数据和Mlxtend的指南。
首先,我们需要安装 Mlxtend 包。
pip install Mlxtend
然后,我们使用示例数据集并开发一个模型来查看 MLXTEN 的操作。
import numpy as np
import matplotlib.pyplot as plt
import matplotlib.gridspec as gridspec
import itertools
from sklearn.linear_model import LogisticRegression
from sklearn.svm import SVC
from sklearn.ensemble import RandomForestClassifier
from mlxtend.classifier import EnsembleVoteClassifier
from mlxtend.data import iris_data
from mlxtend.plotting import plot_decision_regions
# Initializing Classifiers
clf1 = LogisticRegression(random_state=0)
clf2 = RandomForestClassifier(random_state=0)
clf3 = SVC(random_state=0, probability=True)
eclf = EnsembleVoteClassifier(clfs=[clf1, clf2, clf3], weights=[2, 1, 1], voting='soft')
# Loading some example data
X, y = iris_data()
X = X[:,[0, 2]]
# Plotting Decision Regions
gs = gridspec.GridSpec(2, 2)
fig = plt.figure(figsize=(10, 8))
for clf, lab, grd in zip([clf1, clf2, clf3, eclf],['Logistic Regression', 'Random Forest','RBF kernel SVM', 'Ensemble'],itertools.product([0, 1], repeat=2)):
    clf.fit(X, y)
    ax = plt.subplot(gs[grd[0], grd[1]])
    fig = plot_decision_regions(X=X, y=y, clf=clf, legend=2)
    plt.title(lab)
plt.show()
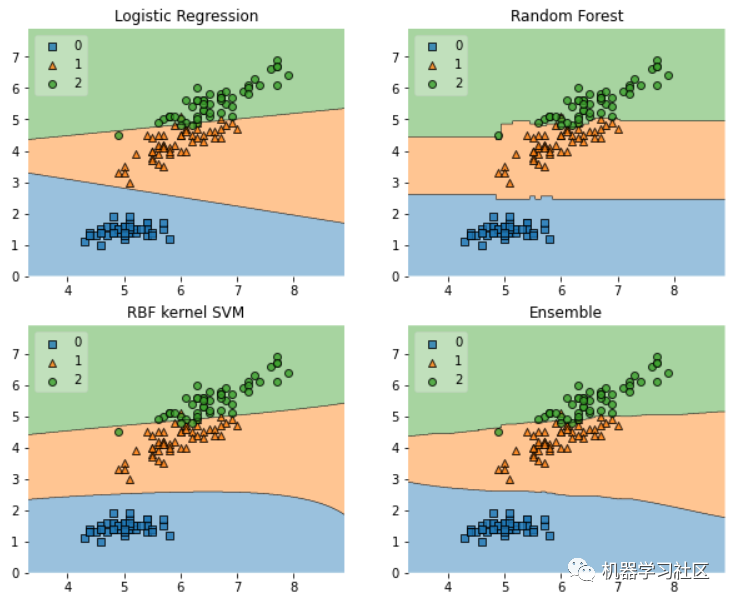
从以上情节可以解释模型的决策。当每个模型进行预测时,可以看到它们之间的差异。例如,一类的 Logistic 回归模型预测结果越大,X轴值越高,但Y轴上变化不大。与随机森林模型相比,在X轴值之后,划分没有很大变化,Y轴值在每次预测中都是常数。
决策区域的唯一缺点是它只限于二维特征,因此,它比实际模型本身更适合于预分析。
5、PDPBox
PDP(Partial Dependence Plot) 是一个显示特征对机器学习模型预测结果的边际影响的图。它用于评估特征与目标之间的相关性是线性的、单调的还是更复杂的。
让我们尝试使用如下示例数据来了解PDPBox。首先,我们需要安装PDPBox包。
pip install pdpbox
我们可以尝试获取更多关于:PDPBox如何帮助我们创建可解释的机器学习的信息。
import pandas as pd
from pdpbox import pdp, get_dataset, info_plots
#We would use the data and model from the pdpbox
test_titanic = get_dataset.titanic()
titanic_data = test_titanic['data']
titanic_features = test_titanic['features']
titanic_model = test_titanic['xgb_model']
titanic_target = test_titanic['target']
当我们有了数据和模型后,让我们尝试使用 info_plots 函数检查特征和目标之间的信息。
fig, axes, summary_df = info_plots.target_plot(df=titanic_data, feature='Sex', feature_name='gender', target=titanic_target)
_ = axes['bar_ax'].set_xticklabels(['Female', 'Male'])
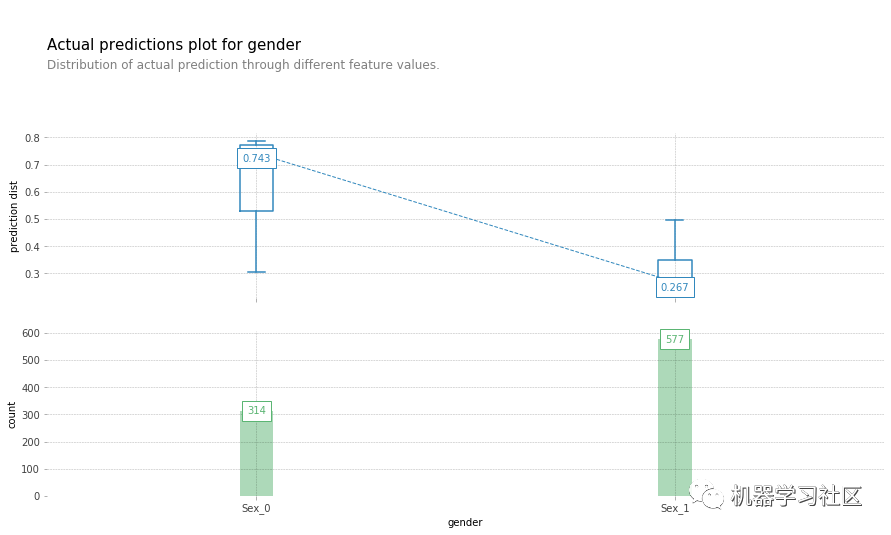
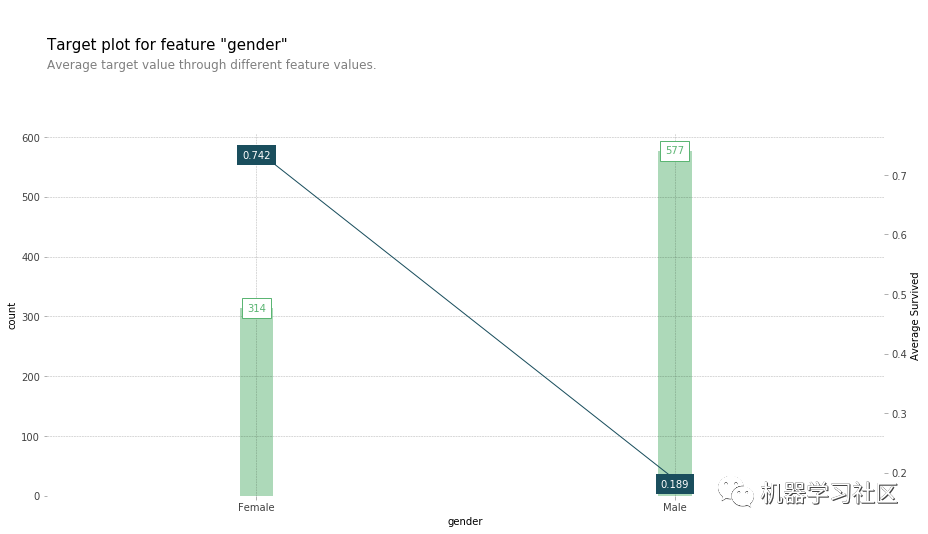 你可以通过一个函数获取目标和特征的统计信息,这可以让业务方很容易解释。让我们检查模型预测分布函数以及特征。
fig, axes, summary_df = info_plots.actual_plot(model=titanic_model, X=titanic_data[titanic_features], feature='Sex', feature_name='gender')
 现在,让我们继续使用PDP绘图函数来解释我们的模型预测。
pdp_sex = pdp.pdp_isolate(model=titanic_model, dataset=titanic_data, model_features=titanic_features, feature='Sex')
fig, axes = pdp.pdp_plot(pdp_sex, 'Sex')
_ = axes['pdp_ax'].set_xticklabels(['Female', 'Male'])
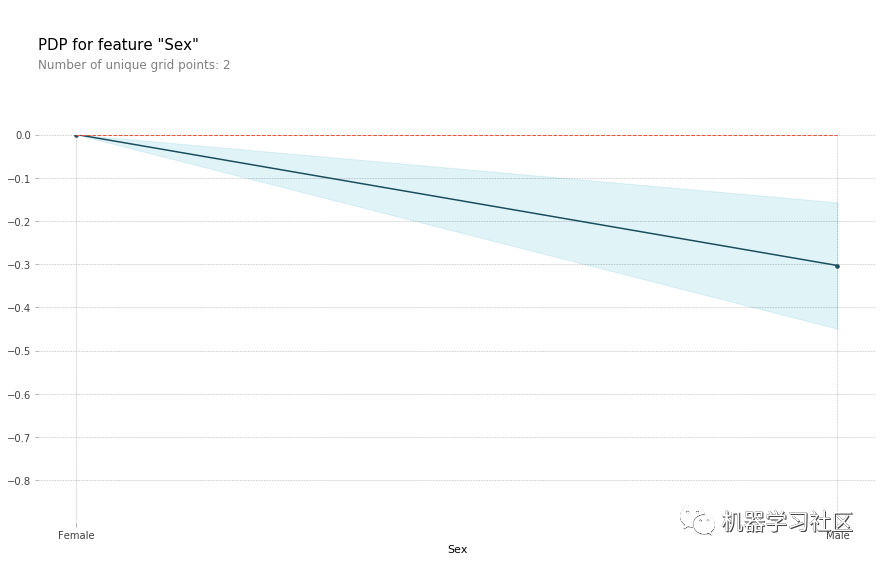 从上图中,我们可以解释当性别特征为男性时,预测概率降低(意味着男性存活的可能性降低)。这就是我们如何使用 PDPbox 来实现模型的可解释性。
6、InterpretML
InterpretML 是一个Python包,它包含许多机器学习可解释性API。此包的目的是基于绘图图提供交互式绘图,以了解预测结果。
InterpretML 提供了许多方法来解释你的机器学习,方法包括使用我们讨论过的许多技术——即SHAP和PDP。此外,这个包拥有一个Glassbox模型API,它在开发模型时提供了一个可解释性函数。
让我们用一个示例数据集来尝试这个包。首先,我们需要安装 InterpretML。
pip install interpret
让我们尝试使用泰坦尼克号数据集示例来开发模型。
from sklearn.model_selection import train_test_split
from interpret.glassbox import ExplainableBoostingClassifier
import seaborn as sns
#the glass box model (using Boosting Classifier)
ebm = ExplainableBoostingClassifier(random_state=120)
titanic = sns.load_dataset('titanic').dropna()
#Data splitting
X_train, X_test, y_train, y_test = train_test_split(titanic.drop(['survived', 'alive'], axis = 1), titanic['survived'], test_size = 0.2, random_state = 121)
#Model Training
ebm.fit(X_train, y_train)
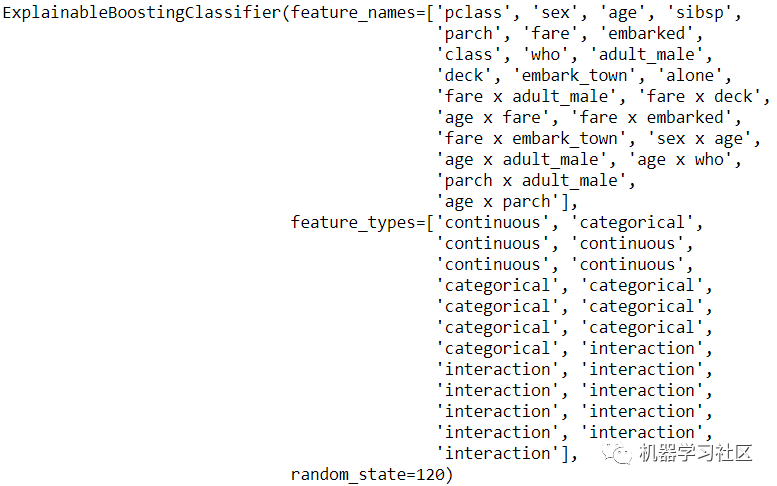
它将自动对你的特征进行热编码,并设计交互特性。让我们试着得到这个模型的全局解释。
from interpret import set_visualize_provider
from interpret.provider import InlineProvider
set_visualize_provider(InlineProvider())
from interpret import show
ebm_global = ebm.explain_global()
show(ebm_global)
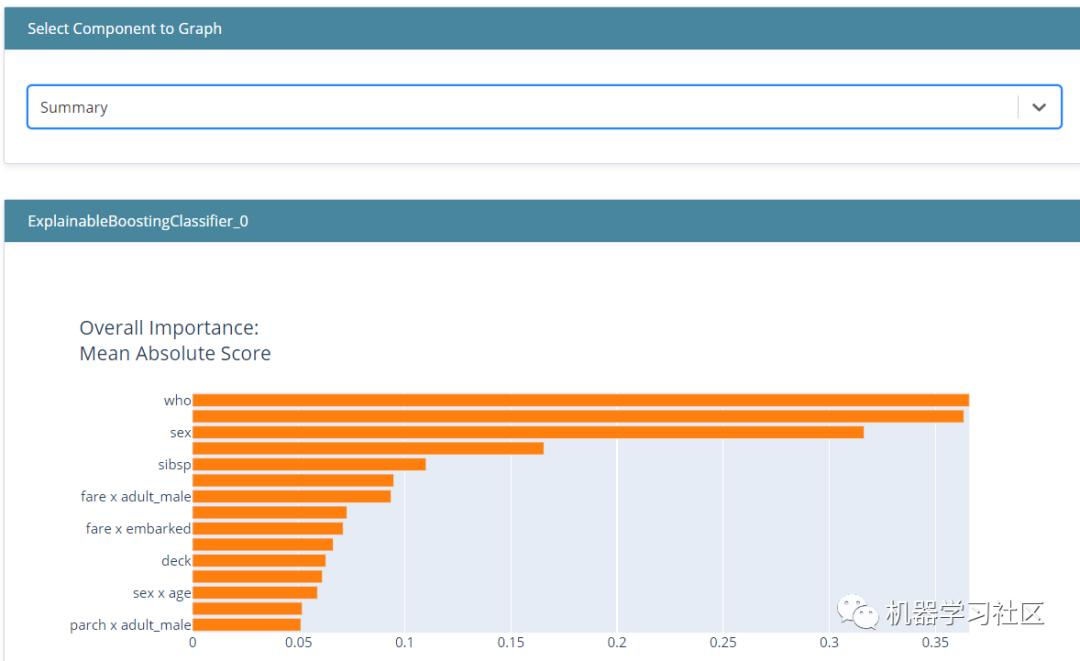 从上图中,我们可以看到模型特征重要性的总结。它根据模型特征的重要性向你显示所有被认为重要的特征。
“可解释”是一个交互式绘图,可以使用它来更具体地解释模型。如果我们只在上图中看到摘要,我们可以选择另一个组件来指定要查看的功能。这样,我们就可以解释模型中的特征是如何影响预测的。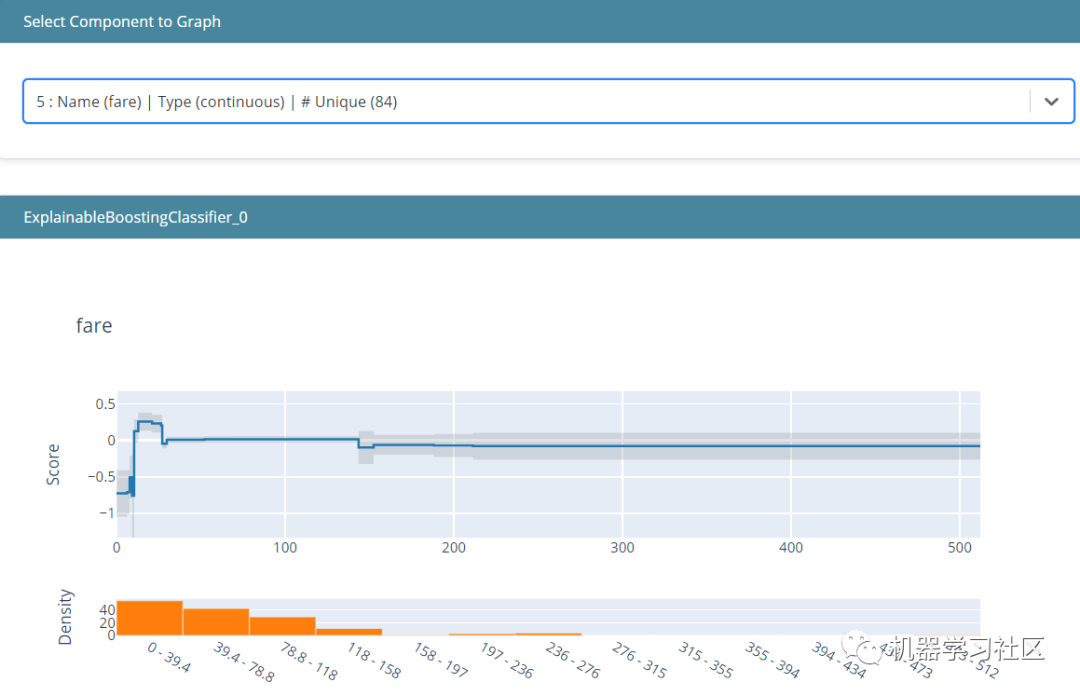
在上图中,我们可以看到低票价降低了生存的机会,但随着票价越来越高,它增加了生存的机会。然而,你可以看到密度和条形图-许多人来自较低的票价。
通常情况下,我们不仅对整体的可解释性感兴趣,而且对局部的可解释性感兴趣。在本例中,我们可以使用以下代码来解释它。
#Select only the top 5 rows from the test data
ebm_local = ebm.explain_local(X_test[:5], y_test[:5])
show(ebm_local)
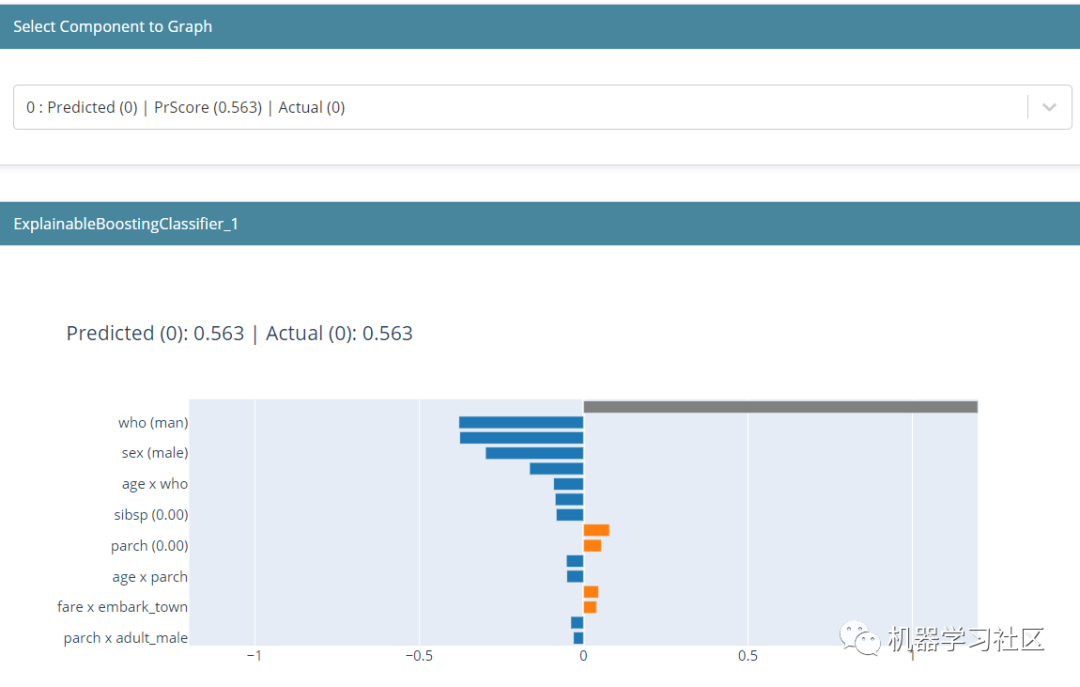 局部可解释性显示了单个预测是如何进行的。这里显示的值是来自模型的对数赔率分数,它们被添加并通过 logistic 函数传递,以得到最终预测。在这个预测中,我们可以看到男性对降低存活率的贡献最大。
总结
机器学习的可解释性对于任何数据科学家来说都是一个重要的工具,因为它可以让你更好地将模型结果传达给业务用户,内容较多,希望对大家有帮助!
END
整理不易,点赞三连↓
