时间序列基础教程总结
时间序列
0 数据集
本教程包括两个数据集(后台回复“210325”可获取):
1. 基本操作(一)
1.1 读取数据
在使用pd.read_csv读取时间序列时,可以设置两个参数。使用parse_dates参数可以把指定的列从文本类型转化为Pandas内置时间类型,使用index_col可以把指定的列转化为数据集的索引。
google = pd.read_csv('../input/stock-time-series-20050101-to-20171231/GOOGL_2006-01-01_to_2018-01-01.csv',
index_col='Date', parse_dates=['Date'])
google.head()
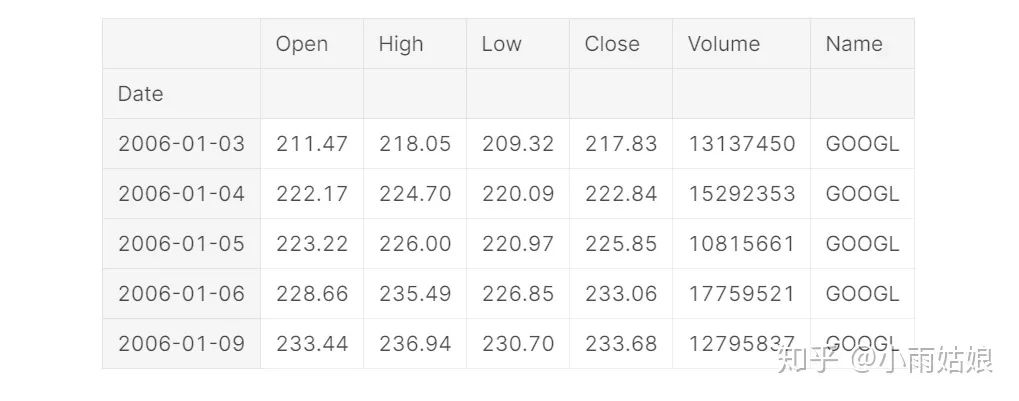
另一个数据集也可以以同样的方法读入
1.2 数据预处理
股票数据并不存在缺失值,但是天气湿度数据却存在缺失值。使用参数为ffill的fillna()函数,用后一时刻的观测值进行填补。
humidity = humidity.iloc[1:]
humidity = humidity.fillna(method='ffill')
humidity.head()
1.3 数据可视化
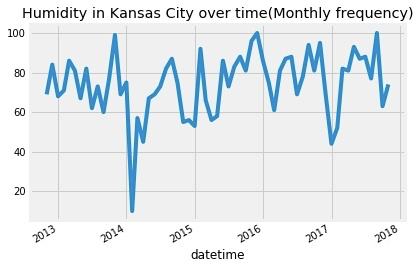
使用pandas Series对象的asfreq[2]函数对时间序列数据以指定频率作图。其中M代表以月为基本单位。默认是使用时间窗的结尾作为结果,例如2019年12月这个月的结果实际是12月31号的数据。
humidity["Kansas City"].asfreq('M').plot()
plt.title('Humidity in Kansas City over time(Monthly frequency)')
plt.show()
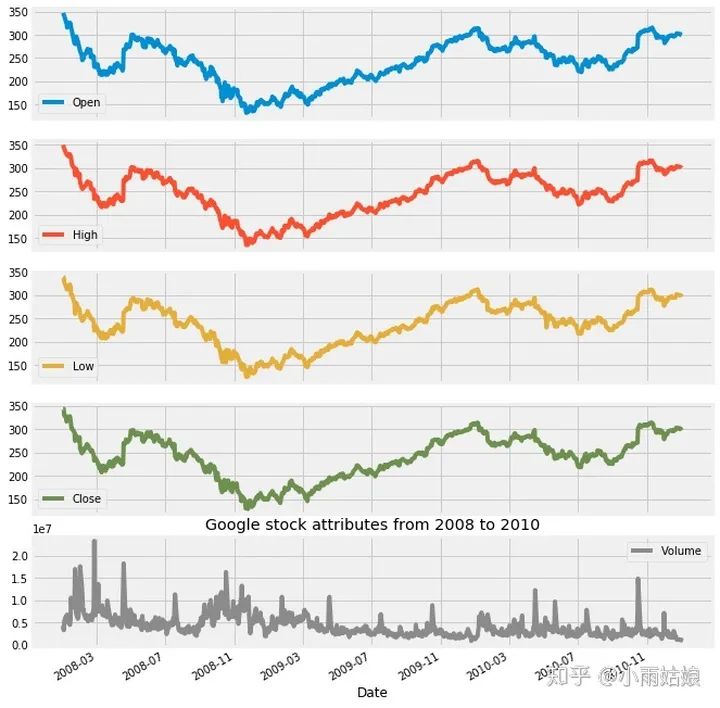
google['2008':'2010'].plot(subplots=True, figsize=(10,12))
plt.title('Google stock attributes from 2008 to 2010')
plt.savefig('stocks.png')
plt.show()
1.4 时间戳与时间窗
时间戳(Timestamps)用来表示某个时间点,时间窗(Periods)用来表示某个时间区间。时间窗常常用来检测在某个时间段内是否发生了特殊事件。时间戳与时间窗之间也可以相互进行转换。
创建时间戳:
timestamp = pd.Timestamp(2017, 1, 1, 12)
timestamp

创建时间窗:
period = pd.Period('2017-01-01')
period

检测时间戳是否在特定时间窗内
period.start_time < timestamp < period.end_time
将时间戳转换为时间窗
new_period = timestamp.to_period(freq='H')
将时间窗转换为时间戳
new_timestamp = period.to_timestamp(freq='H', how='start')
1.5 使用date_range方法
date_range 是一个可以返回多个datetime对象组成的序列的方法。它经常被用于创建连续的时间序列(用法非常简单,不要再用for循环创建时间序列了!!)
dr1 = pd.date_range(start='1/1/18', end='1/9/18')

也可以指定频率
dr2 = pd.date_range(start='1/1/18', end='1/1/19', freq='M')

1.6 Datetime对象
pandas.to_datetime() [3]用来将参数转化为datetime对象。具体使用方法可以看官方文档
df = pd.DataFrame({'year': [2015, 2016], 'month': [2, 3], 'day': [4, 5]})

df = pd.to_datetime(df)

df = pd.to_datetime('01-01-2017')

1.7 平移
除此之外我们还可以把时间序列进行平移。这个方法经常用于比较时间序列与之前是否相关,判断是否具有延后性。
humidity["Vancouver"].asfreq('M').plot(legend=True)
shifted = humidity["Vancouver"].asfreq('M').shift(10).plot(legend=True)
shifted.legend(['Vancouver','Vancouver_lagged'])
plt.show()

红色的线是蓝色的线往右平移的结果
1.8 重采样
上采样—把时间序列从低频转化为高频,其中包含了缺失值的填补与插值操作。
下采样—把时间序列从高频转化为低频,其中包含了对于数据的聚合操作。
下面代码使用resample函数,以三天为频率对数据进行下采样,然后采用均值方法对数据进行聚合。
pressure = pressure.resample('3D').mean()
pressure.head()
2. 基本操作(二)
2.1 相对差异
通过Series对象的shift方法可以将数据平移一个单位,如下图:
shift前:
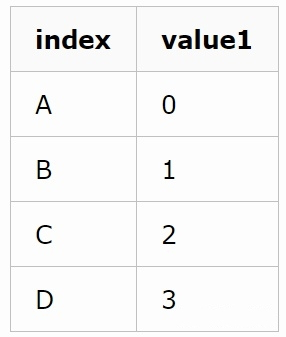
shift后:
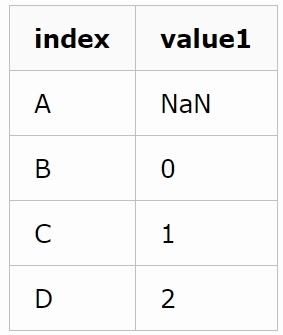
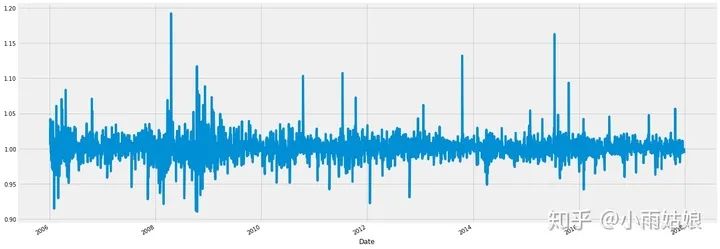
通过div方法可以实现列与列的逐属性相除,这样就可以得到后一天和前一天的比率,用来观测数据每天的变化情况
google['Change'] = google.High.div(google.High.shift())
google['Change'].plot(figsize=(20,8))
2.2 绝对值差异
除了观测改变的比率,还可以观测改变的值
google.High.diff().plot(figsize=(20,6))

2.3 比较多个时间序列
首先读取另一个时间序列Microsoft的股票
microsoft = pd.read_csv('../input/stock-time-series-20050101-to-20171231/MSFT_2006-01-01_to_2018-01-01.csv', index_col='Date', parse_dates=['Date'])
作图
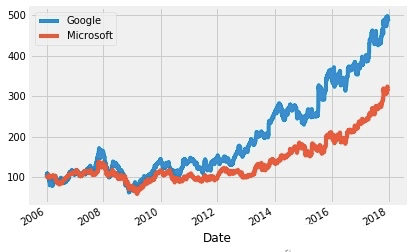
google.High.plot()
microsoft.High.plot()
plt.legend(['Google','Microsoft'])
plt.show()

但是由于谷歌和微软单个股票的价格差异过大,很难比较,所以使用时间序列的第一个值进行标准化(思考一下,使用第一个值进行标准化其实并不是特别鲁棒)
normalized_google = google.High.div(google.High.iloc[0]).mul(100)
normalized_microsoft = microsoft.High.div(microsoft.High.iloc[0]).mul(100)
normalized_google.plot()
normalized_microsoft.plot()
plt.legend(['Google','Microsoft'])
plt.show()
这样就可以显然看出买谷歌比买微软挣得多
2.4 数据平滑
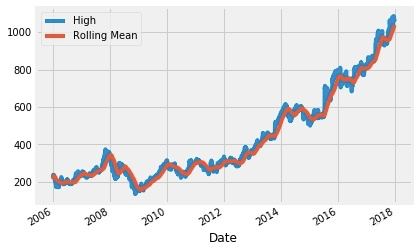
数据平滑可以用来检测时间序列在一定时期的趋势,分为rolling与expanding两个方法。其中rolling考虑几个时间窗内的数据,expanding考虑之前所有数据。
下面代码是以90天为单位的时间窗对数据进行平滑的效果,可以发现平滑后的数据更加稳健。
rolling_google = google.High.rolling('90D').mean()
google.High.plot()
rolling_google.plot()
plt.legend(['High','Rolling Mean'])
plt.show()
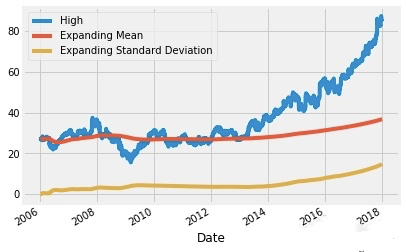
下面的expanding方法的结果
microsoft_mean = microsoft.High.expanding().mean()
microsoft_std = microsoft.High.expanding().std()
microsoft.High.plot()
microsoft_mean.plot()
microsoft_std.plot()
plt.legend(['High','Expanding Mean','Expanding Standard Deviation'])
plt.show()
2.5 OHLC图
OHLC图是专门针对时间序列的一种图,其中四个字母的含义如下:open, high, low and close price。这好像就是我妈看股票的时候的那个图。
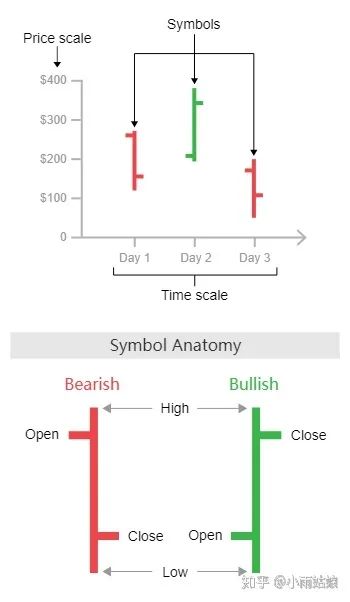
使用这个库就可以画出来 import plotly.graph_objs as go
trace = go.Ohlc(x=google['06-2008'].index,
                open=google['06-2008'].Open,
                high=google['06-2008'].High,
                low=google['06-2008'].Low,
                close=google['06-2008'].Close)
data = [trace]
iplot(data, filename='simple_ohlc')
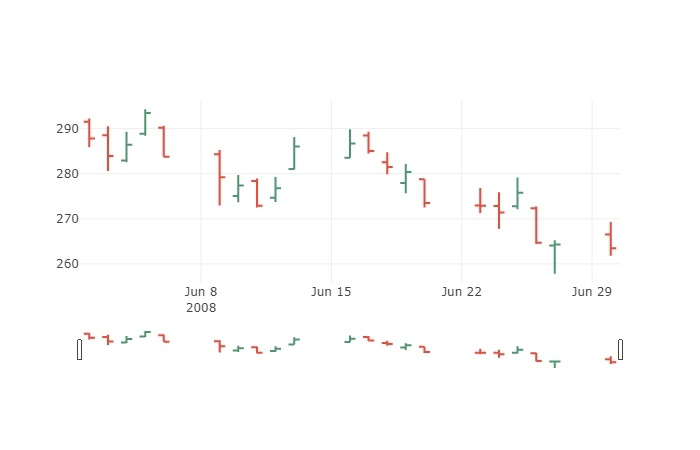
这个图主要可以看出来当天是跌了还是涨了,然后变了多少。
2.6 K线图
好像也是股票中常见的一种图,不是特别重要,能看懂就可以。
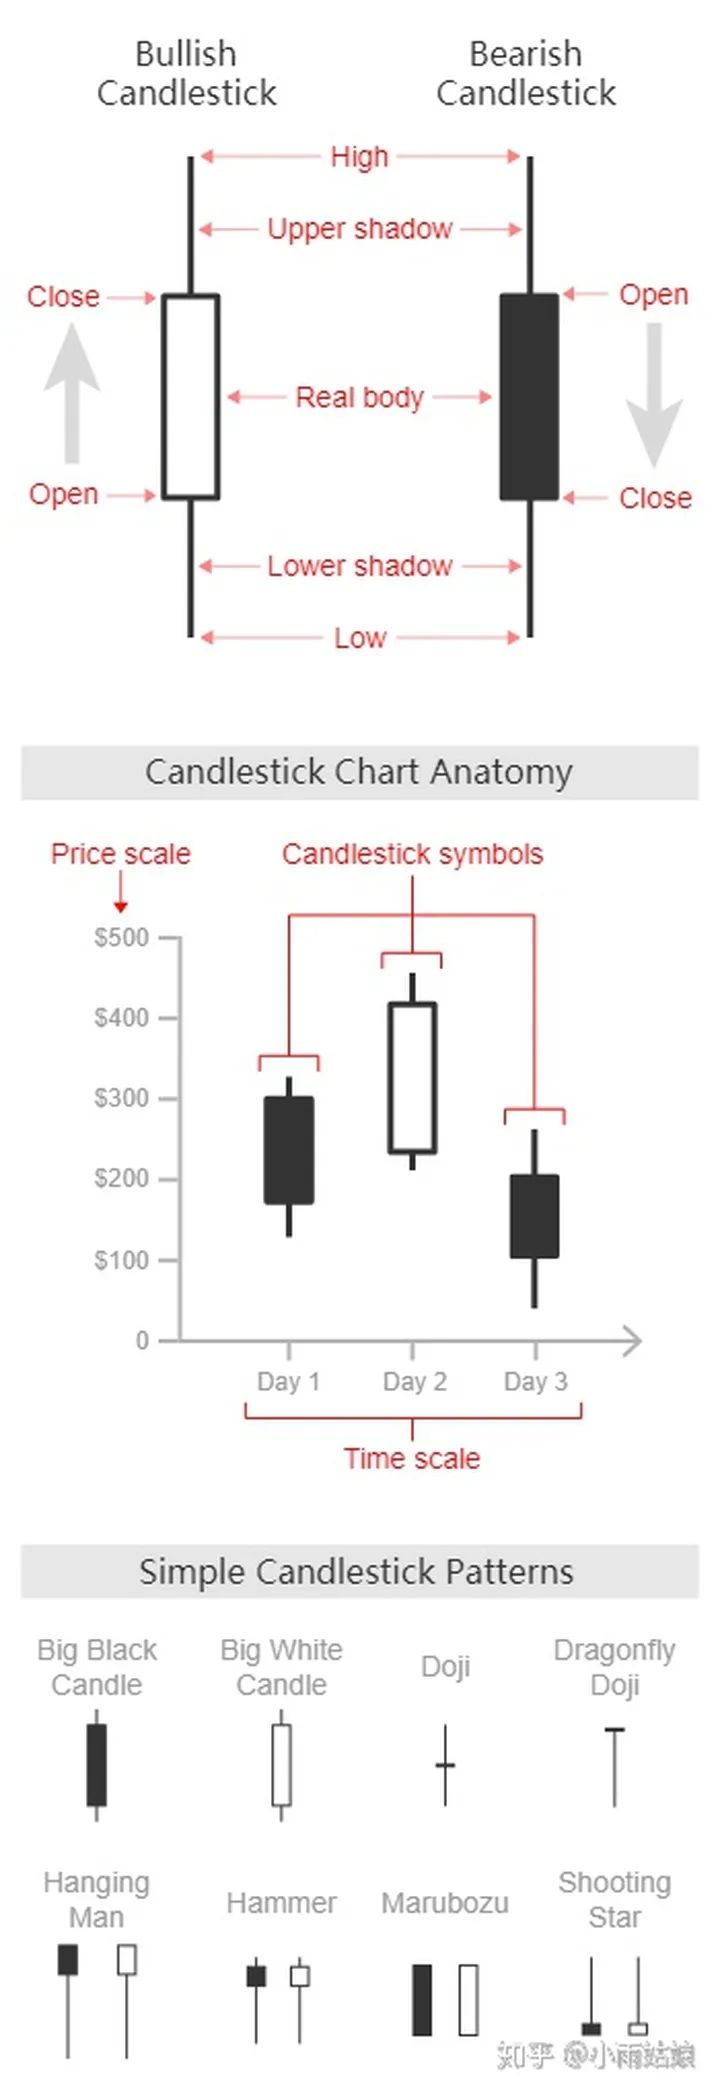
trace = go.Candlestick(x=google['03-2008'].index,
                open=google['03-2008'].Open,
                high=google['03-2008'].High,
                low=google['03-2008'].Low,
                close=google['03-2008'].Close)
data = [trace]
iplot(data, filename='simple_candlestick')
2.7 自相关性与偏自相关性
自相关性
表示当前时间与它之前不同时间点之间的相关性
偏自相关性
表示当前时间与它之前不同时间点之间,去除了中间时间干扰的相关性。自相关性就是时间与时间的相关性,偏自相关性是剔除了。
对他们的影响之后再计算的相关性。至于怎么计算的可以参考博客:
https://blog.csdn.net/weixin_42382211/article/details/81136787
自相关:
plot_acf(humidity["San Diego"],lags=25,title="San Diego")
plt.show()
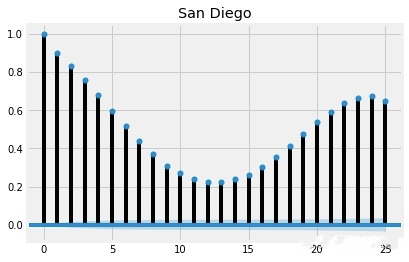
这样看基本所有滞后的时间长度都存在相关性,在滞后12、13天的时候相关性最低,但是都超过了置信区间(图中蓝色的区域)
偏自相关:
plot_pacf(humidity["San Diego"],lags=25)
plt.show()
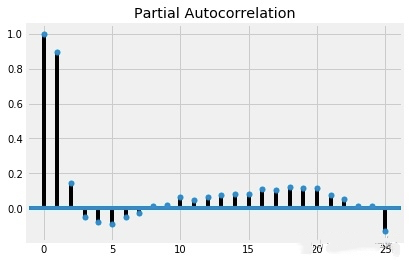
看起来所有时间跨度都具有显著性,但是除了前两个,偏自相关性都很弱。
往期精彩:
点个在看
