哈佛大学单细胞课程|笔记汇总 (六)
生物信息学习的正确姿势
NGS系列文章包括NGS基础、在线绘图、转录组分析 (Nature重磅综述|关于RNA-seq你想知道的全在这)、ChIP-seq分析 (ChIP-seq基本分析流程)、单细胞测序分析 (重磅综述:三万字长文读懂单细胞RNA测序分析的最佳实践教程)、DNA甲基化分析、重测序分析、GEO数据挖掘(典型医学设计实验GEO数据分析 (step-by-step))、批次效应处理等内容。
(六)Single-cell RNA-seq clustering analysis: aligning cells across conditions
我们的数据集包含来自两个不同条件(对照和刺激)的两个样本,因此将这些样本整合在一起以更好地进行比较。
聚类工作流程
聚类分析的目的是在待定义细胞类型的数据集中保留主要的变异来源,同时尽量屏蔽由于无用的变异来源(测序深度,细胞周期差异,线粒体表达,批次效应等)而产生的变异。
在我们的工作流程中需要应用到以下两个资源:
Satija Lab: Seurat v3 Guided Integration Tutorial(https://satijalab.org/seurat/v3.0/immune_alignment.html)Paul Hoffman: Cell-Cycle Scoring and Regression(http://satijalab.org/seurat/cell_cycle_vignette.html)
为了识别细胞亚群,我们将进行以下步骤:
(1)Normalization, variance stabilization, and regression of unwanted variation (e.g. mitochondrial transcript abundance, cell cycle phase, etc.) for each sample
(2)Integrationof the samples using shared highly variable genes (optional, but recommended to align cells from different samples/conditions if cell types are separating by sample/condition)
(3)Clustering cells based on top PCs (metagenes)
(4)Exploration of quality control metrics: determine whether clusters are unbalanced wrt UMIs, genes, cell cycle, mitochondrial content, samples, etc.
(5)Searching for expected cell types using known cell type-specific gene markers
以下流程为前两步。
加载R包
# Single-cell RNA-seq analysis - clustering analysis

# Load libraries
library(Seurat)
library(tidyverse)
library(RCurl)
library(cowplot)
Normalization, variance stabilization, and regression of unwanted variation for each sample
分析的第一步是将count矩阵标准化,以解决每个样品每个细胞的测序深度差异。Seurat最近推出了一种叫sctransform的新方法,用于对scRNA-seq数据进行归一化和方差稳定变化。
sctransform方法使用正则化负二项式模型对UMI counts进行建模,以消除由于测序深度(每个细胞的总nUMI)所引起的变异,同时基于具有相似丰度的基因之间的合并信息来调整方差。

Image credit: Hafemeister C and Satija R. Normalization and variance stabilization of single-cell RNA-seq data using regularized negative binomial regression, bioRxiv 2019 (https://doi.org/10.1101/576827)
模型结果残差(residuals)是每个转录本标准化后的表达水平。
sctransform能通过回归分析校对测序深度(nUMI)。但对于某些数据集,细胞周期可能是基因表达变化的显著来源,对于其他数据集则不一定,我们需要检查细胞周期是否是数据变化的主要来源并在需要时校对细胞周期的影响。
Cell cycle scoring
建议在执行sctransform方法之前检查细胞周期阶段。检查之前先对数据做个标准化使得不同测序深度的细胞可比。
# Normalize the counts
seurat_phase <- NormalizeData(filtered_seurat)
作者提供了人体细胞周期相关基因可以下载 (https://www.dropbox.com/s/hus4mrkueh1tfpr/cycle.rda?dl=1)和其他生物的细胞周期相关基因(https://github.com/hbctraining/scRNA-seq/blob/master/lessons/cell_cycle_scoring.md)。
把细胞周期相关基因读入data目录
# Load cell cycle markers
load("data/cycle.rda")

# Score cells for cell cycle
seurat_phase <- CellCycleScoring(seurat_phase,
                                 g2m.features = g2m_genes,
                                 s.features = s_genes)

# View cell cycle scores and phases assigned to cells
View(seurat_phase@meta.data)在对细胞进行细胞周期评分后,我们想使用PCA确定细胞周期是否是我们数据集中变异的主要来源。在此之前,我们首先需要对数据进行标准化(scale),并使用Seurat ScaleData()函数。
调整每个基因的表达以使整个细胞的平均表达为0
缩放每个基因的表达以使细胞之间的表达值转换标准差的倍数
# Identify the most variable genes
seurat_phase <- FindVariableFeatures(seurat_phase,
                     selection.method = "vst",
                     nfeatures = 2000,
                     verbose = FALSE)

# Scale the counts
seurat_phase <- ScaleData(seurat_phase)NOTE: For the
selection.methodandnfeaturesarguments the values specified are the default settings. Therefore, you do not necessarily need to include these in your code. We have included it here for transparency and inform you what you are using.
# Perform PCA
seurat_phase <- RunPCA(seurat_phase)

# Plot the PCA colored by cell cycle phase
DimPlot(seurat_phase,
        reduction = "pca",
        group.by= "Phase",
        split.by = "Phase")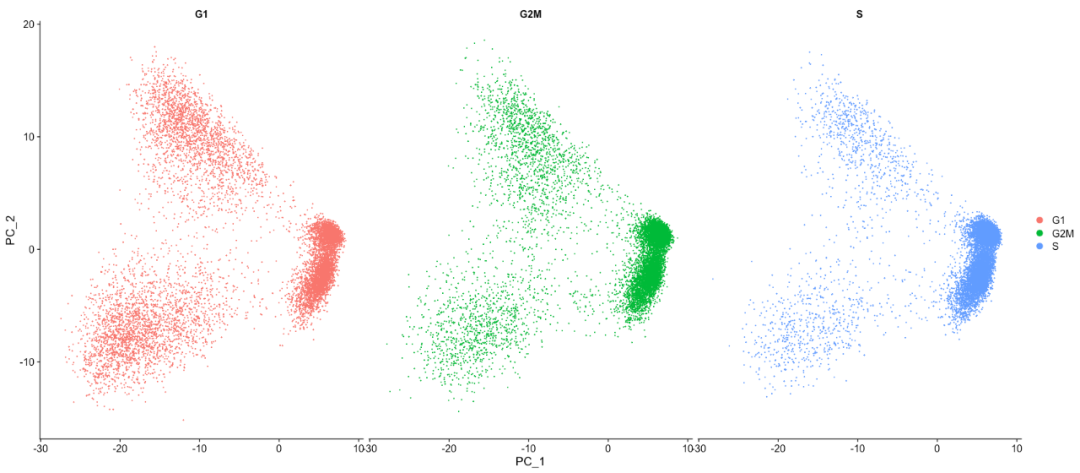
我们没有看到在细胞周期方面具有很大的差异,也基于此图,我们不会考虑细胞周期引起的变化。
SCTransform
我们此时可以放心的进行SCTransform,我们打算使用for循环对每个样本进行 NormalizeData(), CellCycleScoring()和SCTransform() ,并使用 vars.to.regress 去除线粒体相关基因。
# Split seurat object by condition to perform cell cycle scoring and SCT on all samples
split_seurat <- SplitObject(filtered_seurat, split.by = "sample")

split_seurat <- split_seurat[c("ctrl", "stim")]

for (i in 1:length(split_seurat)) {
    split_seurat[[i]] <- NormalizeData(split_seurat[[i]], verbose = TRUE)
    split_seurat[[i]] <- CellCycleScoring(split_seurat[[i]], g2m.features=g2m_genes, s.features=s_genes)
    split_seurat[[i]] <- SCTransform(split_seurat[[i]], vars.to.regress = c("mitoRatio"))
}NOTE: By default, after normalizing, adjusting the variance, and regressing out uninteresting sources of variation, SCTransform will rank the genes by residual variance and output the 3000 most variant genes. If the dataset has larger cell numbers, then it may be beneficial to adjust this parameter higher using the
variable.features.nargument.
除了原始RNA计数外,assays slot中现在还有一个SCT组件。细胞之间表达变化最大的特征基因存储于SCT assay中。
通常,在决定是否需要进行数据整合之前,我们总是先查看细胞在空间的分布。如果我们在Seurat对象中同时对两个条件进行了归一化并可视化,我们将看到特定于不同条件的聚类:
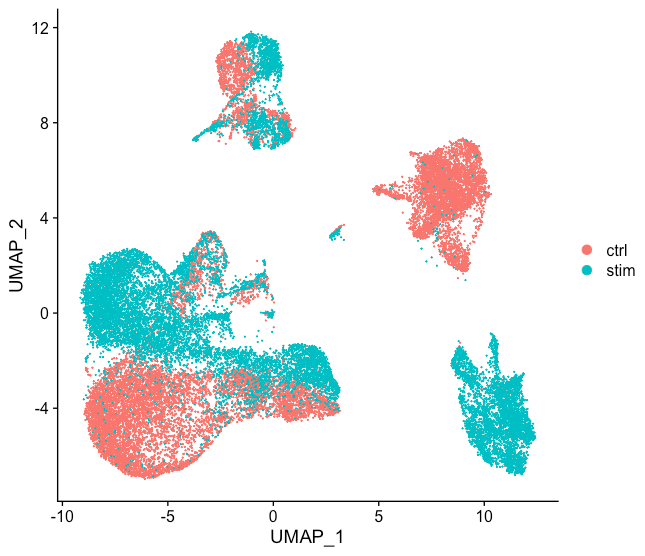
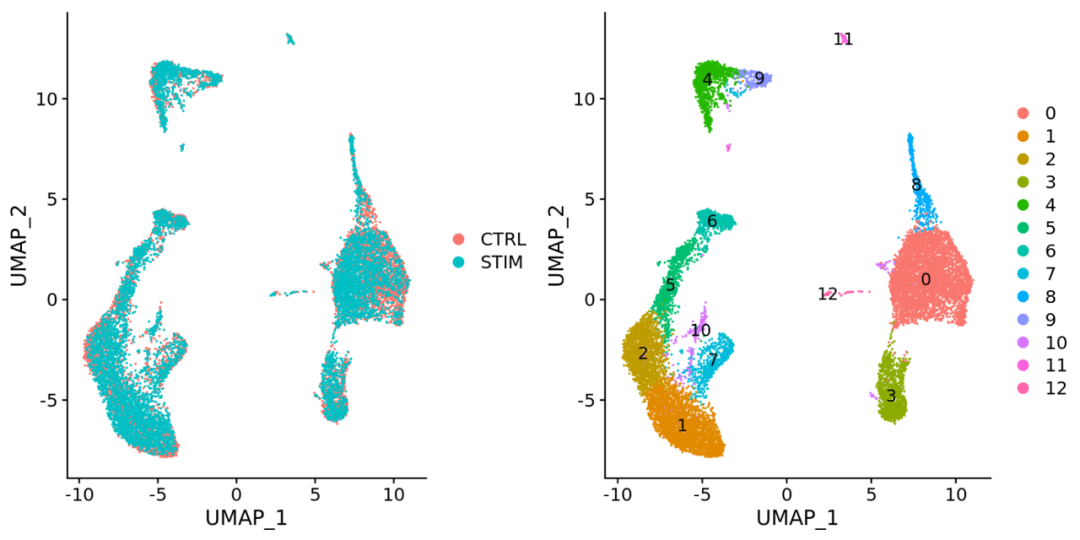
不同条件下细胞的聚类表明我们需要跨条件整合细胞。
NOTE: Seurat has a vignette for how to run through the workflow without integration(https://satijalab.org/seurat/v3.1/sctransform_vignette.html). The workflow is fairly similar to this workflow, but the samples would not necessarily be split in the beginning and integration would not be performed.
Integrate samples using shared highly variable genes
为了进行整合(“harmony”整合不同平台的单细胞数据之旅),我们将使用不同条件的细胞共有的高可变基因,然后,我们将“整合”或“协调”条件,以鉴定组之间相似或具有“共同的生物学特征”的细胞。
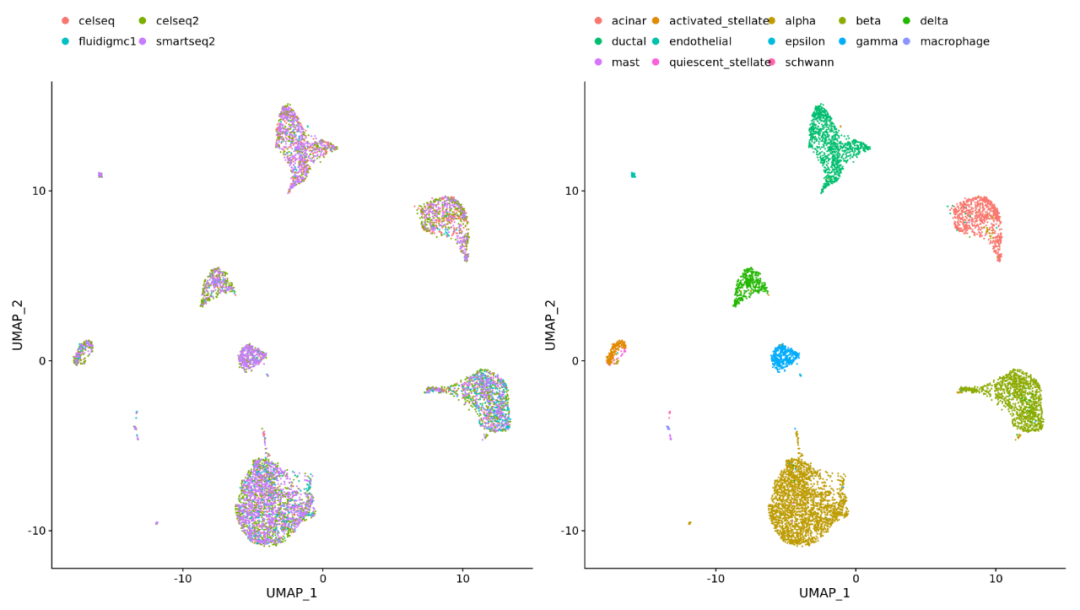
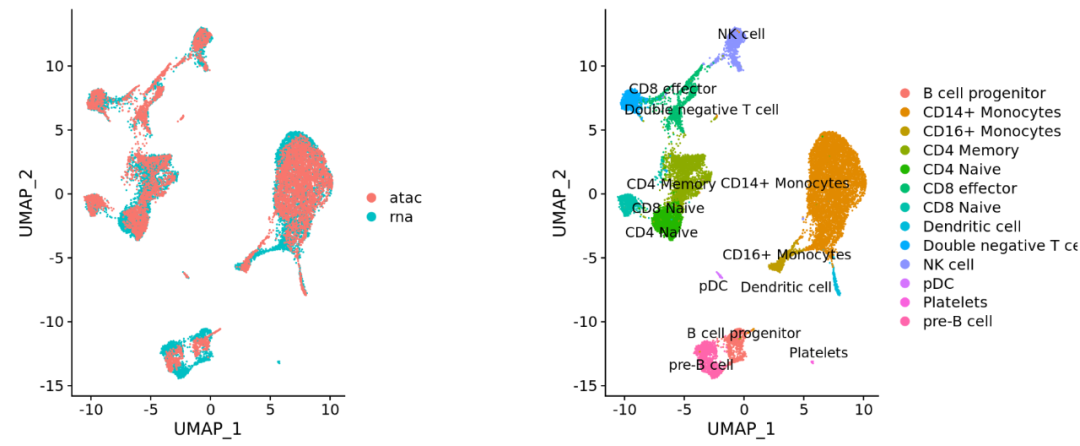
如果不确定要期望的簇或期望条件之间的某些不同细胞类型(例如肿瘤和对照样品),可以先单独处理某个条件,然后一起运行以查看两种条件下是否存在针对特定细胞类型的特定簇。通常在不同条件下进行聚类分析时会出现基于条件的聚类,而数据整合可以帮助相同类型的细胞进行聚类。为了整合,我们首先需要先通过SCTransform筛选高变基因,然行“整合”或者“协调”("integrate" or "harmonize")条件,以便在不同条件下同种细胞具有相似的表达。这些条件包括:
(1)不同条件(control VS stimuli)
(2)不同数据集
(3)不同类型 (e.g. scRNA-seq and scATAC-seq)
整合最重要的目的就是使得不同条件和数据集之间细胞类型相同的数据表达谱一致。这也意味着部分细胞亚群的生物学状态是相同的,下图为整合步骤:
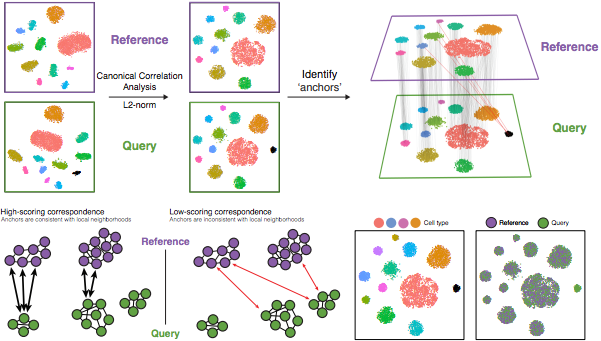
Image credit: Stuart T and Butler A, et al. Comprehensive integration of single cell data, bioRxiv 2018 (https://doi.org/10.1101/460147)
具体细节是:
先执行典型相关性分析(
canonical correlation analysis (CCA)):CCA是PCA的一种形式,能识别数据中最大的差异,不过前提是组/条件之间共有这个最大变异(使用每个样本中变化最大的3000个基因)。
NOTE: The shared highly variable genes are used because they are the most likely to represent those genes distinguishing the different cell types present.
在数据集中识别锚点(
anchors)或相互最近的邻居(mutual nearest neighbors ,MNN):MMN可以被认为是“最佳搭档”('best buddies')。对于每种条件的细胞来说:“The difference in expression values between cells in an MNN pair provides an estimate of the batch effect, which is made more precise by averaging across many such pairs. A correction vector is obtained and applied to the expression values to perform batch correction.” ——Stuart and Bulter et al. (2018)(https://www.biorxiv.org/content/early/2018/11/02/460147).
根据基因表达值确定细胞在其他情况下最接近的邻居-它是
'best buddies'。进行二次分析,如果两个细胞在两个方向上都是
'best buddies',则这些细胞将被标记为将两个数据集“锚定”在一起的锚点。筛选锚点:通过其本地邻域中的重叠来评估锚点对之间的相似性(不正确的锚点得分会较低)——相邻细胞是否具有彼此相邻的
'best buddies'?整合数据/条件:使用锚点和相应分数来转换细胞表达值,从而可以整合条件/数据集(不同的样本、条件、数据集、模态)
NOTE: Transformation of each cell uses a weighted average of the two cells of each anchor across anchors of the datasets. Weights determined by cell similarity score (distance between cell and k nearest anchors) and anchor scores, so cells in the same neighborhood should have similar correction values.
现在,使用我们的SCTransform对象作为输入,进行数据整合:
首先,我们需要指定使用由SCTransform识别的3000个高变基因进行整合。默认情况下,仅选择前2000个基因。
# Select the most variable features to use for integration
integ_features <- SelectIntegrationFeatures(object.list = split_seurat,
nfeatures = 3000)然后,我们需要准备SCTransform对象以进行整合。
# Prepare the SCT list object for integration
split_seurat <- PrepSCTIntegration(object.list = split_seurat,
anchor.features = integ_features)现在,我们将执行canonical correlation analysis(CCA),找到最佳锚点并过滤不正确的锚点(Cell 深度 一套普遍适用于各类单细胞测序数据集的锚定整合方案)。
# Find best buddies - can take a while to run
integ_anchors <- FindIntegrationAnchors(object.list = split_seurat,
                                        normalization.method = "SCT",
                                        anchor.features = integ_features)
最后,整合不同条件并保存。
# Integrate across conditions
seurat_integrated <- IntegrateData(anchorset = integ_anchors,
                                   normalization.method = "SCT")

# Save integrated seurat object
saveRDS(seurat_integrated, "results/integrated_seurat.rds")
UMAP visualization
我们利用降维技术可视化整合后的数据,例如PCA和Uniform Manifold Approximation and Projection(UMAP)。
尽管PCA将能获得所有PC,但绘图时一般只使用两个或3个。相比之下,UMAP则进一步整合多个PCs获取更多信息,并在二维中进行展示。这样,细胞之间的距离代表表达上的相似性。
为了生成这些可视化,我们需要先运行PCA和UMAP方法。先从PCA开始:
# Run PCA
seurat_integrated <- RunPCA(object = seurat_integrated)

# Plot PCA
PCAPlot(seurat_integrated,
        split.by = "sample")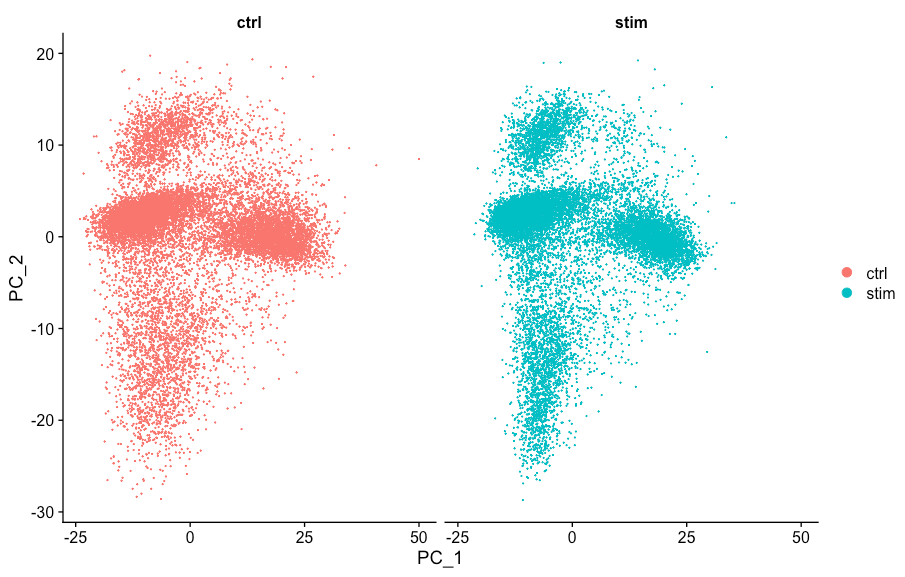
我们看到在PCA映射中具有很好的重合。然后进行UMAP:
# Run UMAP
seurat_integrated <- RunUMAP(seurat_integrated,
                             dims = 1:40,
                 reduction = "pca")

# Plot UMAP
DimPlot(seurat_integrated)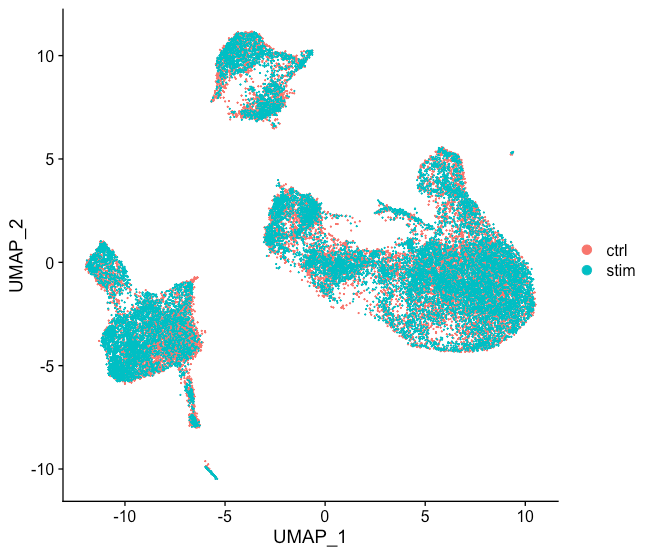
整合数据后

整合数据前
从图中我们可以看到很好的整合,比起未经过CCA的数据要好太多了。
往期精品(点击图片直达文字对应教程)
后台回复“生信宝典福利第一波”或点击阅读原文获取教程合集


