
有没有什么可以节省大量时间的 Deep Learning 效率神器?
点击上方“视学算法”,选择加"星标"或“置顶”
重磅干货,第一时间送达
导读
隆重安利Wandb+Hydra+Plotly 组合大法。这三个哥能让你的调参侠生涯如沐春风。
1. 每个实验保存完整config + wandb远程追踪
还在给model取巨长的文件名来记录其超参吗?out了。wandb可以把config和结果曲线同步云端供横向评比和查看。同步云端的代码:
def wandb_init(cfg: DictConfig):
    wandb.init(
        project='best paper',
        group=cfg.exp_group,
        name=cfg.exp_name,
        notes=cfg.exp_desc,
        save_code=True,
        config=OmegaConf.to_container(cfg, resolve=True)
    )
    OmegaConf.save(config=cfg, f=os.path.join(cfg.ckpt_dir, 'conf.yaml'))
这里的OmegaConf下面会讲到。想不起来某个实验的model存在哪了?看wandb的界面查找每个config值
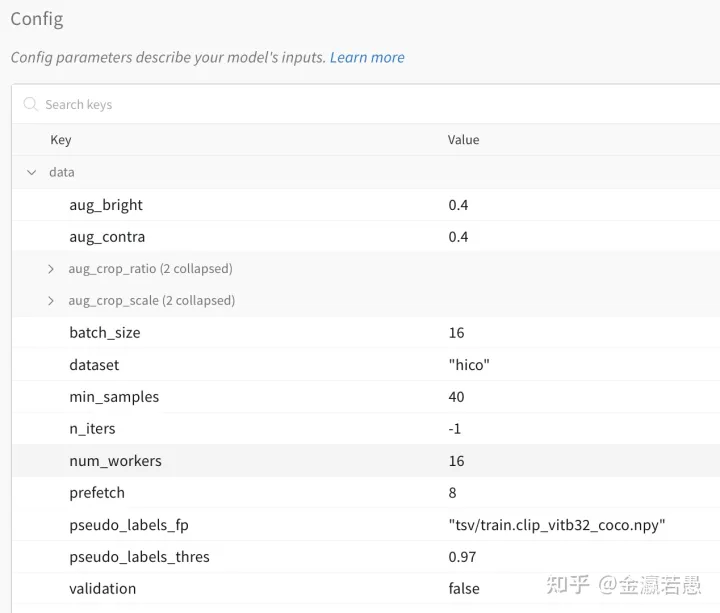
wandb 查看config
对应每个实验的curves
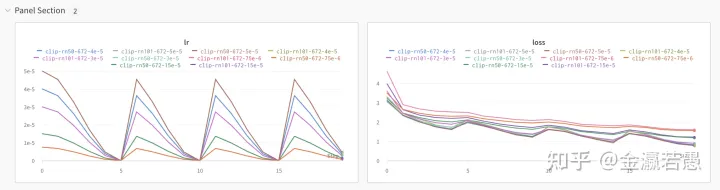
wandb查看曲线
2. Hydra+OmegaConf配置管理
OmegaConf是Meta出的配置管理工具,可将yaml文件转成有对应变量名的Python的class或dict。支持默认值、合并和override、导出成yaml或json等,十分好用。你再也不用手写配置管理了。
比如:
blob_root: /yjblob
exp_name: best_paper_2
ckpt_dir: ${.blob_root}/${.exp_name}/ckpt
log_dir: ${.blob_root}/${.exp_name}/log
上面是config.yaml的片段,OmegaConf.resolve(cfg) 一句即可把blob_root和exp_name 的值填进 ckpt_dir里。而普通的yaml是不支持变量的。
Hydra是Meta出的实验提交工具,支持在命令行里动态修改OmegaConf里面的数值。Hydra支持一个config里引用另一个config,于是你可以很容易的切换用db=mysql还是db=postgresql:
├── conf
│   ├── config.yaml
│   ├── db
│   │   ├── mysql.yaml
│   │   └── postgresql.yaml
│   └── __init__.py
└── my_app.py
而且,这个OmegaConf的配置(DictConfig类型)可以转成Python的dict然后传给wandb,打通全场(见第一节的示例代码)。
3. Plotly导出可交互的曲线
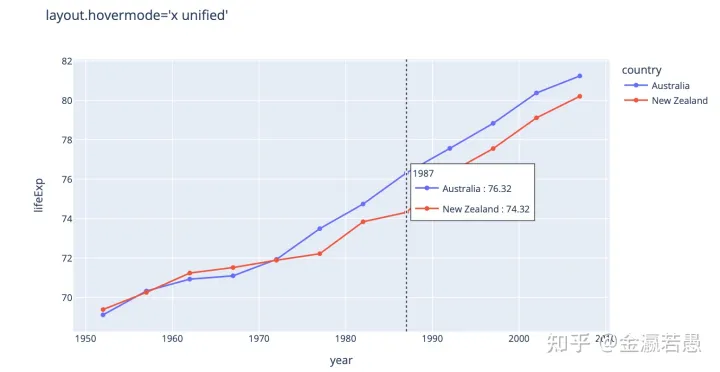
Matplotlib不支持交互,生成的曲线无法还原每个点的值。Tensorboard和wandb的网页 支持交互,但不容易导出,而且其内置的precision-recall曲线等函数无法深度定制,只适合于画一些loss和lr曲线。Plotly就很强了。

鼠标浮动,查看内容
当然也可以做定制化的precision-recall曲线。比如我希望看不同threshold下的precision, recall和false positive ratio,这样的定制化曲线wandb等并不支持,就可以用plotly
df = DataFrame({
    'thres': thresholds,
    'prec': prec_data1,
    'recl': recl_data1,
    'fp': fp_data2
})
df = df.melt(id_vars=['thres'], value_vars=['prec', 'recl', 'fp'], var_name='curves')
fig = px.line(df, x='thres', y='value', color='curves', markers=True)
fig.update_xaxes(range=[0, 1])
fig.update_yaxes(range=[0, 1])
fig.update_traces(mode="markers+lines", hovertemplate=None)
fig.update_layout(hovermode="x")
fig.write_html(os.path.join(self.cfg.ckpt_dir, 'curves.html'), auto_play = False)
里面的hovermode指定移动鼠标时显示相同x值的不同y值:
这还没完,wandb支持把plotly生成的可交互网页嵌入到wandb里
import wandb
import plotly.express as px

# Initialize a new run
run = wandb.init(project="log-plotly-fig-tables", name="plotly_html")

# Create a table
table = wandb.Table(columns = ["plotly_figure"])

# Create path for Plotly figure
path_to_plotly_html = "./plotly_figure.html"

# Example Plotly figure
fig = px.scatter(x = [0, 1, 2, 3, 4], y = [0, 1, 4, 9, 16])

# Write Plotly figure to HTML
fig.write_html(path_to_plotly_html, auto_play = False) # Setting auto_play to False prevents animated Plotly charts from playing in the table automatically

# Add Plotly figure as HTML file into Table
table.add_data(wandb.Html(path_to_plotly_html))

# Log Table
run.log({"test_table": table})
wandb.finish()
以上便完成了Hydra+OmegaConf+wandb+plotly的打通。
4. 使用远程GPU服务器/集群的一些技巧
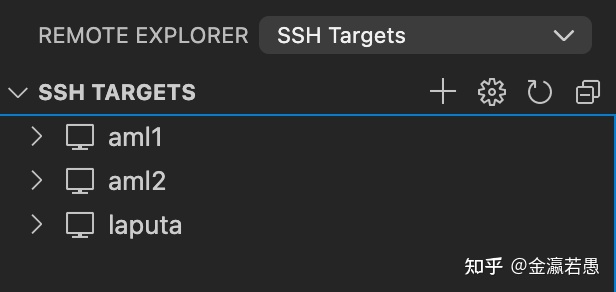
如果要使用远程的服务器,常见问题在于远程debug、代码从本地同步到远程以及ssh断线重连问题。这些可以使用VS Code解决。
可以设置用得到的所有远程服务器,每个服务器配置好ssh,便于随时登录。下图的REMOTE EXPLORER里除了SSH Targets还有Containers,即可以直接ssh到服务器的docker container里。container的运行命令可以设置vs code自动完成。
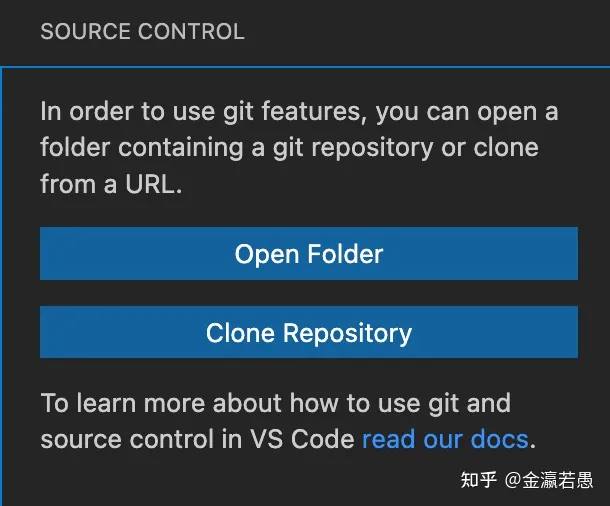
每个服务器都能从本地登录的git账户里clone代码。Clone之后下次可以直接远程打开这个repo
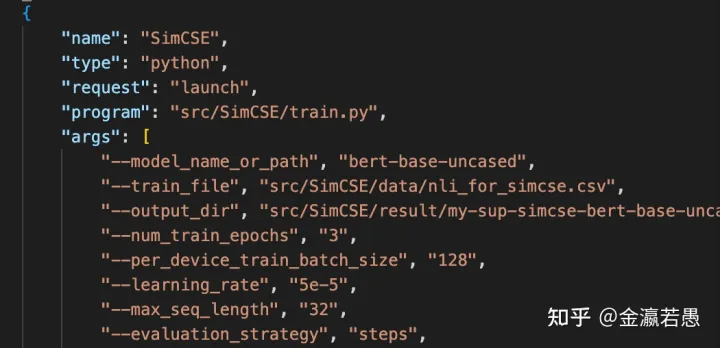
编辑Run and Debug设置(launch.json),可以预先设置training,testing等实验对应的命令行参数和环境变量,以后点对应的按钮就直接运行该实验。不用每次手动复制参数
在repo里开一个文件夹,加入gitignore。每次做可视化图片的时候,把图片存到这个文件夹,即可通过vscode远程看图,不需要每次ssh下载到本地。VS Code也支持内建ipynb文件来一边写一边运行。

点个在看 paper不断!