4种聚类算法及可视化(Python)

         来源:数据STUDIO 算法进阶


        本文约2300字,建议阅读12分钟
        在这篇文章中,基于20家公司的股票价格时间序列数据。
苹果(AAPL),亚马逊(AMZN),Facebook(META),特斯拉(TSLA),Alphabet(谷歌)(GOOGL),壳牌(SHEL),Suncor能源(SU),埃克森美孚公司(XOM),Lululemon(LULU),沃尔玛(WMT),Carters(CRI)、 Childrens Place (PLCE), TJX Companies (TJX), Victoria's Secret & Co (VSCO), Macy's (M), Wayfair (W), Dollar Tree (DLTR), CVS Caremark (CVS), Walgreen (WBA), Curaleaf Holdings Inc. (CURLF)
correlation_mat=df_combined.corr()
定义一个效用函数来显示集群和属于该集群的公司。
# 用来打印公司名称和它们所分配的集群的实用函数
def print_clusters(df_combined,cluster_labels):
  cluster_dict = {}
  for i, label in enumerate(cluster_labels):
      if label not in cluster_dict:
          cluster_dict[label] = []
      cluster_dict[label].append(df_combined.columns[i])

  # 打印出每个群组中的公司 -- 建议关注@公众号:数据STUDIO 定时推送更多优质内容
  for cluster, companies in cluster_dict.items():
      print(f"Cluster {cluster}: {', '.join(companies)}")
方法1:K-means聚类法
from sklearn.cluster import KMeans

# Perform k-means clustering with four clusters
clustering = KMeans(n_clusters=4, random_state=0).fit(correlation_mat)

# Print the cluster labels
cluster_labels=clustering.labels_
print_clusters(df_combined,cluster_labels)
k-means聚类的结果
from sklearn.cluster import AgglomerativeClustering

# 进行分层聚类
clustering = AgglomerativeClustering(n_clusters=n_clusters,
                                     affinity='precomputed',
                                     linkage='complete'
                                    ).fit(correlation_mat)

# Display the cluster labels
print_clusters(df_combined,clustering.labels_)
分层聚类的结果
from sklearn.cluster import AffinityPropagation

# 用默认参数进行亲和传播聚类
clustering = AffinityPropagation(affinity='precomputed').fit(correlation_mat)

# Display the cluster labels
print_clusters(df_combined,clustering.labels_)

from sklearn.cluster import DBSCAN

# Removing negative values in correlation matrix
correlation_mat_pro = 1 + correlation_mat

# Perform DBSCAN clustering with eps=0.5 and min_samples=5
clustering = DBSCAN(eps=0.5, min_samples=5, metric='precomputed').fit(correlation_mat_pro)

# Print the cluster labels
print_clusters(df_combined,clustering.labels_)

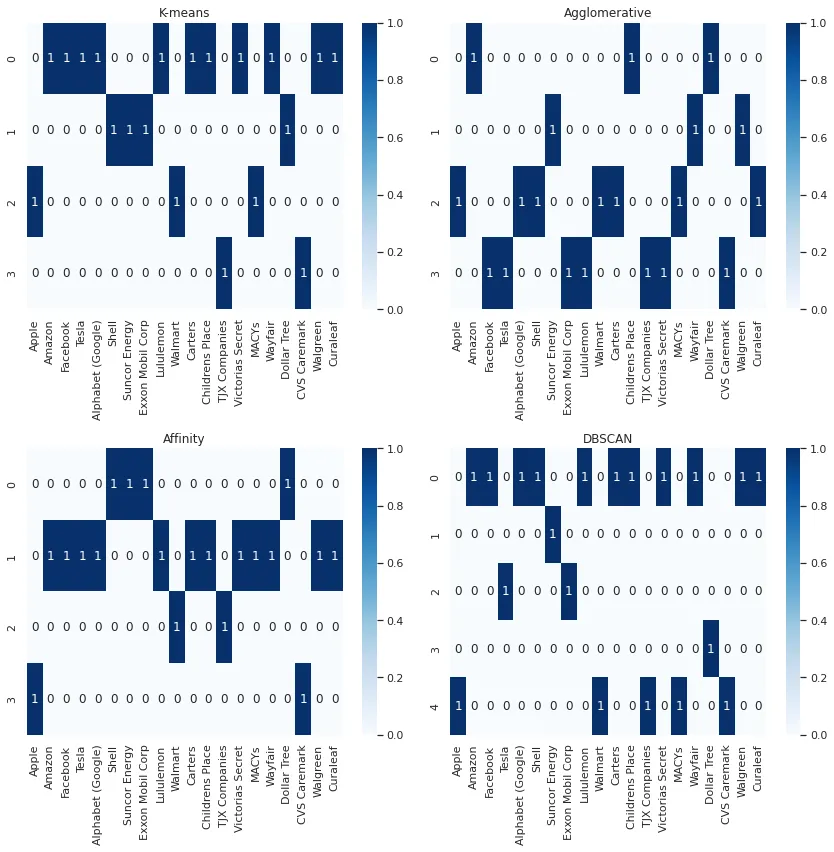
def plot_cluster_heatmaps(cluster_results, companies):

    # 从字典中提取key和value
    methods = list(cluster_results.keys())
    labels = list(cluster_results.values())

    # 定义每个方法的热图数据
    heatmaps = []
    for i in range(len(methods)):
        heatmap = np.zeros((len(np.unique(labels[i])), len(companies)))
        for j in range(len(companies)):
            heatmap[labels[i][j], j] = 1
        heatmaps.append(heatmap)

    # Plot the heatmaps in a 2x2 grid
    fig, axs = plt.subplots(nrows=2, ncols=2, figsize=(12, 12))

    for i in range(len(methods)):
        row = i // 2
        col = i % 2
        sns.heatmap(heatmaps[i], cmap="Blues", annot=True, fmt="g", xticklabels=companies, ax=axs[row, col])
        axs[row, col].set_title(methods[i])

    plt.tight_layout()
    plt.show()

companies=df_combined.columns
plot_cluster_heatmaps(cluster_results, companies)

评论
