教你轻松玩转 Bokeh 可视化
python中的bokeh包也是作图神器,现在了解到了如何作散点图和柱形图,先记录一波。
Bokeh 专门针对Web浏览器的呈现功能的交互式可视化python库。
Bokeh接口
-
Charts:高层接口,以简单的方式绘制复杂的统计图- Plotting:中层接口,用于组装图形元素- Models:底层接口,为开发者提供最大灵活性首先bokeh图举例如下: 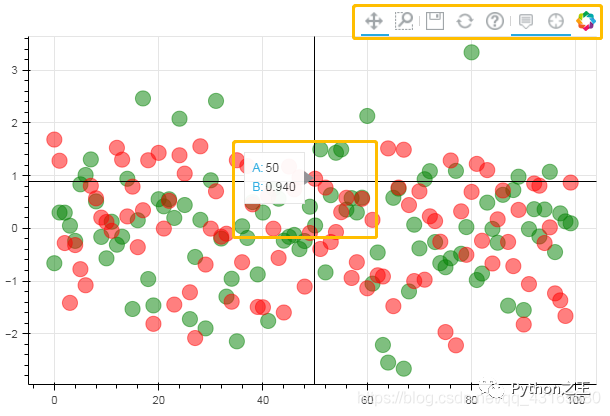 个人认为绘图的基本框架可以为:
-
设置hover提示框的内容1. 设置画布figure1. 绘图(添加散点图/柱形图等)
1. 绘图空间设置
加载需要的包
import numpy as np
import pandas as pd
import matplotlib.pyplot as plt
%matplotlib inline

import warnings
warnings.filterwarnings('ignore')
上面是基本设置,然后加载bokeh包
#导入图表绘制、图表展示模块
from bokeh.plotting import figure,show

#导入notebook绘图模块
from bokeh.io import output_notebook,output_file,show
from bokeh.models import HoverTool
#notebook()绘图命令
output_notebook()
完成后会显示以下结果: 上面是在jupyet notebook里作图,好处是通过output_notebook( )命令,图形可以直接显示在浏览器中,当然还可以保存为html文件。如果在spyder里(Anaconda)作图,可直接保存为html文件,会自动打开。如下命令:
from bokeh.plotting import figure,show,outplot_file
#output_file是用于非notebook中创建绘图空间
#即没法立即在编辑器中显示,先保存成file文件,再在web浏览器中打开
outputfile('examp.html')  #创建html文件
#绘图之后,会弹出html窗口,图形文件也会储存在创建的目录里面
2. 图表绘制工具figure
figure(plot_width,plot_height,      #图形的宽度、高度
       tools,                       #工具栏
       toolbar_lacation,            #工具位置
       x_axis_label,y_axis_label,     #x轴、y轴坐标轴标签
       x_range,y_range,             #x轴、y轴刻度范围
       title)                       #图表标题
参数设置 :
toolbar_location:工具栏位置('above' 'below' 'left' 'right')

toolbar_sticky=False:工具栏为below时,参数=F可使toolbars不被遮挡

tools内容:
-  pan、xpan和ypan:直接移动、横轴、竖轴移动
-  box_select:矩形框选中
-  lasso_select: 任意形状选中
-  box_zoom:矩形框放大
-  wheel_boom、xwheel_zoom、ywheel_zoom:滚轮缩放(直接缩放、X轴、Y轴)
-  zoom_in:通过鼠标点击缩放
-  reset:重置
-  save:保存

-  hover:用于设置显示内容(提示框)
   (先加载 from bokeh.models import HoverTool)

-  crosshair:十字叉
3. hover提示框内容设置
from bokeh.models import HoverTool
hover=HoverTool(tooltips=[
    ('index','$index'),
    ('(x,y)','($x,$y)'),
    ('A','@A'),('B','@B'),
    ('type','@type'),
    ('color','@color')
])
参数设置:
index:自动计算数据index
x,y:自动计算x值y值
A,B:显示ColumnDataSource中对应字段值

tools=[hover,'pan,box_select,lasso_select,reset,save,crosshair']
以上设置,hover只展示每个点(柱子)的每个标签

tools=['hover,pan,box_select,lasso_select,reset,save,crosshair']
以上设置,hover展示点的坐标,不展示标签
4. 绘制散点图
p.circle(x,y,                 #x轴、y轴值
        size,color,alpha,     #点的大小、颜色、透明度
        #(注意,这里的color是线+填充的颜色,同时上色,若分别上色,参数如下)
        fill_color,fill_alpha,
        line_color,line_alpha,line_dash,line_width,
        legend,     #设置图例
        #radius     #设置点半径,和size只能同时选一个
        )
4.1 构造数据
直接构造数据框
df=pd.DataFrame(np.random.randn(100,2),columns=['A','B'])
df.head(2)
 或使用ColumnSource构造数据
from bokeh.models import ColumnDataSource
source=ColumnDataSource(df)
source
ColumnDataSource( id = ‘1003’, …)
ColumnDataSource是Bokeh中一种重要的数据形式。使用bokeh作图时,可以直接提供数据,也可以使用ColumnDataSource提供数据。ColumnDataSource()方法有一个参数为data,data重要有以下几种类型:(1)data为字典 (2)data为Pandas的DataFrame (3)data为Pandas的DataFrame的groupby对象 参考:
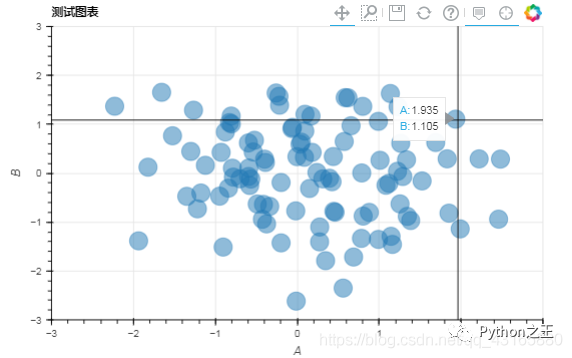
4.2 测试图表
#设置提示框内容
hover=HoverTool(tooltips=[
    ('A','@A'),('B','@B'),
])

#设置画布
p=figure(plot_width=600,plot_height=400,
        tools=[hover,'crosshair,pan,box_zoom,save,reset,help'],
        toolbar_location='above',
        x_axis_label='A',y_axis_label='B',
        x_range=[-3,3],y_range=[-3,3],
        title='测试图表')


#设置标题:颜色、字体、风格、背景颜色
p.title.text_color='black'
p.title.text_font='times'
#p.title.text_font_style='italic'
#p.title.background_fill_color='black'

#添加散点
p.circle(x='A',y='B',source=df, #或source=source
        size=20,alpha=0.5)
show(p)
5. 颜色设置
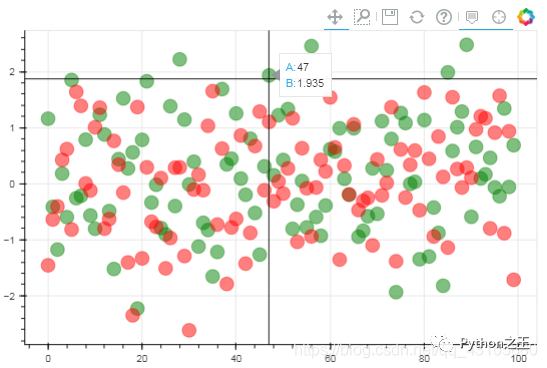
颜色设置:
hover=HoverTool(tooltips=[
    ('A','@x'),('B','@y'),
])

p=figure(plot_width=600,plot_height=400,
        tools=[hover,'crosshair,pan,box_zoom,save,reset,help'],
        toolbar_location='above')

p.circle(x=df.index,y=df['A'],color='green',size=15,alpha=0.5)
p.circle(x=df.index,y=df['B'],color='#FF0000',size=15,alpha=0.5)
#这样两个图会一块在一张图上
#若要分开,使用p1、p2
show(p)
5.1 颜色变化、散点大小设置
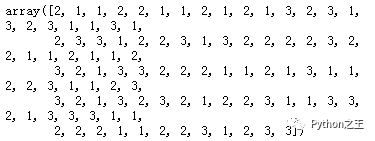
5.1.1 数据中有一列用来设置颜色或大小
rng=np.random.RandomState(1)
rng.randint(1,4,100)
5.1.2 类别型颜色
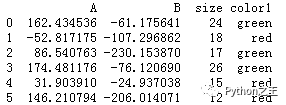
构造作图数据
#构造作图使用数据
rng=np.random.RandomState(1)  #设置随机种子
df=pd.DataFrame(rng.randn(100,2)*100,columns=['A','B'])

#设置点大小字段
df['size']=rng.randint(10,30,100)

#设置颜色
df['color1']=np.random.choice(['red','green','blue'],100) #与下面命令效果相同
#colormap1={1:'red',2:'green',3:'blue'}
#df['color1']=[colormap1[x] for x in rng.randint(1,4,100)]

print(df.head(6))
df2=ColumnDataSource(df)
 作图:
作图:
hover=HoverTool(tooltips=[
    ('A','@A'),('B','@B'),
])
#画布
p=figure(plot_width=600,plot_height=400,
        tools=[hover,'crosshair,pan,box_zoom,save,reset,help'],
        toolbar_location='above')
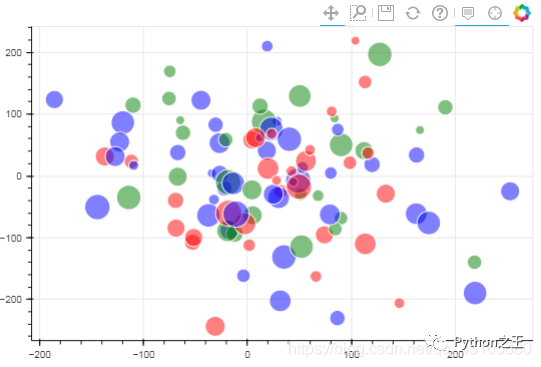
#散点
p.circle(x='A',y='B',source=df, #或source=df2(ColumnSource数据)
        line_color='white',     #设置点边线为白色
        fill_color='color1',fill_alpha=0.5,
        size='size')
show(p)
5.1.3 连续型颜色
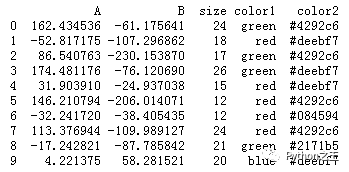
#构造作图数据
from bokeh.palettes import brewer
n=8
colormap2=brewer['Blues'][n]
print(colormap2)
(’#084594’, ‘#2171b5’, ‘#4292c6’, ‘#6baed6’, ‘#9ecae1’, ‘#c6dbef’, ‘#deebf7’, ‘#f7fbff’)
df['color2']=[colormap2[x] for x in rng.randint(0,n,100)]
print(df.head(10))
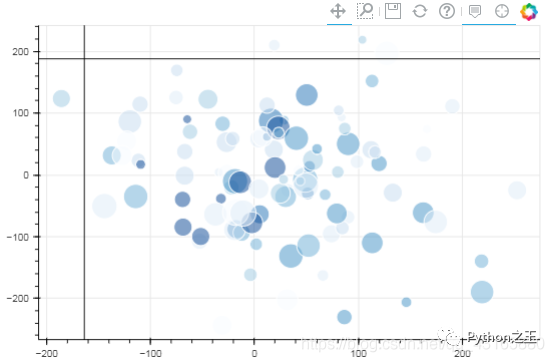
#这里的颜色为随机确定的不同蓝色(为了观察到渐变效果)
 作图:
作图:
df3=ColumnDataSource(df)

hover=HoverTool(tooltips=[
    ('A','@A'),('B','@B'),
])

p=figure(plot_width=600,plot_height=400,
        tools=[hover,'crosshair,pan,box_zoom,save,reset,help'],
        toolbar_location='above')
p.circle(x='A',y='B',source=df3,
        line_color='white',
        fill_color='color2',fill_alpha=0.5,
        #但这个颜色是随机的,不是越大颜色越深,因为上面取得颜色是随机的
        size='size')
show(p)
6. 遍历数据分开作图
遇到类别型数据,需要针对每个类别单独作图,可以单独做出来。这里是以循环,遍历三个类别,分别做出三个图,其实可以单独做一个。将循环拆开即可。
rng=np.random.RandomState(1)
df=pd.DataFrame(rng.randn(100,2)*100,columns=['A','B'])
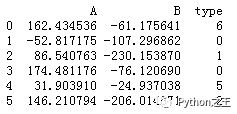
df['type']=rng.randint(0,7,100)
print(df.head(6))

df4=ColumnDataSource(df)
 作图(重在学习循环的思路):
colors=['red','olive','darkred',
       'goldenrod','skyblue','orange','salmon']

p1=figure(plot_width=600,plot_height=400)
p2=figure(plot_width=600,plot_height=400)
p3=figure(plot_width=600,plot_height=400)
plst=[p1,p2,p3]

'''
这个是通过循环做出每个类别的图形,不是分面
'''
for t,pi in zip(df['type'].unique()[:3],plst):
    pi.circle(df['A'][df['type']==t],
             df['B'][df['type']==t],
             size=20,alpha=0.5,
             color=colors[t],
             legend='type%i'%t)
    show(pi)
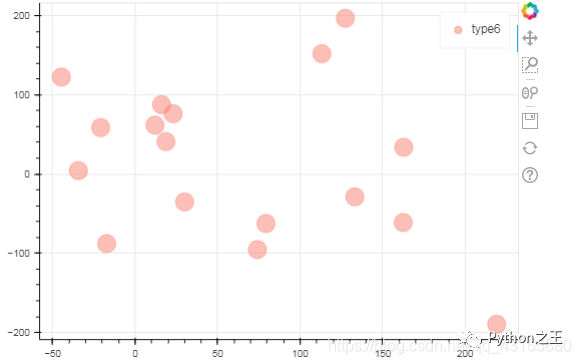 (类似输出3个图形)
7. 柱形图
7.1 单系列柱形图1
p.vbar(x=[1,2,3],bottom=0,top=[1.2,2.5,3.7],
      width=0.5,
      color=['red','blue','green'],
      alpha=0.8,
      line_width=1,line_alpha=0.8,
      line_color='black',line_dash=[5,2],
      fill_color='red',fill_alpha=0.6)
hover=HoverTool(tooltips=[
    ('x','@x'),('num','@top')
])

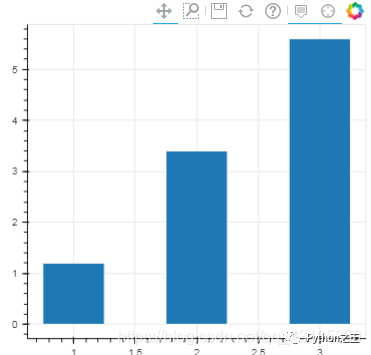
x=[1,2,3]
t=[1.2,3.4,5.6]

p=figure(plot_width=400,plot_height=400,
        tools=[hover,'crosshair,pan,box_zoom,save,reset,help'],
        toolbar_location='above')
p.vbar(x=x,width=0.5,
      bottom=0,top=t,
      line_color='white')
show(p)
7.2 单系列柱形图2-分类标签
p.vbar(x='fruits',y='counts',source=df,
       width=0.9,alpha=0.8,
       color=factor_cmap('fruits',palette=Spectral6,factors=fruits),
       legend='fruits')
构造数据:
from bokeh.models import ColumnDataSource
from bokeh.palettes import Spectral6
from bokeh.transform import factor_cmap

'''df=pd.DataFrame({'fruits':['Apples', 'Pears', 'Nectarines', 'Plums', 'Grapes', 'Strawberries'],
   'counts':[5, 3, 4, 2, 4, 6]})'''

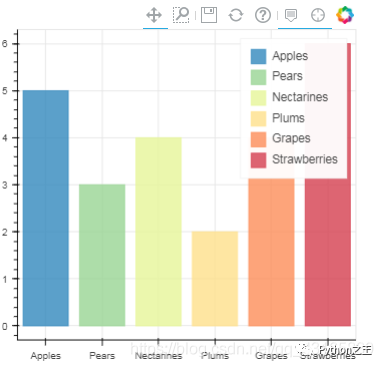
fruits = ['Apples', 'Pears', 'Nectarines', 'Plums', 'Grapes', 'Strawberries']
counts = [5, 3, 4, 2, 4, 6]
df=ColumnDataSource(data=dict(fruits=fruits,counts=counts))
#colors = [ "salmon", "olive", "darkred", "goldenrod", "skyblue", "orange"]
df
作图:
hover=HoverTool(tooltips=[
    ('fruits','@fruits'),('counts','@counts')
])
p=figure(x_range=fruits,
         #x_range一开始就要设置成一个字符串的列表
        plot_width=400,plot_height=400,
        tools=[hover,'crosshair,pan,box_zoom,save,reset,help'],
        toolbar_location='above')
p.vbar(x='fruits',top='counts',source=df,
      width=0.8,alpha=0.8,
      color=factor_cmap('fruits',palette=Spectral6,
                       factors=fruits),
      legend='fruits')
show(p)
8. 一个小点:多图表
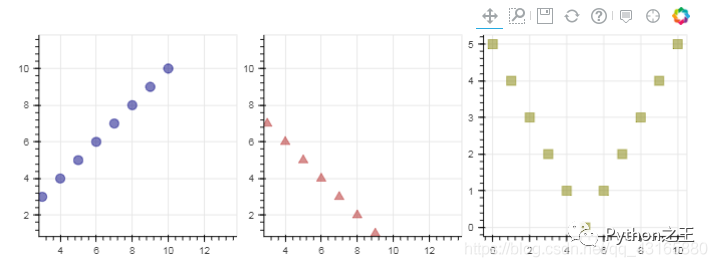
多个图表间相互联系(前提是有相同数据,比如多个散点图,x轴数据相同,y轴数据不相同。具体查看图1中x某些点与y1的关系时,可以相应展示出图2中x这些点与y2的关系)
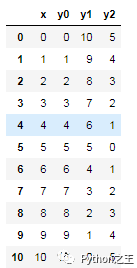
构造数据:
from bokeh.layouts import gridplot

x=list(range(11))
y0=x
y1=[10-xx for xx in x]
y2=[abs(xx-5) for xx in x]

df=pd.DataFrame({<!-- -->'x':x,'y0':y0,
                'y1':y1,'y2':y2})
df2=ColumnDataSource(df)
df
 作图:
作图:
#当这些数据用的是一组数据的时候会形成联动,主要是设置x_range=s1.x_range,y_range=s1.y_range
#如果把s2、s3里面去掉就不是用的一个数据了,则不会产生联动
hover=hover=HoverTool(tooltips=[
    ('x','@x'),('y','@y')
])

#绘制s1
s1=figure(plot_width=250,plot_height=250,title=None,
         tools=[hover,'crosshair,pan,box_zoom,save,reset,help'],
         toolbar_location='above')
s1.circle(x='x',y='y0',
          source=df,
          size=10,color='navy',alpha=0.5)

#s2设置了和s1联动
s2=figure(plot_width=250,plot_height=250,
         x_range=s1.x_range,y_range=s1.y_range,
         title=None,
         tools=[hover,'crosshair,pan,box_zoom,save,reset,help'],
         toolbar_location='above')
#如果设置了tools='box_select'以放大筛选时不会有联动,但在移动时会有联动
s2.triangle(x='x',y='y1',
            source=df,
            size=10,color='firebrick',alpha=0.5)

#s3没有设置了和s1联动
s3=figure(plot_width=250,plot_height=250,
         #x_range=s1.x_range,y_range=s1.y_range,
         #不加以上参数,则不会产生联动
         title=None,
         tools=[hover,'crosshair,pan,box_zoom,save,reset,help'],
         toolbar_location='above')
s3.square(x='x',y='y2',
          source=df,
          size=10,color='olive',alpha=0.5)

#图形展示
p=gridplot([[s1,s2,s3]])

#p=gridplot([[s1,s2],[None,s3]])
show(p)


Python“宝藏级”公众号【Python之王】专注于Python领域,会爬虫,数分,C++,tensorflow和Pytorch等等。
近 2年共原创 100+ 篇技术文章。创作的精品文章系列有:
日常收集整理了一批不错的 Python 学习资料,有需要的小伙可以自行免费领取。
获取方式如下:公众号回复资料。领取Python等系列笔记,项目,书籍,直接套上模板就可以用了。资料包含算法、python、算法小抄、力扣刷题手册和 C++ 等学习资料!
