用Keras解决机器学习问题!
深度学习框架Keras入门项目
本文介绍3个案例来帮助读者认识和入门深度学习框架Keras。3个案例解决3个问题:回归、二分类、多分类.
本文审稿人:牧小熊,Datawhale成员

为什么选择Keras
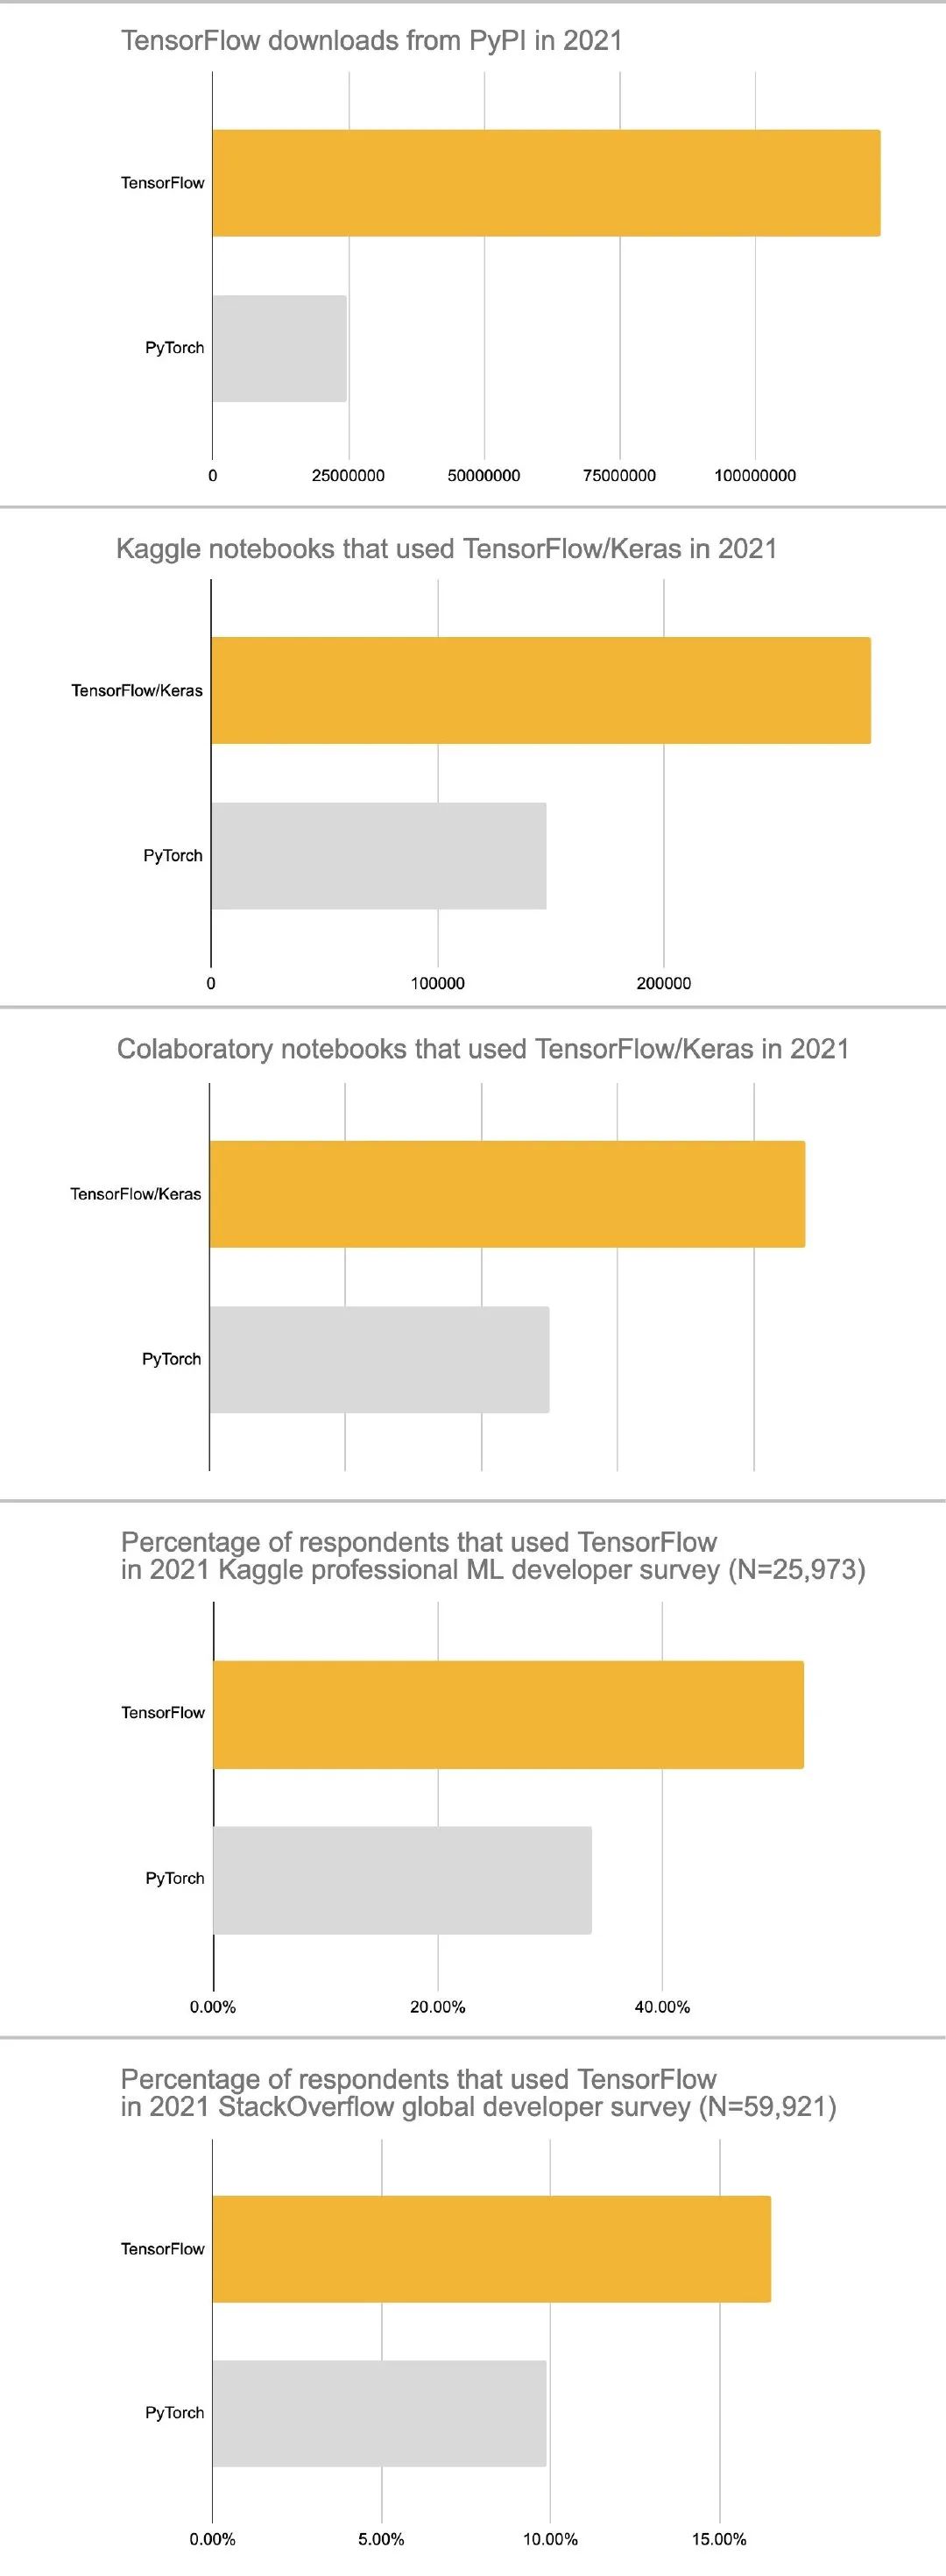
相信很多小伙伴在入门深度学习时候首选框架应该是TensorFlow或者Pytorch。在如今无数深度学习框架中,为什么要使用 Keras 而非其他?整理自Keras中文官网:
Keras 优先考虑开发人员的经验 Keras 被工业界和学术界广泛采用 Keras 可以轻松将模型转化为产品 Keras 支持多个后端引擎 Keras 拥有强大的多 GPU 和分布式训练支持 Keras 的发展得到关键公司的支持,比如:谷歌、微软等
详细信息见中文官网:https://keras.io/zh/why-use-keras/
主要步骤
使用Keras解决机器学习/深度学习问题的主要步骤:
特征工程+数据划分 搭建神经网络模型add 查看网络架构summary 编译网络模型compile 训练网络fit 保存模型save 评估模型evaluate 评价指标可视化visualize
导入库
import pandas as pd
import numpy as np

import matplotlib.pyplot as plt
%matplotlib inline

from sklearn import datasets
from sklearn.preprocessing import MinMaxScaler
from sklearn.preprocessing import StandardScaler
from sklearn.model_selection import train_test_split

import tensorflow as tf
from keras import models
from keras import layers
from keras.models import load_model

np.random.seed(1234)
回归案例
回归案例中使用的是Keras自带的波士顿房价数据集。
导入数据
In [2]:
from keras.datasets import boston_housing

(train_X, train_y), (test_X, test_y) = boston_housing.load_data()
In [3]:
train_X.shape # 数据形状
Out[3]:
(404, 13)
In [4]:
train_X[:3] # 特征向量值
Out[4]:
array([[1.23247e+00, 0.00000e+00, 8.14000e+00, 0.00000e+00, 5.38000e-01,
        6.14200e+00, 9.17000e+01, 3.97690e+00, 4.00000e+00, 3.07000e+02,
        2.10000e+01, 3.96900e+02, 1.87200e+01],
       [2.17700e-02, 8.25000e+01, 2.03000e+00, 0.00000e+00, 4.15000e-01,
        7.61000e+00, 1.57000e+01, 6.27000e+00, 2.00000e+00, 3.48000e+02,
        1.47000e+01, 3.95380e+02, 3.11000e+00],
       [4.89822e+00, 0.00000e+00, 1.81000e+01, 0.00000e+00, 6.31000e-01,
        4.97000e+00, 1.00000e+02, 1.33250e+00, 2.40000e+01, 6.66000e+02,
        2.02000e+01, 3.75520e+02, 3.26000e+00]])
In [5]:
train_y[:3] # 标签值
Out[5]:
array([15.2, 42.3, 50. ])
数据标准化
神经网络中一般输入的都是较小数值的数据,数据之间的差异不能过大。现将特征变量的数据进行标准化处理
In [6]:
train_X[:3] # 处理前
Out[6]:
array([[1.23247e+00, 0.00000e+00, 8.14000e+00, 0.00000e+00, 5.38000e-01,
        6.14200e+00, 9.17000e+01, 3.97690e+00, 4.00000e+00, 3.07000e+02,
        2.10000e+01, 3.96900e+02, 1.87200e+01],
       [2.17700e-02, 8.25000e+01, 2.03000e+00, 0.00000e+00, 4.15000e-01,
        7.61000e+00, 1.57000e+01, 6.27000e+00, 2.00000e+00, 3.48000e+02,
        1.47000e+01, 3.95380e+02, 3.11000e+00],
       [4.89822e+00, 0.00000e+00, 1.81000e+01, 0.00000e+00, 6.31000e-01,
        4.97000e+00, 1.00000e+02, 1.33250e+00, 2.40000e+01, 6.66000e+02,
        2.02000e+01, 3.75520e+02, 3.26000e+00]])
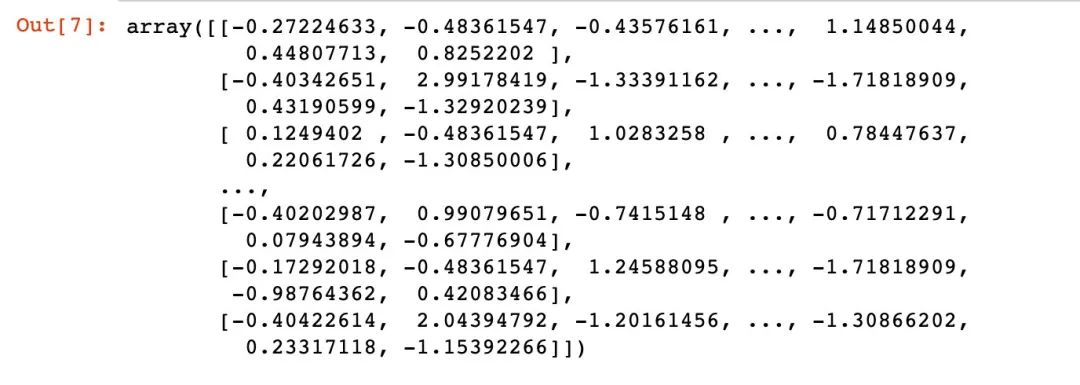
针对训练集的数据做标准化处理:减掉均值再除以标准差
In [7]:
mean = train_X.mean(axis=0)  # 均值
train_X = train_X - mean  # 数值 - 均值

std = train_X.std(axis=0)  # 标准差
train_X /= std  # 再除以标准差

train_X  # 处理后
针对测集的数据处理:使用训练集的均值和标准差
In [8]:
test_X -= mean  # 减掉均值
test_X /= std   # 除以标准差
构建网络
In [9]:
train_X.shape
Out[9]:
(404, 13)
In [10]:
model = models.Sequential()
model.add(tf.keras.layers.Dense(64,
                                activation="relu",
                                input_shape=(train_X.shape[1], )))
model.add(tf.keras.layers.Dense(64,
                                activation="relu"))

model.add(tf.keras.layers.Dense(1))  # 最后的密集连接层,不用激活函数
model.compile(optimizer="rmsprop",  # 优化器
              loss="mse",  # 损失函数
              metrics=["mae"]  # 评估指标:平均绝对误差
             )
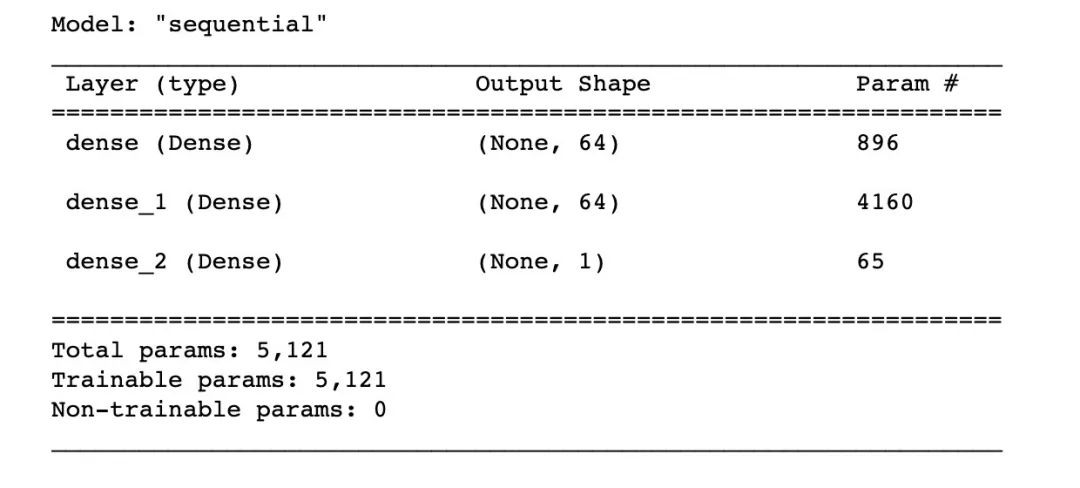
网络架构
In [11]:
model.summary()
训练网络
In [12]:
history = model.fit(train_X,  # 特征
          train_y,  # 输出
          epochs = 100,  # 模型训练100轮
          validation_split=0.2,
          batch_size=1,
          verbose=0  # 静默模式;如果=1表示日志模式,输出每轮训练的结果
         )
保存模型
In [13]:
model.save("my_model.h5")  # 保存模型

del model  # 删除现有的模型
In [14]:
model = load_model('my_model.h5') # 加载模型
评估模型
返回的是loss和mae的取值
In [15]:
model.evaluate(test_X, test_y)
4/4 [==============================] - 0s 6ms/step - loss: 16.1072 - mae: 2.5912
Out[15]:
[16.107179641723633, 2.5912036895751953]
history对象
In [16]:
type(history) # 回调的History对象
Out[16]:
keras.callbacks.History
In [17]:
type(history.history) # 字典
Out[17]:
dict
In [18]:
查看history.history字典对象中的信息:keys就是每个评价指标,values其实就是每次输出的指标对应的值
for keys,_ in history.history.items():
    print(keys)
loss
mae
val_loss
val_mae
In [19]:
len(history.history["loss"])
Out[19]:
100
In [20]:
history.history["loss"][:10]
Out[20]:
[197.65003967285156,
 32.76368713378906,
 22.73907470703125,
 18.689529418945312,
 16.765336990356445,
 15.523008346557617,
 14.131484985351562,
 13.04631519317627,
 12.62230396270752,
 12.256169319152832]
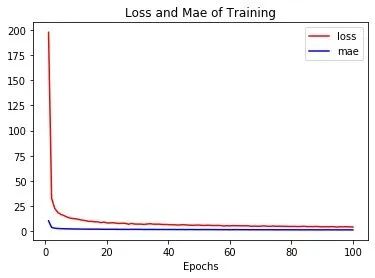
loss-mae
In [21]:
# 损失绘图
import matplotlib.pyplot as plt

history_dict = history.history
loss_values = history_dict["loss"]
mae_values = history_dict["mae"]

epochs = range(1,len(loss_values) + 1)

# 训练
plt.plot(epochs,  # 循环轮数
         loss_values,  # loss取值
         "r",  # 红色
         label="loss"
        )

plt.plot(epochs,
         mae_values,
         "b",
         label="mae"
        )

plt.title("Loss and Mae of Training")
plt.xlabel("Epochs")
plt.legend()

plt.show()
二分类
使用的是sklearn中自带的cancer数据集
导入数据
In [22]:
cancer=datasets.load_breast_cancer()
cancer
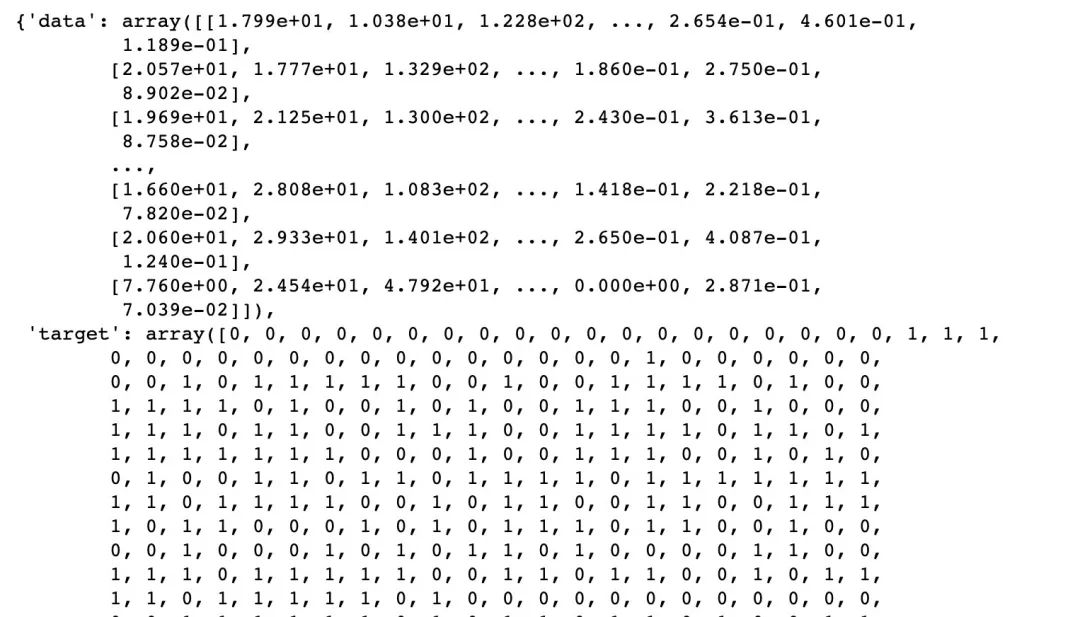

部分数据信息截图
# 生成特征数据和标签数据

X = cancer.data
y = cancer.target
数据标准化
In [24]:
X[:2] # 转换前
Out[24]:
array([[1.799e+01, 1.038e+01, 1.228e+02, 1.001e+03, 1.184e-01, 2.776e-01,
        3.001e-01, 1.471e-01, 2.419e-01, 7.871e-02, 1.095e+00, 9.053e-01,
        8.589e+00, 1.534e+02, 6.399e-03, 4.904e-02, 5.373e-02, 1.587e-02,
        3.003e-02, 6.193e-03, 2.538e+01, 1.733e+01, 1.846e+02, 2.019e+03,
        1.622e-01, 6.656e-01, 7.119e-01, 2.654e-01, 4.601e-01, 1.189e-01],
       [2.057e+01, 1.777e+01, 1.329e+02, 1.326e+03, 8.474e-02, 7.864e-02,
        8.690e-02, 7.017e-02, 1.812e-01, 5.667e-02, 5.435e-01, 7.339e-01,
        3.398e+00, 7.408e+01, 5.225e-03, 1.308e-02, 1.860e-02, 1.340e-02,
        1.389e-02, 3.532e-03, 2.499e+01, 2.341e+01, 1.588e+02, 1.956e+03,
        1.238e-01, 1.866e-01, 2.416e-01, 1.860e-01, 2.750e-01, 8.902e-02]])
In [25]:
ss = StandardScaler()

X = ss.fit_transform(X)
X[:2]   # 转换后
Out[25]:
array([[ 1.09706398e+00, -2.07333501e+00,  1.26993369e+00,
         9.84374905e-01,  1.56846633e+00,  3.28351467e+00,
         2.65287398e+00,  2.53247522e+00,  2.21751501e+00,
         2.25574689e+00,  2.48973393e+00, -5.65265059e-01,
         2.83303087e+00,  2.48757756e+00, -2.14001647e-01,
         1.31686157e+00,  7.24026158e-01,  6.60819941e-01,
         1.14875667e+00,  9.07083081e-01,  1.88668963e+00,
        -1.35929347e+00,  2.30360062e+00,  2.00123749e+00,
         1.30768627e+00,  2.61666502e+00,  2.10952635e+00,
         2.29607613e+00,  2.75062224e+00,  1.93701461e+00],
       [ 1.82982061e+00, -3.53632408e-01,  1.68595471e+00,
         1.90870825e+00, -8.26962447e-01, -4.87071673e-01,
        -2.38458552e-02,  5.48144156e-01,  1.39236330e-03,
        -8.68652457e-01,  4.99254601e-01, -8.76243603e-01,
         2.63326966e-01,  7.42401948e-01, -6.05350847e-01,
        -6.92926270e-01, -4.40780058e-01,  2.60162067e-01,
        -8.05450380e-01, -9.94437403e-02,  1.80592744e+00,
        -3.69203222e-01,  1.53512599e+00,  1.89048899e+00,
        -3.75611957e-01, -4.30444219e-01, -1.46748968e-01,
         1.08708430e+00, -2.43889668e-01,  2.81189987e-01]])
数据集划分
In [26]:
X_train, X_test, y_train, y_test = train_test_split(X,y,test_size=0.2,random_state=123)

X_train.shape
Out[26]:
(455, 30)
In [27]:
y_train.shape
Out[27]:
(455,)
In [28]:
X_test.shape # 测试集长度是114
Out[28]:
(114, 30)
构建网络
这是一个二分类的问题,最后一层使用sigmoid作为激活函数
In [29]:
model = models.Sequential()

# 输入层
model.add(tf.keras.layers.Dense(16,
                                activation="relu",
                                input_shape=(X_train.shape[1],)))
# 隐藏层
model.add(tf.keras.layers.Dense(16,
                                activation="relu"))
# 输出层
model.add(tf.keras.layers.Dense(1,
                                activation="sigmoid"))
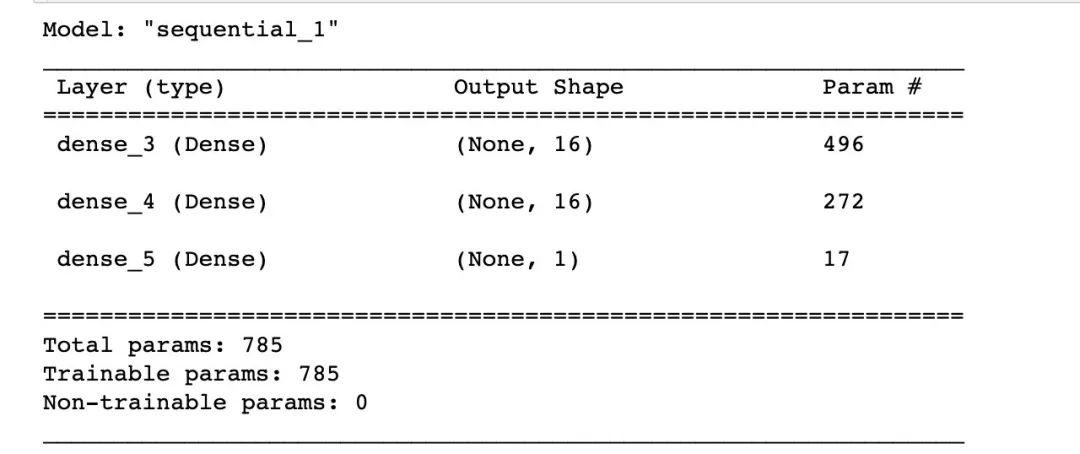
网络架构
In [30]:
model.summary()
编译模型
在keras搭建的神经网络中,如果输出是概率值的模型,损失函数最好使用:交叉熵crossentropy
常用目标损失函数的选择:
binary_crossentropy:针对二分类问题的交叉熵 categorical_crossentropy:针对多分类问题的交叉熵
两种不同的指定方法:
# 方法1
model.compile(loss='mean_squared_error', optimizer='rmsprop')

# 方法2
from keras import losses
model.compile(loss=losses.mean_squared_error, optimizer='rmsprop')
常用的性能评估函数:
binary_accuracy: 针对二分类问题,计算在所有预测值上的平均正确率 categorical_accuracy:针对多分类问题,计算再所有预测值上的平均正确率 sparse_categorical_accuracy:与categorical_accuracy相同,在对稀疏的目标值预测时有用
In [31]:
# 配置优化器
from keras import optimizers

model.compile(optimizer="rmsprop", # 优化器
              loss="binary_crossentropy",  # 目标损失函数
              metrics=["acc"]  # 评价指标函数 acc--->accuracy
             )
训练网络
In [32]:
len(X_train)
Out[32]:
455
In [33]:
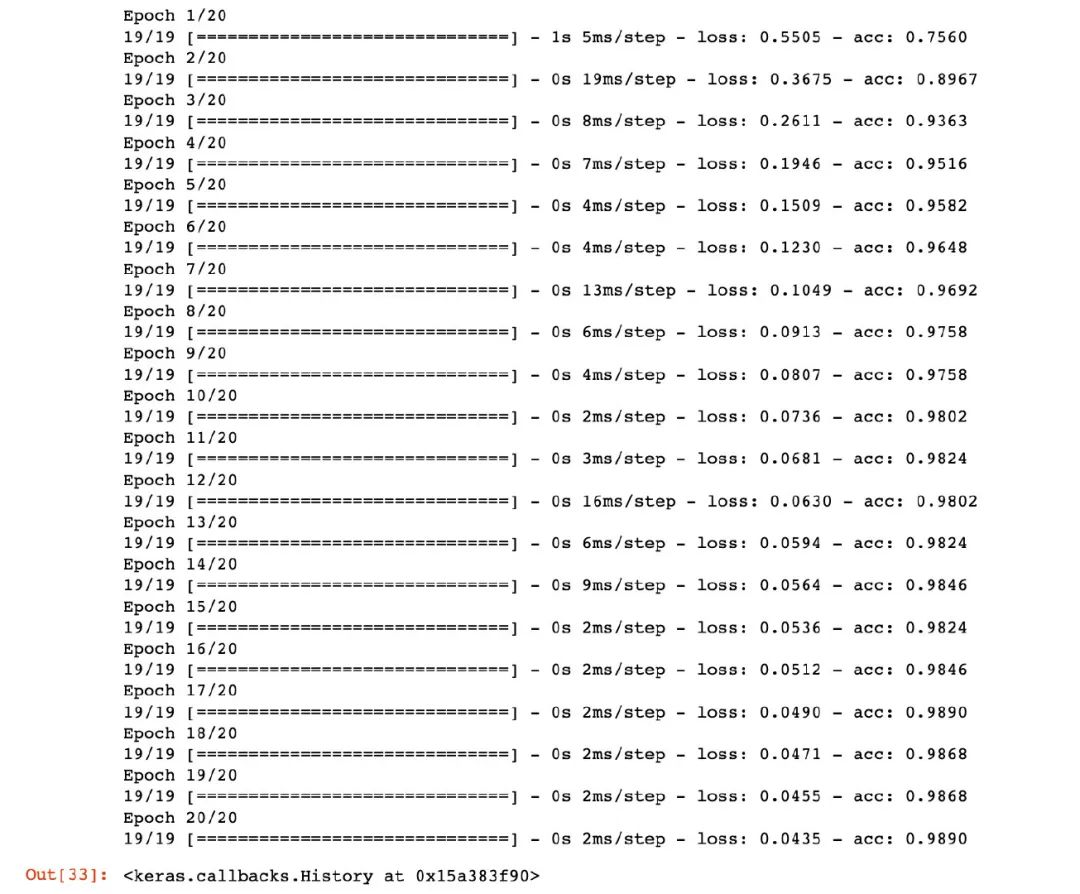
history = model.fit(X_train,  # 特征向量
                    y_train,  # 标签向量
                    epochs=20,  # 训练轮数
                    batch_size=25  # 每次训练的样本数
                   )
history
评估模型
In [34]:
model.evaluate(X_test, y_test)
4/4 [==============================] - 0s 3ms/step - loss: 0.0879 - acc: 0.9825
Out[34]:
[0.08793728798627853, 0.9824561476707458]
可以看到模型的精度达到了惊人的98.2%!
loss-acc
In [35]:
for keys, _ in history.history.items():
    print(keys)
loss
acc
In [36]:
# 损失绘图
import matplotlib.pyplot as plt

history_dict = history.history
loss_values = history_dict["loss"]
acc_values = history_dict["acc"]

epochs = range(1,len(loss_values) + 1)

# 训练
plt.plot(epochs,  # 循环轮数
         loss_values,  # loss取值
         "r",  # 红色
         label="loss"
        )

plt.plot(epochs,
         acc_values,
         "b",
         label="acc"
        )

plt.title("Loss and Acc of Training")
plt.xlabel("Epochs")
plt.legend()

plt.show()
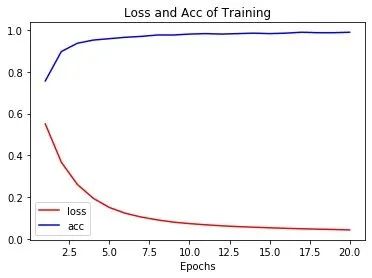
可以看到:随着轮数的增加loss在逐渐降低,而精度acc在逐渐增加,趋近于1
多分类案例
多分类的案例使用sklearn中自带的iris数据集,数据集不多介绍。最终结果是存在3个类的。
导入数据
In [37]:
iris = datasets.load_iris()
In [38]:
# 特征数据和标签数据

X = iris.data
y = iris.target

X[:2]
Out[38]:
array([[5.1, 3.5, 1.4, 0.2],
       [4.9, 3. , 1.4, 0.2]])
In [39]:
y[:3]
Out[39]:
array([0, 0, 0])
数据标准化
In [40]:
ss = StandardScaler()
X = ss.fit_transform(X)
数据集划分
In [41]:
X_train, X_test, y_train, y_test = train_test_split(X,y,test_size=0.2,random_state=123)

X_train.shape
Out[41]:
(120, 4)
标签向量化
In [42]:
y_test[:5] # 转换前
Out[42]:
array([1, 2, 2, 1, 0])
In [43]:
# 内置方法实现标签向量化
from keras.utils.np_utils import to_categorical

y_train = to_categorical(y_train)
y_test = to_categorical(y_test)
In [44]:
y_test[:5] # 转换后
Out[44]:
array([[0., 1., 0.],
       [0., 0., 1.],
       [0., 0., 1.],
       [0., 1., 0.],
       [1., 0., 0.]], dtype=float32)
In [45]:
X_train[:3]
Out[45]:
array([[ 1.88617985, -0.59237301,  1.33113254,  0.92230284],
       [ 0.18982966, -1.97355361,  0.70592084,  0.3957741 ],
       [-1.38535265,  0.32841405, -1.22655167, -1.3154443 ]])
构建模型
In [46]:
model = models.Sequential()
model.add(tf.keras.layers.Dense(64,
                                activation="relu",
                                input_shape=(X_train.shape[1],)))

model.add(tf.keras.layers.Dense(64,
                                activation="relu"))

model.add(tf.keras.layers.Dense(3,
                                activation="softmax"))
模型编译
多分类问题一般是使用categorical_crossentropy作为损失函数。它是用来衡量网络输出的概率分布和标签的真实概率分布的距离。
In [47]:
model.compile(optimizer="rmsprop",
              loss="categorical_crossentropy",
              metrics=["accuracy"]
             )
训练网络
In [48]:
len(X_train)
Out[48]:
120
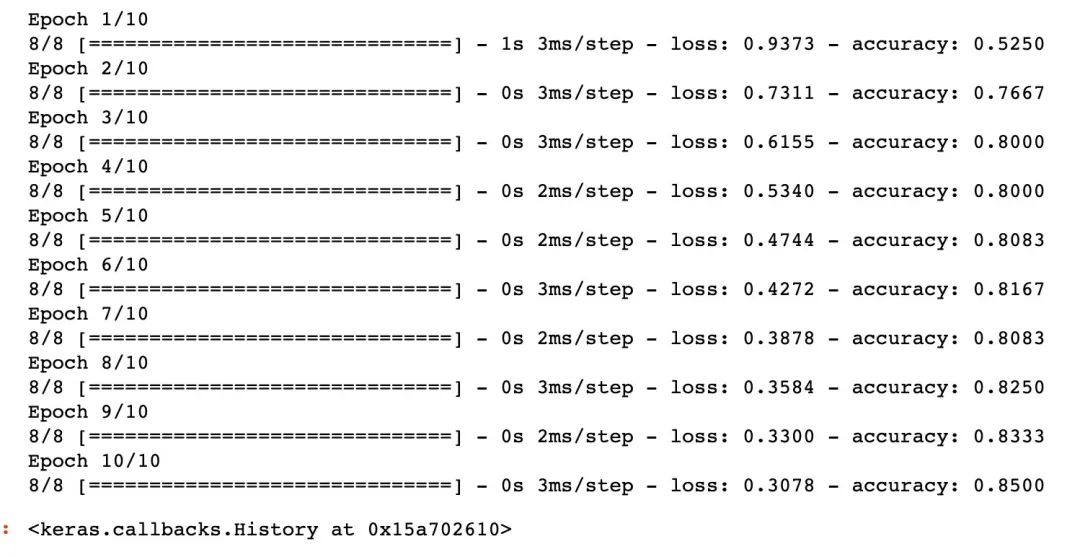
In [49]:
history = model.fit(X_train,
                    y_train,
                    epochs=10,
                    batch_size=15
                   )
history
评估模型
In [50]:
model.evaluate(X_test, y_test)
1/1 [==============================] - 0s 414ms/step - loss: 0.1799 - accuracy: 1.0000
Out[50]:
[0.17986173927783966, 1.0]
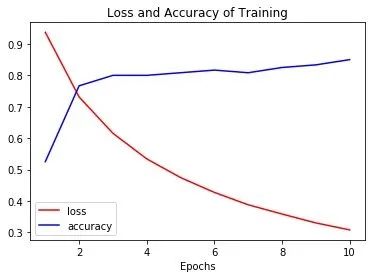
loss-acc曲线
In [51]:
for keys, _ in history.history.items():
    print(keys)
loss
accuracy
In [52]:
# 损失绘图
import matplotlib.pyplot as plt

history_dict = history.history
loss_values = history_dict["loss"]
acc_values = history_dict["accuracy"]

epochs = range(1,len(loss_values) + 1)

# 训练
plt.plot(epochs,  # 循环轮数
         loss_values,  # loss取值
         "r",  # 红色
         label="loss"
        )

plt.plot(epochs,
         acc_values,
         "b",
         label="accuracy"
        )

plt.title("Loss and Accuracy of Training")
plt.xlabel("Epochs")
plt.legend()

plt.show()
1. 验证集数据的引入
2. 加入正则化技术,防止模型过拟合
3. 如何评估训练的轮次,使得模型在合适时机停止
4. 激活函数的选择等
