动态气泡图,拿走不谢!

许久没上公众号的后台,发现了不少变化。
哈哈,不知不觉又鸽了快大半年,接下来多码字,立个Flag。
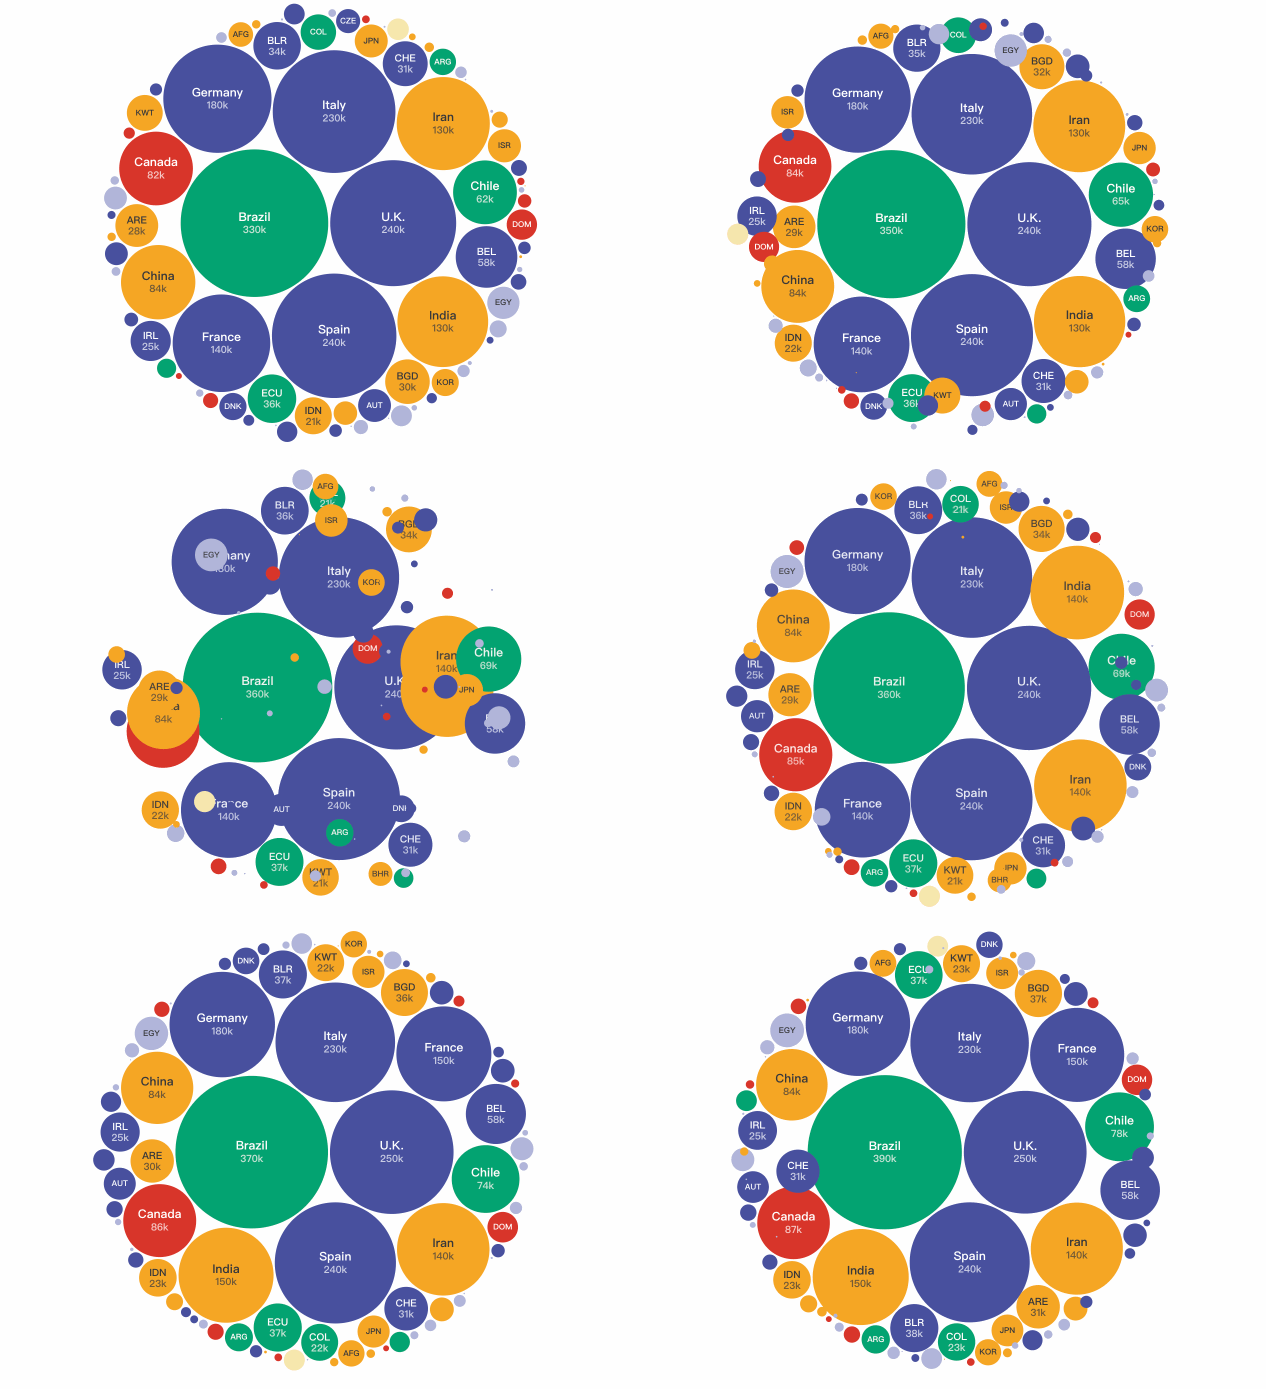
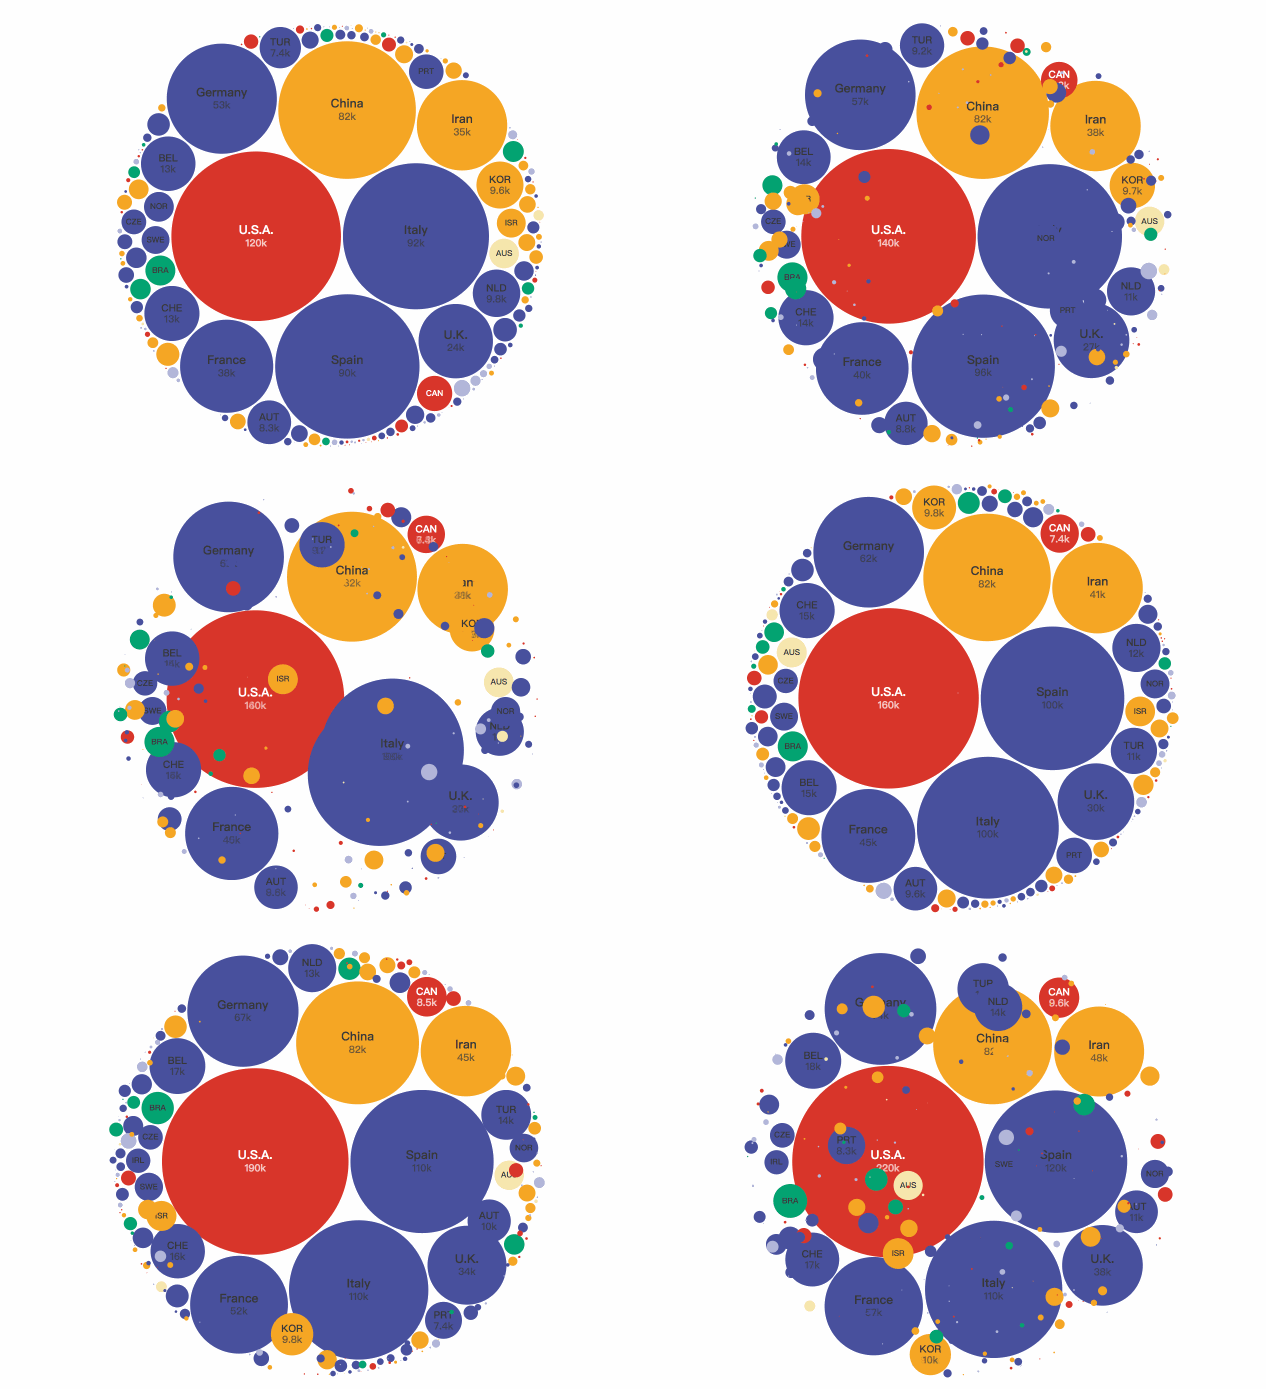
本期给大家分享一个用D3.js实现的动态气泡图案例。
也是之前小F了解D3.js时发现的,效果大致如下。

项目地址:
GitHub地址:https://github.com/unkleho/d3-render
要想实现这个项目的话,首先需要安装Node.js以及npm,具体的安装步骤自行百度,还是比较简单的。
接下来就可以安装Vue.js及Vue脚手架3.0。
所以要想鼓捣一些高大上的可视化,前端的学习是必不可少的,默默的流下没有技术的泪水。
# 安装Vue.js
npm install vue

# 安装Vue-cli3脚手架
npm install -g @vue/cli
# 创建名为bubblechart的项目
vue create bubblechart
结果如下,选择默认模式即可。

由于里面有eslint(编码规范)的存在,记得在配置文件package.json中添加下面的代码。
"rules": {
    "no-unused-vars": "off",
    "no-undef": "off"
}
要不然会出现报错,无法运行。
项目创建成功后,修改App.vue文件内容如下。
<template>
  <div id="app">
    <svg id="bubble-chart" width="954" height="450" />
  </div>
</template>

<script>
export default {
  name: 'App',
  components: {
  }
}
</script>

<style></style>
保存成功后,打开bubblechart文件夹下的终端,运行下面这个命令。
npm run serve
浏览器便会跳出一个标题为bubblechart的空白网页。
安装一些项目依赖d3,d3-render,d3-selection,d3-transition,axios。
npm install d3@5.16.0 --save-dev
npm install d3-render@0.2.4 --save-dev
npm install d3-selection@1.4.2 --save-dev
npm install d3-transition@2.0.0 --save-dev
npm install axios --save-dev
最好是指定版本,要不然可能会报错。
在main.js文件中引用axios,用于请求数据。
import axios from 'axios'
Vue.prototype.$axios = axios
在App.vue的script标签中引用d3,d3-render。
import * as d3 from "d3";
import render from "d3-render";
设置初始数据,各式各样的气泡颜色。
data() {
    return {
      covidData: null,
      countries: null,
      colours: {
        pink: "#D8352A",
        red: "#D8352A",
        blue: "#48509E",
        green: "#02A371",
        yellow: "#F5A623",
        hyperGreen: "#19C992",
        purple: "#B1B4DA",
        orange: "#F6E7AD",
        charcoal: "#383838",
      }
    };
}
获取各地区的新冠数据,两个CSV文件放在Public文件夹下,可直接访问。
methods: {
    async getdata() {
      //获取新冠数据
      await this.$axios.get("data.csv").then((res) => {
        this.covidData = d3.csvParse(res.data);
      });
      //获取国家数据
      await this.$axios.get("countries.csv").then((res) => {
        this.countries = d3.csvParse(res.data);
      });
      //画图
      this.drawType();
    },
}
开始画图的操作,先定义一下画布大小以及各大洲的颜色。
drawType() {
      //设置svg大小
      const width = 954;
      const height = 450;
      //设置各个大洲的参数
      const continents = [
        {
          id: "AF",
          name: "Africa",
          fill: this.colours.purple,
          colour: this.colours.charcoal,
        },
        {
          id: "AS",
          name: "Asia",
          fill: this.colours.yellow,
          colour: this.colours.charcoal,
        },
        {
          id: "EU",
          name: "Europe",
          fill: this.colours.blue,
          colour: this.colours.charcoal,
        },
        {
          id: "NA",
          name: "N. America",
          fill: this.colours.pink,
        },
        {
          id: "OC",
          name: "Oceania",
          fill: this.colours.orange,
          colour: this.colours.charcoal,
        },
        {
          id: "SA",
          name: "S. America",
          fill: this.colours.green,
          colour: this.colours.charcoal,
        },
      ];
}
定义圆圈组件,其中duration很重要,起到一个动画过渡的效果。
//定义圆圈组件
const circleComponent = ({ r, cx, cy, fill, duration }) => {
  return {
    append: "circle",
    r,
    cx,
    cy,
    fill,
    duration,
  };
};
定义文字组件,设置字体、大小、颜色等。
//定义文字组件
const textComponent = ({
    key,
    text,
    x = 0,
    y = 0,
    fontWeight = "bold",
    fontSize = "12px",
    textAnchor = "middle",
    fillOpacity = 1,
    colour,
    r,
    duration = 1000,
}) => {
    return {
        append: "text",
        key,
        text,
        x,
        y,
        textAnchor,
        fontFamily: "sans-serif",
        fontWeight,
        fontSize,
        fillOpacity: { enter: fillOpacity, exit: 0 },
        fill: colour,
        duration,
        style: {
            pointerEvents: "none",
        },
    };
};
数值转换,对较大的数值进行处理。
//对数值进行转换,比如42288变为42k
const format = (value) => {
    const newValue = d3.format("0.2s")(value);
    if (newValue.indexOf("m") > -1) {
        return parseInt(newValue.replace("m", "")) / 1000;
    }
    return newValue;
};
动态变化标签信息,包含名称及数值。
//将各地区名称长度和数值与圆圈大小相比较,实现信息动态变化
const labelComponent = ({ isoCode, countryName, value, r, colour }) => {
    // Don't show any text for radius under 12px
    if (r < 12) {
        return [];
    }
    //console.log(r);
    const circleWidth = r * 2;
    const nameWidth = countryName.length * 10;
    const shouldShowIso = nameWidth > circleWidth;
    const newCountryName = shouldShowIso ? isoCode : countryName;
    const shouldShowValue = r > 18;

    let nameFontSize;

    if (shouldShowValue) {
        nameFontSize = shouldShowIso ? "10px" : "12px";
    } else {
        nameFontSize = "8px";
    }

    return [
        textComponent({
            key: isoCode,
            text: newCountryName,
            fontSize: nameFontSize,
            y: shouldShowValue ? "-0.2em" : "0.3em",
            fillOpacity: 1,
            colour,
        }),
        ...(shouldShowValue
            ? [
                textComponent({
                    key: isoCode,
                    text: format(value),
                    fontSize: "10px",
                    y: shouldShowIso ? "0.9em" : "1.0em",
                    fillOpacity: 0.7,
                    colour,
                }),
            ]
            : []),
    ];
};
设置气泡组件。
//设置气泡组件
const bubbleComponent = ({
    name,
    id,
    value,
    r,
    x,
    y,
    fill,
    colour,
    duration = 1000,
}) => {
    return {
        append: "g",
        key: id,
        transform: {
            enter: `translate(${x + 1},${y + 1})`,
            exit: `translate(${width / 2},${height / 2})`,
        },
        duration,
        delay: Math.random() * 300,
        children: [
            circleComponent({ key: id, r, fill, duration }),
            ...labelComponent({
                key: id,
                countryName: name,
                isoCode: id,
                value,
                r,
                colour,
                duration,
            }),
        ],
    };
};
//d3.pack - 创建一个新的圆形打包图
//d3.hierarchy - 从给定的层次结构数据构造一个根节点并为各个节点指定深度等属性
const pack = (data) =>
    d3
        .pack()
        .size([width - 2, height - 2])
        .padding(2)(d3.hierarchy({ children: data }).sum((d) => d.value));
//生成气泡图表
const renderBubbleChart = (selection, data) => {
    const root = pack(data);
    const renderData = root.leaves().map((d) => {
        return bubbleComponent({
            id: d.data.id,
            name: d.data.name,
            value: d.data.value,
            r: d.r,
            x: d.x,
            y: d.y,
            fill: d.data.fill,
            colour: d.data.colour,
        });
    });
    return render(selection, renderData);
};

const renderBubbleChartContainer = (data) => {
    return renderBubbleChart("#bubble-chart", data);
};
//定义新冠数据
const covidData_result = this.covidData;
//定义各地区数据
const countries_result = this.countries;

//选择数据类型为所有确诊病例数量
const dataKey = "total_cases";
//定义开始时间及结束时间
const startDate = new Date('2020-01-12')
const endDate = new Date('2020-06-02')
//d3.map - 创建一个新的空的 map 映射
const dates = d3
    .map(this.covidData, (d) => d.date)
    .keys()
    .map((date) => new Date(date))
    .filter((date) => date >= startDate && date <= endDate)
    .sort((a, b) => a - b);
//各大洲全选
const selectedContinents = ["AF", "AS", "EU", "NA", "OC", "SA"];
//最小数值
const minimumPopulation = 0;
//排序
const order = "desc";

//转换日期格式为2020-01-01
const getIsoDate = (date) => {
    const IsoDate = new Date(date);
    return IsoDate.toISOString().split("T")[0];
};

//获取最终的数据
function getDataBy({
    dataKey,
    date,
    selectedContinents,
    order,
    minimumPopulation,
}) {
    return (
        covidData_result
            .filter((d) => d)
            .filter((d) => d.iso_code !== "OWID_WRL")
            // Filter out countries with populations under 1 million
            .filter((d) => d.population > parseInt(minimumPopulation))
            .filter((d) => {
                return d.date === getIsoDate(date);
            })
            .filter((d) => d[dataKey])
            .filter((d) => {
                const country = countries_result.find(
                    (c) => c.iso3 === d.iso_code
                );
                const continent = continents.find((c, i) => {
                    if (!country) {
                        return false;
                    }

                    return c.id === country.continentCode;
                });

                if (!continent) {
                    return false;
                }

                return selectedContinents.includes(continent.id);
            })
            .map((d) => {
                const country = countries_result.find(
                    (c) => c.iso3 === d.iso_code
                );
                const continent = continents.find(
                    (c) => c.id === country.continentCode
                );

                const name = country.shortName || country.name;

                return {
                    name,
                    id: country.iso3,
                    value: d[dataKey],
                    fill: continent.fill,
                    colour: continent.colour || "white",
                };
            })
            .filter((d) => d.value !== "0.0")
            .sort(function (a, b) {
                const mod = order === "desc" ? -1 : 1;
                return mod * (a.value - b.value);
            })
    );
}
//延时执行,闭包
for (var i = 0; i < dates.length; i++) {
    (function (i) {
        setTimeout(function () {
            const date = dates[i];
            console.log(date);
            const data = getDataBy({
                dataKey,
                date,
                selectedContinents,
                minimumPopulation,
                order,
            });
            renderBubbleChartContainer(data);
        }, 2000 * i);
    })(i);
};

npm install
npm run serve
万水千山总是情,点个「在看」行不行。
··· END ···
推荐阅读:
Python中的高效迭代库itertools,排列组合随便求
万字长文详解|Python库collections,让你击败99%的Pythoner
↓扫描关注本号↓
