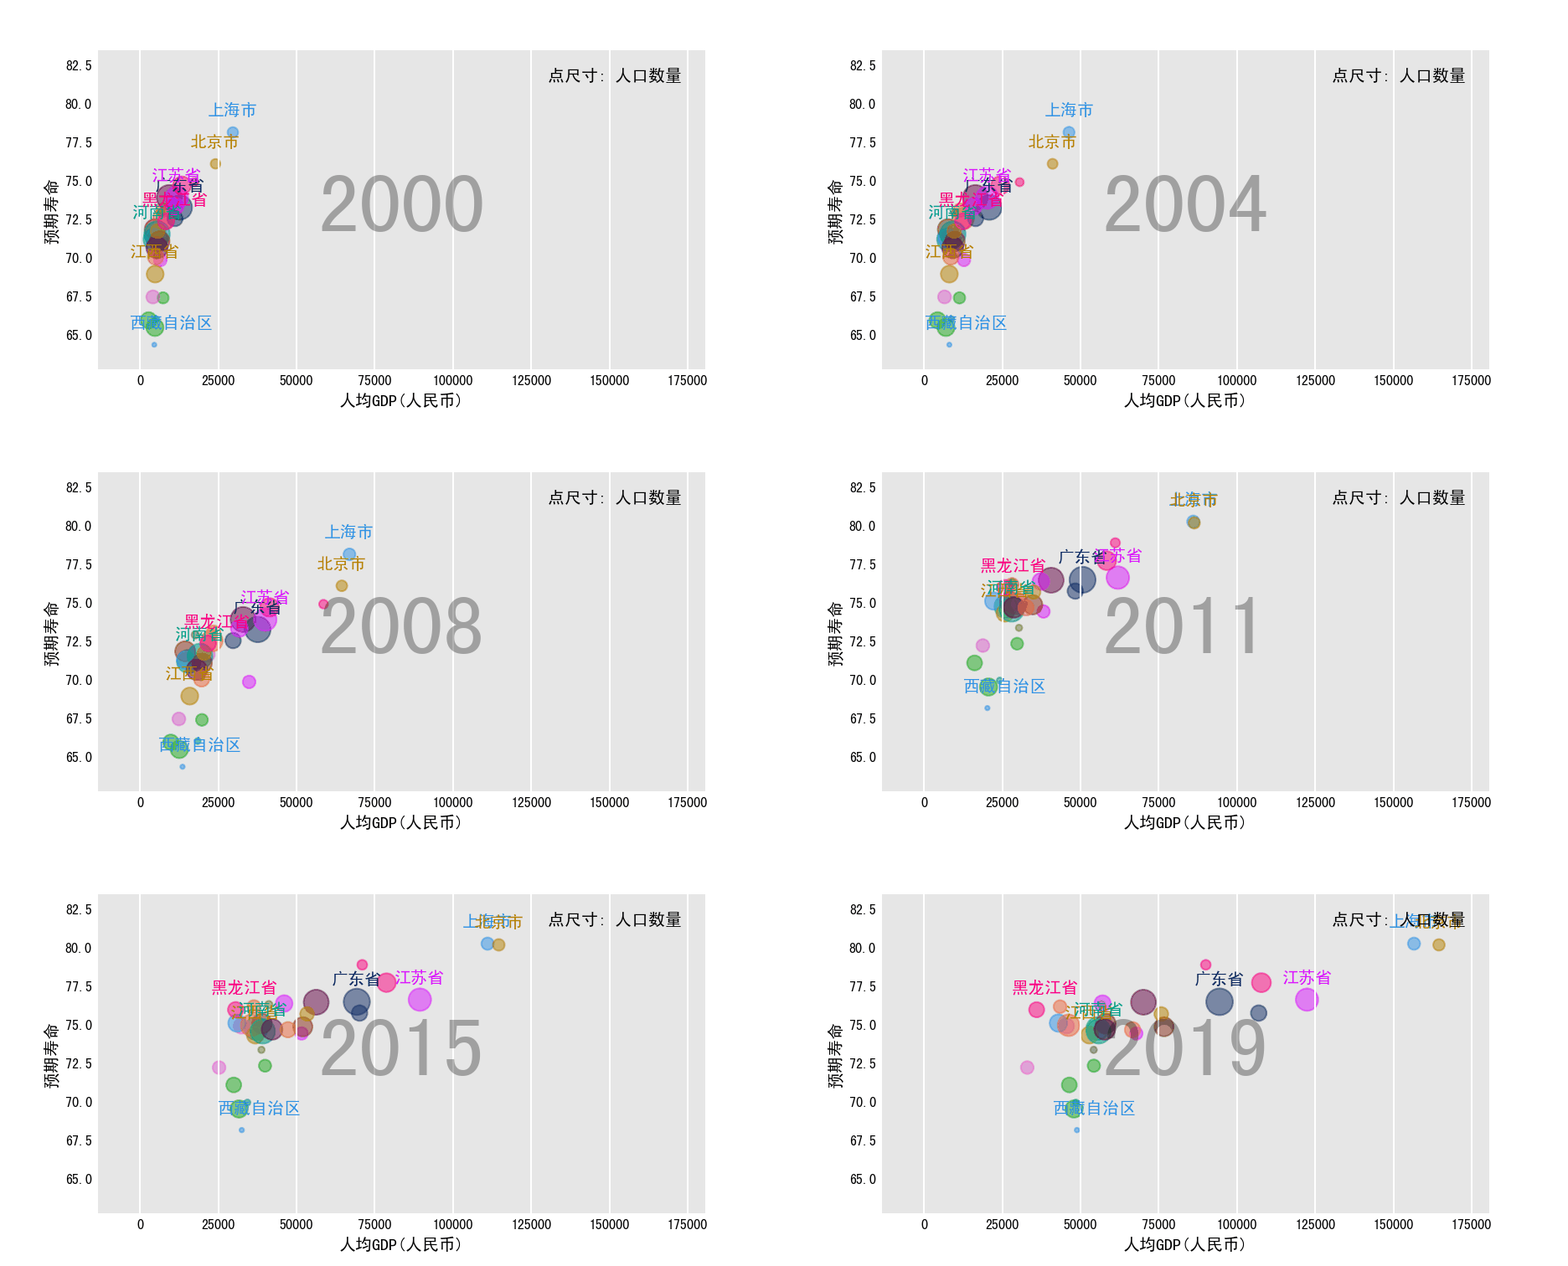
超动感,百行Python代码制作动态气泡图
先上图片:

再上视频:
最后上代码:
import numpy as np
import pandas as pd
from matplotlib import pyplot as plt
import matplotlib.animation as  animation

import imageio
import os
import cv2
from PIL import Image


plt.rcParams['animation.writer'] = 'html'
plt.rcParams['font.sans-serif'] = ['SimHei']
plt.rcParams['axes.unicode_minus'] = False

def html_to_gif(html_file, gif_file, duration=0.1):
    path = html_file.replace(".html","_frames")
    images = [os.path.join(path,x) for x in sorted(os.listdir(path))]
    frames = [imageio.imread(x) for x in images]
    imageio.mimsave(gif_file, frames, 'gif', duration=duration)
    return gif_file

cmap = [
'#2E91E5',
'#1CA71C',
'#DA16FF',
'#B68100',
'#EB663B',
'#00A08B',
'#FC0080',
'#6C7C32',
'#862A16',
'#620042',
'#DA60CA',
'#0D2A63']*100

dfx = pd.read_csv("./data/gdp_per_capita.csv")
dfx = dfx.set_index("year")
dfx.index = [str(x) for x in dfx.index]
dfx = dfx[sorted(dfx.columns)]

dfy = pd.read_csv("./data/life_expect.csv")
dfy = dfy.set_index("year")
dfy.index = [str(x) for x in dfy.index]
dfy = dfy[sorted(dfy.columns)]

dfz = pd.read_csv("./data/pop_amount.csv")
dfz = dfz.set_index("year")
dfz.index = [str(x) for x in dfz.index]
dfz = dfz[sorted(dfz.columns)]

def bubble_chart_race(dfx,dfy,dfz,title = "中国大陆各省市历年人均GDP和预期寿命变化",
                      filename = None,
                      figsize = (6.5,3.5),dpi = 144,
                      duration = 0.5,
                      xlabel = "人均GDP(人民币)",
                      ylabel = "预期寿命",
                      size_label = "点尺寸: 人口数量",
                      anotate_points = ["江西省","北京市","上海市","广东省",
                                        "河南省","江苏省","黑龙江省","西藏自治区"]):

    fig,ax = plt.subplots(figsize=figsize,dpi=dpi)

    ax.set_facecolor("0.9")
    ax.set_title(title,color = "black",fontsize = 12)

    # 调整spines
    ax.spines["top"].set_visible(False)
    ax.spines["right"].set_visible(False)
    ax.spines["left"].set_visible(False)
    ax.spines["bottom"].set_visible(False)

    def plot_frame(date):

        dfdata = pd.DataFrame()
        xdata = dfx.loc[date,:].sort_index()
        ydata = dfy.loc[date,:].sort_index()
        zdata = dfz.loc[date,:].sort_index()
        dfdata["x"] = xdata
        dfdata["y"] = ydata
        dfdata["z"] = zdata

        # 绘制散点图像

        ax.clear()
        ax.scatter(dfdata["x"],dfdata["y"],s = 100*dfdata["z"]/dfdata["z"].mean(),
               c = (cmap*100)[0:len(dfdata)],alpha = 0.5)


        # 添加图例文字
        for i,p in enumerate(dfdata.index):
            px,py,pz = dfdata.loc[p,["x","y","z"]].tolist()
            if p in anotate_points:
                ax.annotate(p,xy = (px,py),  xycoords = "data",
                    xytext = (-15,10),fontsize = 10,fontweight = "bold",color = cmap[i], textcoords = "offset points")

        ax.tick_params(bottom = False,left = False,labelsize = 8,direction = "in",length = 2)

        # 调整绘图范围
        xlim = (dfx.values.min(),dfx.values.max())
        ax.set_xlim(left = xlim[0]-(xlim[1]-xlim[0])/10,right = xlim[1]+(xlim[1]-xlim[0])/10)
        ylim = (dfy.values.min(),dfy.values.max())
        ax.set_ylim(bottom = ylim[0]-(ylim[1]-ylim[0])/10,top = ylim[1]+(ylim[1]-ylim[0])/5)


        # 添加辅助元素
        ax.text(0.5, 0.5, date, va="center", ha="center",alpha=0.3, size = 50,transform = ax.transAxes)
        ax.text(0.85, 0.92, size_label, ha="center",va="center", size = 10,transform = ax.transAxes)

        ax.grid(axis = "x",color="white",lw=1,ls = "-")
        ax.tick_params(bottom = False,left = False,labelsize = 8,direction = "in",length = 2)
        ax.set_xlabel(xlabel,fontsize = 10)
        ax.set_ylabel(ylabel,fontsize = 10)


    bubble_animation = animation.FuncAnimation(fig,plot_frame,frames = dfx.index ,interval = int(duration*1000))
    if filename is None:
        try:
            from IPython.display import HTML
            return HTML(bubble_animation.to_jshtml())
        except ImportError:
            pass
    else:
        bubble_animation.save(filename)
        return filename


html_file = "bubble_chart_race.html"
gif_file = html_file.replace(".html",".gif")
bubble_chart_race(dfx,dfy,dfz,filename = html_file,title = "中国大陆各省份历年人均GDP和预期寿命")

html_to_gif(html_file,gif_file,duration=1.0)
主要思路是构建plot_frame函数逐帧绘制图像,再用matplotlib的animation模块制作动画。
收工。😋
打码不易,喜欢本篇的小伙伴,或者需要完整代码和绘图数据集的同学,可以对本文点赞,在看,和分享后在公众号“算法美食屋”后台回复关键字:动态图,添加作者微信获取。
万水千山总是情,点个在看行不行。。。😋
评论
