Python时间序列分析全面指南(附代码)
作者:Selva Prabhakaran
翻译:陈超校对:王可汗
本文约7500字,建议阅读20+分钟
本文介绍了时间序列的定义、特征并结合实例给出了时间序列在Python中评价指标和方法。

内容
1. 什么是时间序列?
2. 如何在Python中导入时间序列?
3. 什么是面板数据?
4. 时间序列可视化
5. 时间序列的模式
6. 时间序列的加法和乘法
7. 如何将时间序列分解?
8. 平稳和非平稳时间序列
9. 如何获取平稳的时间序列?
10. 如何检验平稳性?
11. 白噪音和平稳序列的差异是什么?
12. 如何去除时间序列的线性分量?
13. 如何消除时间序列的季节性?
14. 如何检验时间序列的季节性?
15. 如何处理时间序列中的缺失值?
16. 什么是自回归和偏自回归函数?
17. 如何计算偏自回归函数?
18. 滞后图
19. 如何估计时间序列的预测能力?
20. 为什么以及怎样使时间序列平滑?
21. 如何使用Granger因果检验来获知时间序列是否对预测另一个序列帮助?
22. 下一步是什么?
1. 什么是时间序列?时间序列是在规律性时间间隔记录的观测值序列。
依赖于观测值的频率,典型的时间序列可分为每小时、每天、每周、每月、每季度和每年为单位记录。有时,你可能也会用到以秒或者分钟为单位的时间序列,比如,每分钟用户点击量和访问量等等。
1.1 为什么要分析时间序列呢?
因为它是你做序列预测前的一步准备过程。而且,时间序列预测拥有巨大的商业重要性,因为对商业来说非常重要的需求和销量、网站访问人数、股价等都是时间序列数据。
1.2 所以时间序列分析包括什么内容呢?
时间序列分析包括理解序列内在本质的多个方面以便于你可更好地了解如何做出有意义并且精确的预测。
2. 如何在Python中导入时间序列?
让我们用pandas包里的read.csv()读取时间序列数据(一个澳大利亚药品销售的csv文件)作为一个pandas数据框。加入parse_dates=[‘date’]参数将会把日期列解析为日期字段。
        from dateutil.parser import parse


        import matplotlib as mpl


        import matplotlib.pyplot as plt


        import seaborn as sns


        import numpy as np


        import pandas as pd


        plt.rcParams.update({'figure.figsize': (10, 7), 'figure.dpi': 120})


        # Import as Dataframe


        df = pd.read_csv('https://raw.githubusercontent.com/selva86/datasets/master/a10.csv', parse_dates=['date'])


        df.head()
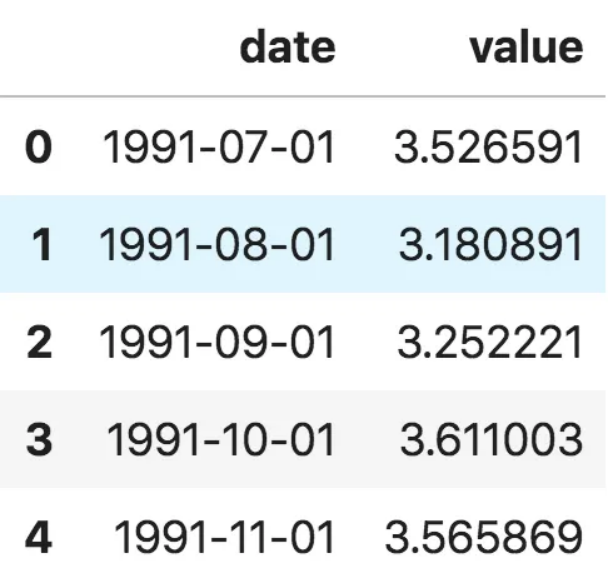
此外,你也可以将其导入为date作为索引的pandas序列。你只需要固定pd.read_csv()里的index_col参数。
        ser = pd.read_csv('https://raw.githubusercontent.com/selva86/datasets/master/a10.csv', parse_dates=['date'], index_col='date')


        ser.head()
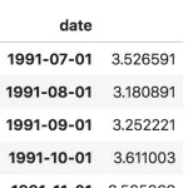
注意,在此序列当中,‘value’列的位置高于date以表明它是一个序列。
3. 什么是面板数据?
面板数据也是基于时间的数据集。
差异在于,除了时间序列,它也包括同时测量的一个或多个相关变量。
通常来看,面板数据当中的列包括了有助于预测Y的解释型变量,假设这些列将在未来预测阶段有用。
面板数据的例子如下:
        # dataset source: https://github.com/rouseguy


        df = pd.read_csv('https://raw.githubusercontent.com/selva86/datasets/master/MarketArrivals.csv')


        df = df.loc[df.market=='MUMBAI', :]


        df.head()

4. 时间序列可视化
        # Time series data source: fpp pacakge in R.


        import matplotlib.pyplot as plt


        df = pd.read_csv('https://raw.githubusercontent.com/selva86/datasets/master/a10.csv', parse_dates=['date'], index_col='date')


        # Draw Plot


        def plot_df(df, x, y, title="", xlabel='Date', ylabel='Value', dpi=100):


            plt.figure(figsize=(16,5), dpi=dpi)


            plt.plot(x, y, color='tab:red')


            plt.gca().set(title=title, xlabel=xlabel, ylabel=ylabel)


            plt.show()


        plot_df(df, x=df.index, y=df.value, title='Monthly anti-diabetic drug sales in  Australia from 1992 to 2008.')
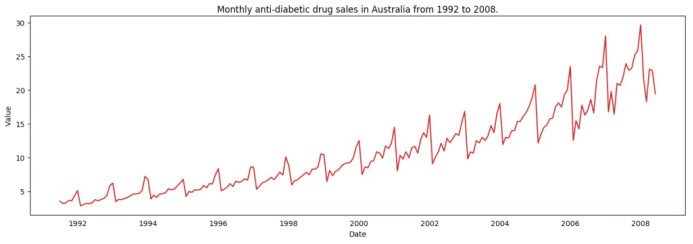 时间序列可视化
          # Import data


        df = pd.read_csv('datasets/AirPassengers.csv', parse_dates=['date'])


        x = df['date'].values


        y1 = df['value'].values


          # Plot


        fig, ax = plt.subplots(1, 1, figsize=(16,5), dpi= 120)


        plt.fill_between(x, y1=y1, y2=-y1, alpha=0.5, linewidth=2, color='seagreen')


        plt.ylim(-800, 800)


        plt.title('Air Passengers (Two Side View)', fontsize=16)


        plt.hlines(y=0, xmin=np.min(df.date), xmax=np.max(df.date), linewidth=.5)


        plt.show()
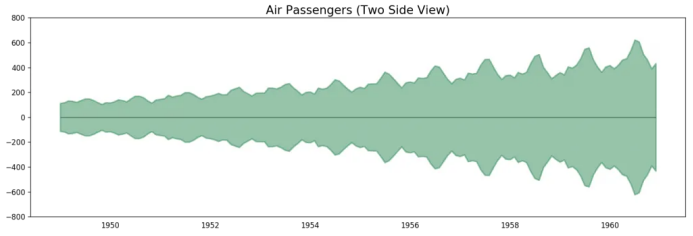
因为这是一个月度时间序列,每年遵循特定的重复模式,你可以把每年作为一个单独的线画在同一张图上。这可以让你同时比较不同年份的模式。
4.1 时间序列的季节图
        # Import Data


        df = pd.read_csv('https://raw.githubusercontent.com/selva86/datasets/master/a10.csv', parse_dates=['date'], index_col='date')


        df.reset_index(inplace=True)


        # Prepare data


        df['year'] = [d.year for d in df.date]


        df['month'] = [d.strftime('%b') for d in df.date]


        years = df['year'].unique()


        # Prep Colors


        np.random.seed(100)


        mycolors = np.random.choice(list(mpl.colors.XKCD_COLORS.keys()), len(years), replace=False)


        # Draw Plot


        plt.figure(figsize=(16,12), dpi= 80)


        for i, y in enumerate(years):


            if i > 0:


                plt.plot('month', 'value', data=df.loc[df.year==y, :], color=mycolors[i], label=y)


                plt.text(df.loc[df.year==y, :].shape[0]-.9, df.loc[df.year==y, 'value'][-1:].values[0], y, fontsize=12, color=mycolors[i])


        # Decoration


        plt.gca().set(xlim=(-0.3, 11), ylim=(2, 30), ylabel='$Drug Sales$', xlabel='$Month$')


        plt.yticks(fontsize=12, alpha=.7)


        plt.title("Seasonal Plot of Drug Sales Time Series", fontsize=20)


        plt.show()
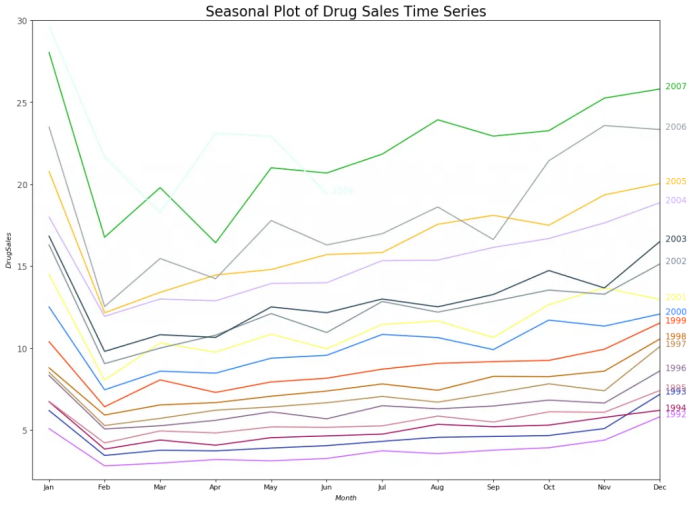
每年二月会迎来药品销售的急速下降,而在三月会再度上升,接下来的4月又开始下降,以此类推。很明显,该模式在特定的某一年中重复,且年年如此。
然而,随着年份推移,药品销售整体增加。你可以很好地看到该趋势并且在年份箱线图当中看到它是怎样变化的。同样地,你也可以做一个月份箱线图来可视化月度分布情况。
4.2 月度(季节性)箱线图和年度(趋势)分布
你可以季节间隔将数据分组,并看看在给定的年份或月份当中值是如何分布的,以及随时间推移它们是如何比较的。
        # Import Data


        df = pd.read_csv('https://raw.githubusercontent.com/selva86/datasets/master/a10.csv', parse_dates=['date'], index_col='date')


        df.reset_index(inplace=True)


        # Prepare data


        df['year'] = [d.year for d in df.date]


        df['month'] = [d.strftime('%b') for d in df.date]


        years = df['year'].unique()


        # Draw Plot


        fig, axes = plt.subplots(1, 2, figsize=(20,7), dpi= 80)


        sns.boxplot(x='year', y='value', data=df, ax=axes[0])


        sns.boxplot(x='month', y='value', data=df.loc[~df.year.isin([1991, 2008]), :])


        # Set Title


        axes[0].set_title('Year-wise Box Plot\n(The Trend)', fontsize=18);


        axes[1].set_title('Month-wise Box Plot\n(The Seasonality)', fontsize=18)


        plt.show()
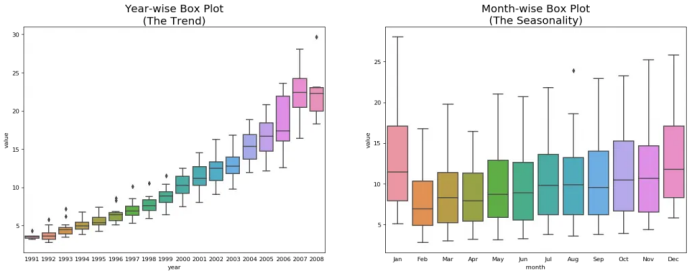
箱线图将年度和月度分布变得很清晰。并且,在阅读箱线图当中,12月和1月明显有更高的药品销售量,可被归因于假期折扣季。
到目前为止,我们已经看到了识别模式的相似之处。现在怎样才能从通常模式当中找到离群值呢?
5. 时间序列的模式
当在时间序列当中观测到增加或降低的斜率时,即可观测到相应的趋势。然而季节性只有在由于季节性因素导致不同的重复模式在规律性的间隔之间被观测到时才能发现。可能是由于当年的特定月份,特定月份的某一天、工作日或者甚至是当天某个时间。
然而,并不是所有时间序列必须有一个趋势和/或季节性。时间序列可能没有不同的趋势但是有一个季节性。反之亦然。
所以时间序列可以被看做是趋势、季节性和误差项的整合。
        fig, axes = plt.subplots(1,3, figsize=(20,4), dpi=100)


        pd.read_csv('https://raw.githubusercontent.com/selva86/datasets/master/guinearice.csv', parse_dates=['date'], index_col='date').plot(title='Trend Only', legend=False, ax=axes[0])


        pd.read_csv('https://raw.githubusercontent.com/selva86/datasets/master/sunspotarea.csv', parse_dates=['date'], index_col='date').plot(title='Seasonality Only', legend=False, ax=axes[1])


        pd.read_csv('https://raw.githubusercontent.com/selva86/datasets/master/AirPassengers.csv', parse_dates=['date'], index_col='date').plot(title='Trend and Seasonality', legend=False, ax=axes[2])

另一个需要考虑的方面是循环的行为。当序列当中上升和下降模式并不在固定的日历间隔出现时,就会出现循环的行为。需注意不要混淆循环的效应和季节的效应。
所以,怎样区分循环的和季节性的模式呢?
如果模式不是基于固定的日历频率,那它就是循环的。因为,循环效应不像季节性那样受到商业和其他社会经济因素的影响。
6. 时间序列的加法和乘法
加法时间序列: 值=基线水平+趋势+季节性+误差
乘法时间序列: 值=基线水平*趋势*季节性*误差
7. 怎样分解时间序列的成分?
statsmodels包里的seasonal_decompose使用起来非常方便。
        from statsmodels.tsa.seasonal import seasonal_decompose


        from dateutil.parser import parse


        # Import Data


        df = pd.read_csv('https://raw.githubusercontent.com/selva86/datasets/master/a10.csv', parse_dates=['date'], index_col='date')


        # Multiplicative Decomposition


        result_mul = seasonal_decompose(df['value'], model='multiplicative', extrapolate_trend='freq')


        # Additive Decomposition


        result_add = seasonal_decompose(df['value'], model='additive', extrapolate_trend='freq')


        # Plot


        plt.rcParams.update({'figure.figsize': (10,10)})


        result_mul.plot().suptitle('Multiplicative Decompose', fontsize=22)


        result_add.plot().suptitle('Additive Decompose', fontsize=22)


        plt.show()
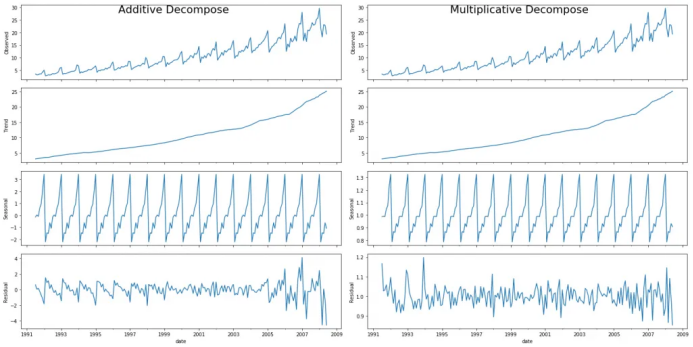
在序列开始时,设置extrapolate_trend='freq' 来注意趋势和残差中缺失的任何值。
如果你仔细看加法分解当中的残差,它有一些遗留模式。乘法分解看起来非常随意,这很好。所以理想状况下,乘法分解应该在这种特定的序列当中优先选择。
趋势,季节性和残差成分的数值输出被存储在result_mul 当中。让我们提取它们并导入数据框中。
        # Extract the Components ----


        # Actual Values = Product of (Seasonal * Trend * Resid)


        df_reconstructed = pd.concat([result_mul.seasonal, result_mul.trend, result_mul.resid, result_mul.observed], axis=1)


        df_reconstructed.columns = ['seas', 'trend', 'resid', 'actual_values']


        df_reconstructed.head()
如果你检查一下seas, trend 和 resid列的乘积,应该确实等于actual_values。
8. 平稳和非平稳时间序列
也就是说,这种序列的统计属性例如均值,方差和自相关是随时间不变的常数。序列的自相关只是与前置值的相关,之后会详细介绍。
平稳时间序列也没有季节效应。
所以如何识别一个序列是否平稳呢?让我们通过实例来展示一下:
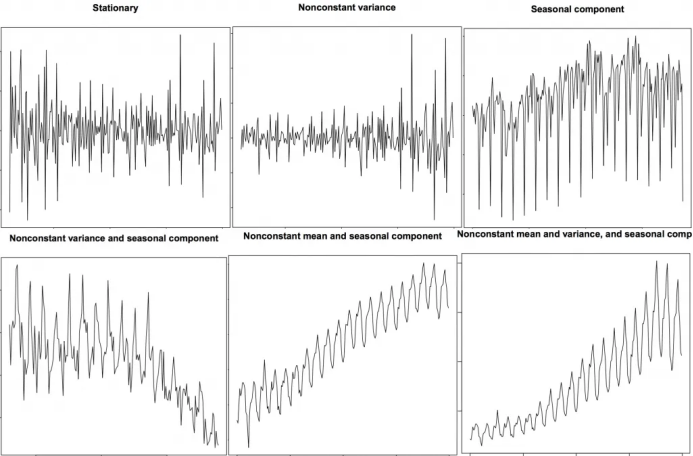
上图来自R语言的 TSTutorial。
所以为什么平稳序列是重要的呢?为什么我要提到它?
我将展开讲一下,但是要理解它只是有可能通过使用特定的转换方法实现任何时间序列的平稳化。大多数统计预测方法都用于平稳时间序列。预测的第一步通常是做一些转换将非平稳数据转化为平稳数据。
9. 如何获取平稳的时间序列?
1. 差分序列(一次或多次); 2. 对序列值进行log转换; 3. 对序列值去n次根式值; 4. 结合上述方法。
实现数据平稳化最常见也最方便的方法是对序列进行差分至少一次,直到它变得差不多平稳为止。
9.1 所以什么是差分?
如果Y_t是t时刻的Y值,那么第一次差分Y = Yt – Yt-1。在简化的格式当中,差分序列就是从当前值中减去下一个值。
如果第一次差分不能使数据平稳,你可以第二次差分,以此类推。
例如,考虑如下序列: [1, 5, 2, 12, 20]
一次差分: [5-1, 2-5, 12-2, 20-12] = [4, -3, 10, 8] 二次差分: [-3-4, -10-3, 8-10] = [-7, -13, -2]
9.2 为什么要在预测之前将非平稳数据平稳化?
一个重要的原因是自回归预测模型必须是利用序列自身的滞后量作为预测变量的线性回归模型。
我们知道线性回归在预测变量(X变量)与其他变量不相关时效果最佳。所以序列平稳化也因为移除所有持续的自相关而解决了这个问题,因此使得模型中的预测变量(序列的滞后值)几乎独立。
现在我们已经建立了序列平稳化非常重要的概念,那怎样检验给定序列是否平稳化呢?
10. 怎样检验平稳性?
另外一种方法是将序列分成2或多个连续的部分,计算概要统计量例如均值,方差和自相关。如果统计量显著差异,序列可能不是平稳的。
尽管如此,你需要一个方法来从量化的角度判断一个给定序列是否平稳。可以通过‘Unit Root Tests单位根检验’来实现。这里有多种变式,但这些检验都是用来检测时间序列是否非平稳并且拥有一个单位根。
有多种单位根检验的具体应用:
1. 增广迪基·富勒检验(ADF Test); 2. 科维亚特夫斯基-菲利普斯-施密特-辛-KPSS检验(趋势平稳性); 3. 菲利普斯 佩龙检验(PP Test)。
最常用的是ADF检验,零假设是时间序列只有一个单位根并且非平稳。所以ADF检验p值小于0.05的显著性水平,你拒绝零假设。
KPSS检验,另一方面,用于检验趋势平稳性。零假设和p值解释与ADH检验相反。下面的代码使用了python中的statsmodels包来做这两种检验。
        from statsmodels.tsa.stattools import adfuller, kpss


        df = pd.read_csv('https://raw.githubusercontent.com/selva86/datasets/master/a10.csv', parse_dates=['date'])


        # ADF Test


        result = adfuller(df.value.values, autolag='AIC')


        print(f'ADF Statistic: {result[0]}')


        print(f'p-value: {result[1]}')


        for key, value in result[4].items():


            print('Critial Values:')


            print(f'   {key}, {value}')


        # KPSS Test


        result = kpss(df.value.values, regression='c')


        print('\nKPSS Statistic: %f' % result[0])


        print('p-value: %f' % result[1])


        for key, value in result[3].items():


            print('Critial Values:')


            print(f'   {key}, {value}')


        ADF Statistic: 3.14518568930674


        p-value: 1.0


        Critial Values:


           1%, -3.465620397124192


        Critial Values:


           5%, -2.8770397560752436


        Critial Values:


           10%, -2.5750324547306476


        KPSS Statistic: 1.313675


        p-value: 0.010000


        Critial Values:


           10%, 0.347


        Critial Values:


           5%, 0.463


        Critial Values:


           2.5%, 0.574


        Critial Values:


           1%, 0.739
11. 白噪音和平稳序列的差异是什么?
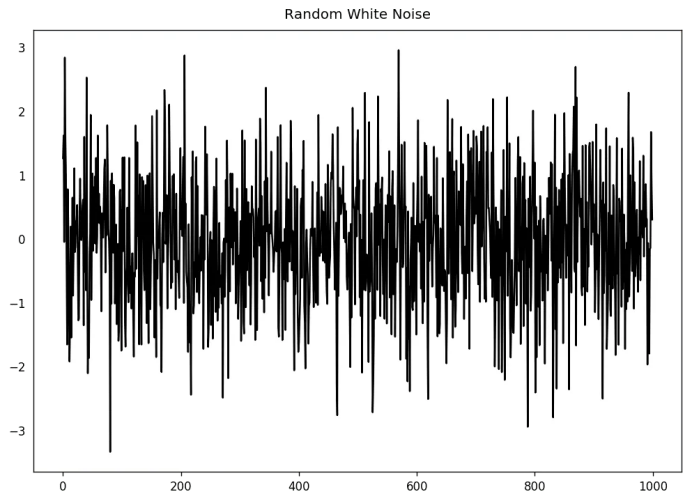
无论怎样,在白噪音当中是没有特定模式的。如果你将FM广播的声音信号作为时间序列,你在频道之间的频段听到的空白声就是白噪音。
从数学上来看,均值为0的完全随机的数字序列是白噪音。
        randvals = np.random.randn(1000)


        pd.Series(randvals).plot(title='Random White Noise', color='k')
12. 怎样将时间序列去趋势化?
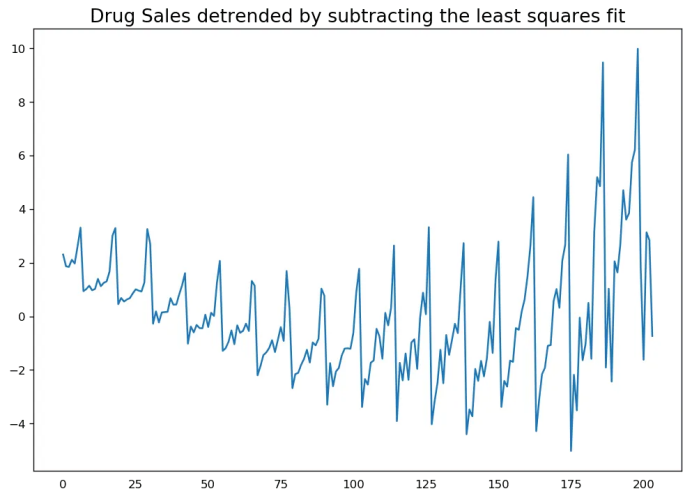
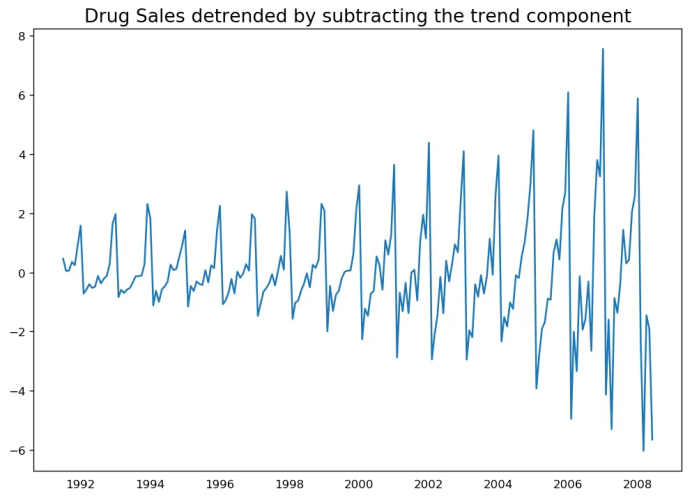
1. 从时间序列当中减去最优拟合线。最佳拟合线可从以时间步长为预测变量获得的线性回归模型当中获得。对更复杂的模型,你可以使用模型中的二次项(x^2); 2. 从我们之前提过的时间序列分解当中减掉趋势成分; 3. 减去均值; 4. 应用像Baxter-King过滤器(statsmodels.tsa.filters.bkfilter)或者Hodrick-Prescott 过滤器 (statsmodels.tsa.filters.hpfilter)来去除移动的平均趋势线或者循环成分。
让我们来用一下前两种方法。
        # Using scipy: Subtract the line of best fit


        from scipy import signal


        df = pd.read_csv('https://raw.githubusercontent.com/selva86/datasets/master/a10.csv', parse_dates=['date'])


        detrended = signal.detrend(df.value.values)


        plt.plot(detrended)


        plt.title('Drug Sales detrended by subtracting the least squares fit', fontsize=16)
          # Using statmodels: Subtracting the Trend Component.


        from statsmodels.tsa.seasonal import seasonal_decompose


        df = pd.read_csv('https://raw.githubusercontent.com/selva86/datasets/master/a10.csv', parse_dates=['date'], index_col='date')


        result_mul = seasonal_decompose(df['value'], model='multiplicative', extrapolate_trend='freq')


        detrended = df.value.values - result_mul.trend


        plt.plot(detrended)


        plt.title('Drug Sales detrended by subtracting the trend component', fontsize=16)
13. 怎样对时间序列去季节化?
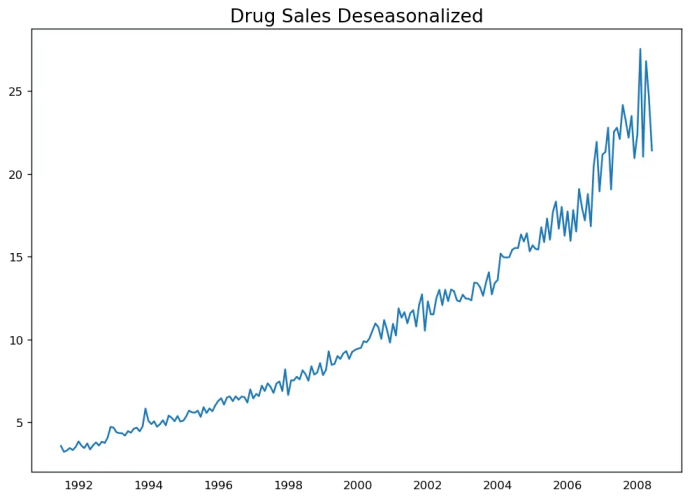
1. 取一个以长度为季节窗口的移动平均线。这将在这个过程中使序列变得平滑; 2. 序列季节性差分(从当前值当中减去前一季节的值); 3. 将序列值除以从STL分解当中获得的季节性指数。
如果除以季节性指数后仍没办法得到良好的结果,再试一下序列对数转换然后再做。你之后可以通过去指数恢复到原始尺度。
        # Subtracting the Trend Component.


        df = pd.read_csv('https://raw.githubusercontent.com/selva86/datasets/master/a10.csv', parse_dates=['date'], index_col='date')


        # Time Series Decomposition


        result_mul = seasonal_decompose(df['value'], model='multiplicative', extrapolate_trend='freq')


        # Deseasonalize


        deseasonalized = df.value.values / result_mul.seasonal


        # Plot


        plt.plot(deseasonalized)


        plt.title('Drug Sales Deseasonalized', fontsize=16)


        plt.plot()
14. 怎样检验时间序列的季节性?
1. 一天的每个小时; 2. 一月的每天; 3. 每周; 4. 每月; 5. 每年。
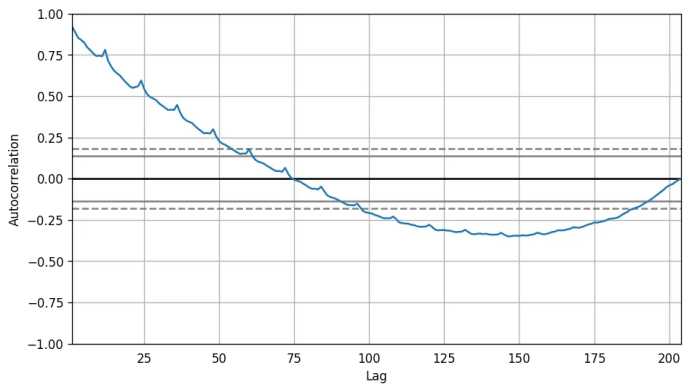
然而,如果你想要一个更权威的季节性检验,使用自回归函数(ACF)图。更多关于自回归的信息将在下一部分介绍。但是当强季节性模式出现时,ACF图通常揭示了在季节窗的倍数处明显的重复峰值。
例如,药品销售时间序列是每年都有重复模式的一个月度序列。所以,你可以看到第12,24和36条线等的峰值。
我必须警告你在现实世界的数据集当中,这样强的模式很难见到,并且有可能被各种噪音所扭曲,所以你需要一双仔细的眼睛来捕获这些模式。
from pandas.plotting import autocorrelation_plot
df = pd.read_csv('https://raw.githubusercontent.com/selva86/datasets/master/a10.csv')
plt.rcParams.update({'figure.figsize':(9,5), 'figure.dpi':120})
autocorrelation_plot(df.value.tolist())
除此之外,如果你想做统计检验,CHT检验可以检验季节性差异是否对序列平稳化有必要。
15. 如何处理时间序列当中的缺失值?
其次,当处理时间序列时,你通常不应该用序列均值来替代缺失值,尤其是序列非平稳的时候,一个快捷粗略的处理方法来说你应该做的是向前填充之前的值。
然而,依赖于序列的本质,你想要在得出结论之前尝试多种方法。有效的缺失值处理方法有:
-
向后填充;
-
线性内插;
-
二次内插;
-
最邻近平均值;
-
对应季节的平均值。
为了衡量缺失值的表现,我在时间序列当中手动引入缺失值,使用上述方法处理并衡量处理值和真实值之间的均方误差。
        # # Generate dataset


        from scipy.interpolate import interp1d


        from sklearn.metrics import mean_squared_error


        df_orig = pd.read_csv('https://raw.githubusercontent.com/selva86/datasets/master/a10.csv', parse_dates=['date'], index_col='date').head(100)


        df = pd.read_csv('datasets/a10_missings.csv', parse_dates=['date'], index_col='date')


        fig, axes = plt.subplots(7, 1, sharex=True, figsize=(10, 12))


        plt.rcParams.update({'xtick.bottom' : False})


        ## 1. Actual -------------------------------


        df_orig.plot(title='Actual', ax=axes[0], label='Actual', color='red', style=".-")


        df.plot(title='Actual', ax=axes[0], label='Actual', color='green', style=".-")


        axes[0].legend(["Missing Data", "Available Data"])


        ## 2. Forward Fill --------------------------


        df_ffill = df.ffill()


        error = np.round(mean_squared_error(df_orig['value'], df_ffill['value']), 2)


        df_ffill['value'].plot(title='Forward Fill (MSE: ' + str(error) +")", ax=axes[1], label='Forward Fill', style=".-")


        ## 3. Backward Fill -------------------------


        df_bfill = df.bfill()


        error = np.round(mean_squared_error(df_orig['value'], df_bfill['value']), 2)


        df_bfill['value'].plot(title="Backward Fill (MSE: " + str(error) +")", ax=axes[2], label='Back Fill', color='firebrick', style=".-")


        ## 4. Linear Interpolation ------------------


        df['rownum'] = np.arange(df.shape[0])


        df_nona = df.dropna(subset = ['value'])


        f = interp1d(df_nona['rownum'], df_nona['value'])


        df['linear_fill'] = f(df['rownum'])


        error = np.round(mean_squared_error(df_orig['value'], df['linear_fill']), 2)


        df['linear_fill'].plot(title="Linear Fill (MSE: " + str(error) +")", ax=axes[3], label='Cubic Fill', color='brown', style=".-")


        ## 5. Cubic Interpolation --------------------


        f2 = interp1d(df_nona['rownum'], df_nona['value'], kind='cubic')


        df['cubic_fill'] = f2(df['rownum'])


        error = np.round(mean_squared_error(df_orig['value'], df['cubic_fill']), 2)


        df['cubic_fill'].plot(title="Cubic Fill (MSE: " + str(error) +")", ax=axes[4], label='Cubic Fill', color='red', style=".-")


        # Interpolation References:


        # https://docs.scipy.org/doc/scipy/reference/tutorial/interpolate.html


        # https://docs.scipy.org/doc/scipy/reference/interpolate.html


        ## 6. Mean of 'n' Nearest Past Neighbors ------


        def knn_mean(ts, n):


            out = np.copy(ts)


            for i, val in enumerate(ts):


                if np.isnan(val):


                    n_by_2 = np.ceil(n/2)


                    lower = np.max([0, int(i-n_by_2)])


                    upper = np.min([len(ts)+1, int(i+n_by_2)])


                    ts_near = np.concatenate([ts[lower:i], ts[i:upper]])


                    out[i] = np.nanmean(ts_near)


            return out


        df['knn_mean'] = knn_mean(df.value.values, 8)


        error = np.round(mean_squared_error(df_orig['value'], df['knn_mean']), 2)


        df['knn_mean'].plot(title="KNN Mean (MSE: " + str(error) +")", ax=axes[5], label='KNN Mean', color='tomato', alpha=0.5, style=".-")


        ## 7. Seasonal Mean ----------------------------


        def seasonal_mean(ts, n, lr=0.7):


            """


            Compute the mean of corresponding seasonal periods


            ts: 1D array-like of the time series


            n: Seasonal window length of the time series


            """


            out = np.copy(ts)


            for i, val in enumerate(ts):


                if np.isnan(val):


                    ts_seas = ts[i-1::-n]  # previous seasons only


                    if np.isnan(np.nanmean(ts_seas)):


                        ts_seas = np.concatenate([ts[i-1::-n], ts[i::n]])  # previous and forward


                    out[i] = np.nanmean(ts_seas) * lr


            return out


        df['seasonal_mean'] = seasonal_mean(df.value, n=12, lr=1.25)


        error = np.round(mean_squared_error(df_orig['value'], df['seasonal_mean']), 2)


        df['seasonal_mean'].plot(title="Seasonal Mean (MSE: " + str(error) +")", ax=axes[6], label='Seasonal Mean', color='blue', alpha=0.5, style=".-")
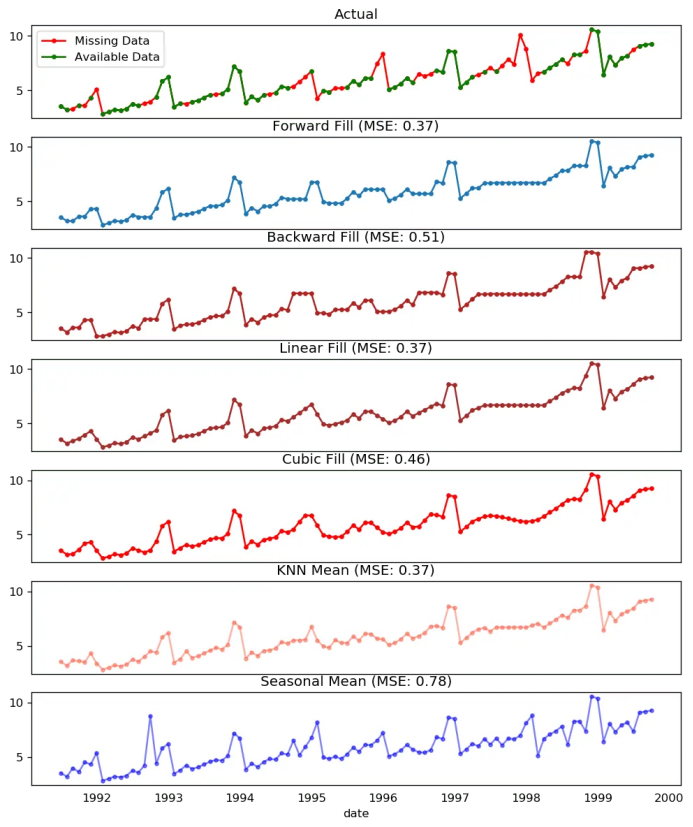 缺失值处理
缺失值处理
1. 如果你有解释变量,可以使用像随机森林或k-邻近算法的预测模型来预测它。 2. 如果你有足够多的过去观测值,可以预测缺失值。 3. 如果你有足够的未来观测值,回测缺失值。 4. 从之前的周期预测相对应的部分。
16. 什么是自相关和偏自相关函数?
偏自相关也会传递相似的信息但是它传递的是序列和它滞后量的纯粹相关,排除了其他中间滞后量对相关的贡献。
from statsmodels.tsa.stattools import acf, pacf
from statsmodels.graphics.tsaplots import plot_acf, plot_pacf
df = pd.read_csv('https://raw.githubusercontent.com/selva86/datasets/master/a10.csv')
fig, axes = plt.subplots(1,2,figsize=(16,3), dpi= 100)
plot_acf(df.value.tolist(), lags=50, ax=axes[0])
plot_pacf(df.value.tolist(), lags=50, ax=axes[1])

17. 怎样计算偏自相关函数?
序列滞后量(k)的偏自相关是Y的自回归方程中滞后量的系数。Y的自回归方程就是Y及其滞后量作为预测项的线性回归。
For Example, if Y_t is the current series and Y_t-1 is the lag 1 of Y, then the partial autocorrelation of lag 3 (Y_t-3) is the coefficient $\alpha_3$ of Y_t-3 in the following equation: 例如,如果Y_t是当前的序列,Y_t-1是Y的滞后量1,那么滞后量3(Y_t-3)的偏自相关就是下面方程中Y_t-3的系数
 :
:

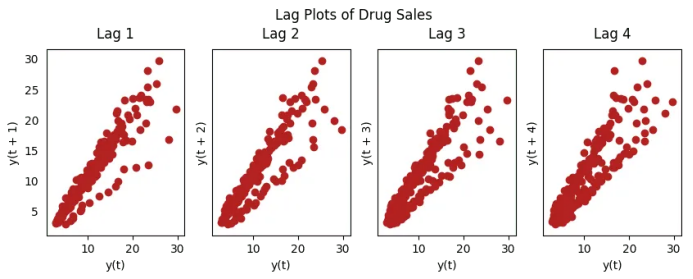
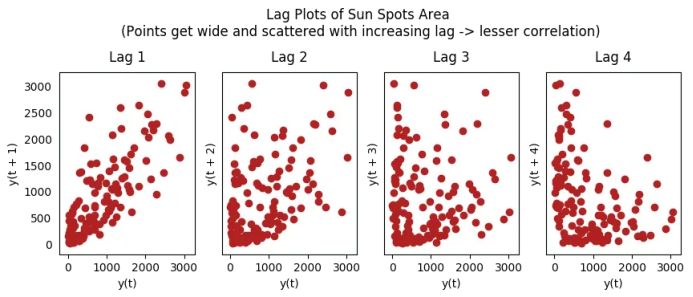
18. 滞后图
在下面太阳黑子面积时间序列的例子当中,随着n_lag增加,图越来越分散。
        from pandas.plotting import lag_plot


        plt.rcParams.update({'ytick.left' : False, 'axes.titlepad':10})


        # Import


        ss = pd.read_csv('https://raw.githubusercontent.com/selva86/datasets/master/sunspotarea.csv')


        a10 = pd.read_csv('https://raw.githubusercontent.com/selva86/datasets/master/a10.csv')


        # Plot


        fig, axes = plt.subplots(1, 4, figsize=(10,3), sharex=True, sharey=True, dpi=100)


        for i, ax in enumerate(axes.flatten()[:4]):


            lag_plot(ss.value, lag=i+1, ax=ax, c='firebrick')


            ax.set_title('Lag ' + str(i+1))


        fig.suptitle('Lag Plots of Sun Spots Area \n(Points get wide and scattered with increasing lag -> lesser correlation)\n', y=1.15)


        fig, axes = plt.subplots(1, 4, figsize=(10,3), sharex=True, sharey=True, dpi=100)


        for i, ax in enumerate(axes.flatten()[:4]):


            lag_plot(a10.value, lag=i+1, ax=ax, c='firebrick')


            ax.set_title('Lag ' + str(i+1))


        fig.suptitle('Lag Plots of Drug Sales', y=1.05)


        plt.show()
19. 怎样估计时间序列的预测能力?
近似熵越高,预测越难。另一个更好的选项是“样本熵”。
样本熵类似与近似熵,但是在估计小时间序列的复杂性上结果更一致。例如,较少样本点的随机时间序列 “近似熵”可能比一个更规律的时间序列更低,然而更长的时间序列可能会有一个更高的“近似熵”。
样本熵可以很好地处理这个问题。请看如下演示:
        # https://en.wikipedia.org/wiki/Approximate_entropy


        ss = pd.read_csv('https://raw.githubusercontent.com/selva86/datasets/master/sunspotarea.csv')


        a10 = pd.read_csv('https://raw.githubusercontent.com/selva86/datasets/master/a10.csv')


        rand_small = np.random.randint(0, 100, size=36)


        rand_big = np.random.randint(0, 100, size=136)


        def ApEn(U, m, r):


            """Compute Aproximate entropy"""


            def _maxdist(x_i, x_j):


                return max([abs(ua - va) for ua, va in zip(x_i, x_j)])


            def _phi(m):


                x = [[U[j] for j in range(i, i + m - 1 + 1)] for i in range(N - m + 1)]


                C = [len([1 for x_j in x if _maxdist(x_i, x_j) <= r]) / (N - m + 1.0) for x_i in x]


                return (N - m + 1.0)**(-1) * sum(np.log(C))


            N = len(U)


            return abs(_phi(m+1) - _phi(m))


        print(ApEn(ss.value, m=2, r=0.2*np.std(ss.value)))     # 0.651


        print(ApEn(a10.value, m=2, r=0.2*np.std(a10.value)))   # 0.537


        print(ApEn(rand_small, m=2, r=0.2*np.std(rand_small))) # 0.143


        print(ApEn(rand_big, m=2, r=0.2*np.std(rand_big)))     # 0.716


        0.6514704970333534


        0.5374775224973489


        0.0898376940798844


        0.7369242960384561


        # https://en.wikipedia.org/wiki/Sample_entropy


        def SampEn(U, m, r):


            """Compute Sample entropy"""


            def _maxdist(x_i, x_j):


                return max([abs(ua - va) for ua, va in zip(x_i, x_j)])


            def _phi(m):


                x = [[U[j] for j in range(i, i + m - 1 + 1)] for i in range(N - m + 1)]


                C = [len([1 for j in range(len(x)) if i != j and _maxdist(x[i], x[j]) <= r]) for i in range(len(x))]


                return sum(C)


            N = len(U)


            return -np.log(_phi(m+1) / _phi(m))


        print(SampEn(ss.value, m=2, r=0.2*np.std(ss.value)))      # 0.78


        print(SampEn(a10.value, m=2, r=0.2*np.std(a10.value)))    # 0.41


        print(SampEn(rand_small, m=2, r=0.2*np.std(rand_small)))  # 1.79


        print(SampEn(rand_big, m=2, r=0.2*np.std(rand_big)))      # 2.42


        0.7853311366380039


        0.41887013457621214


        inf


        2.181224235989778


        del sys.path[0]
20. 为何要以及怎样对时间序列进行平滑处理?
-
在信号当中减小噪声的影响从而得到一个经过噪声滤波的序列近似。
-
平滑版的序列可用于解释原始序列本身的特征。
-
趋势更好地可视化。
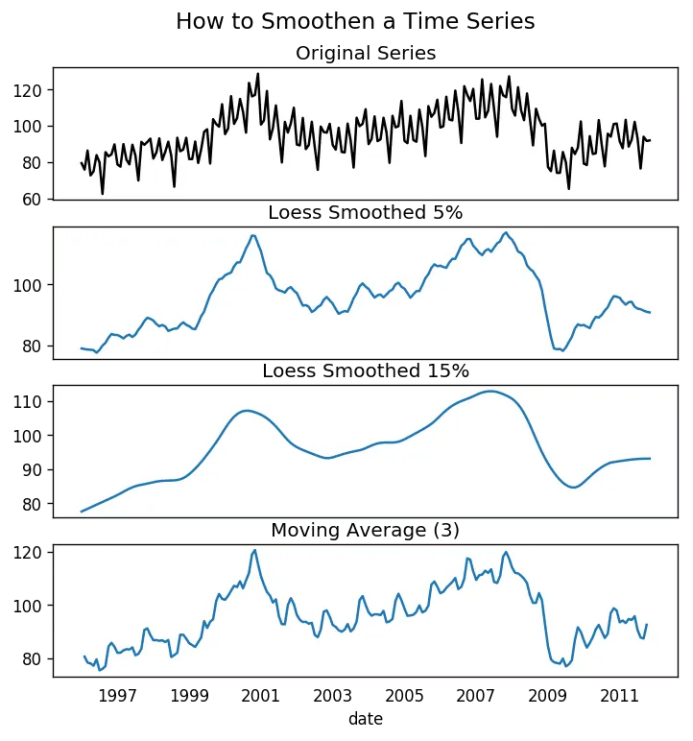
怎样对序列平滑处理? 让我们讨论一下以下方法:
1. 使用移动平均; 2. 做LOESS光滑(局部回归); 3. 做LOWESS光滑(局部加权回归)。
移动均值就是定义宽度的滚动窗口的均值。但是你必须明智地选择窗口宽度,因为大范围窗口可能会造成序列过度平滑。例如,窗口大小等于季节持续时间时(例如:12为月度序列),将有效地抵消季节效应。
LOESS,局部回归的简写,适应于每个点邻近的多元回归。可通过statsmodels包使用,你可以使用frac参数确定被纳入拟合回归模型的邻近数据点的百分比来控制平滑度。
下载数据集: Elecequip.csv
from statsmodels.nonparametric.smoothers_lowess import lowess
plt.rcParams.update({'xtick.bottom' : False, 'axes.titlepad':5})
df_orig = pd.read_csv('datasets/elecequip.csv', parse_dates=['date'], index_col='date')
df_ma = df_orig.value.rolling(3, center=True, closed='both').mean()
df_loess_5 = pd.DataFrame(lowess(df_orig.value, np.arange(len(df_orig.value)), frac=0.05)[:, 1], index=df_orig.index, columns=['value'])
df_loess_15 = pd.DataFrame(lowess(df_orig.value, np.arange(len(df_orig.value)), frac=0.15)[:, 1], index=df_orig.index, columns=['value'])
fig, axes = plt.subplots(4,1, figsize=(7, 7), sharex=True, dpi=120)
df_orig['value'].plot(ax=axes[0], color='k', title='Original Series')
df_loess_5['value'].plot(ax=axes[1], title='Loess Smoothed 5%')
df_loess_15['value'].plot(ax=axes[2], title='Loess Smoothed 15%')
df_ma.plot(ax=axes[3], title='Moving Average (3)')
fig.suptitle('How to Smoothen a Time Series', y=0.95, fontsize=14)
plt.show()
21. 如何使用Granger因果检验得知是否一个时间序列有助于预测另一个序列?
Granger因果检验被用于检验是否一个时间序列可以预测另一个序列。 Granger因果检验是如何工作 的?它基于如果X引起Y的变化,Y基于之前的Y值和之前的X值的预测效果要优于仅基于之前的Y值的预测效果。
所以需要了解Granger因果检验不能应用于Y的滞后量引起Y自身的变化的情况,而通常仅用于外源变量(不是Y的滞后量)。
它在statsmodel包中得到了很好的实现。 它采纳2列数据的二维数组作为主要参数,被预测值是第一列,而预测变量(X)在第二列。
零假设检验:第二列的序列不能Granger预测第一列数据。如果p值小于显著性水平(0.05),你可以拒绝零假设并得出结论:X的滞后量确实有用。
第二个参数maxlag决定有多少Y的滞后量应该纳入检验当中。
from statsmodels.tsa.stattools import grangercausalitytests
df = pd.read_csv('https://raw.githubusercontent.com/selva86/datasets/master/a10.csv', parse_dates=['date'])
= df.date.dt.month
'month']], maxlag=2)
Granger Causality
number of lags (no zero) 1
ssr based F test: F=54.7797 , p=0.0000 , df_denom=200, df_num=1
ssr based chi2 test: chi2=55.6014 , p=0.0000 , df=1
likelihood ratio test: chi2=49.1426 , p=0.0000 , df=1
parameter F test: F=54.7797 , p=0.0000 , df_denom=200, df_num=1
Granger Causality
number of lags (no zero) 2
ssr based F test: F=162.6989, p=0.0000 , df_denom=197, df_num=2
ssr based chi2 test: chi2=333.6567, p=0.0000 , df=2
likelihood ratio test: chi2=196.9956, p=0.0000 , df=2
parameter F test: F=162.6989, p=0.0000 , df_denom=197, df_num=2
在上述例子当中, 实际上所有检验的p值只能无限接近于0 。所以“月份”实际上可以用于预测航空乘客的数量。
22. 下一步是什么?
在下一篇文章当中,我将带你了解使用ARIMA (Autoregressive Integrated Moving Average,自回归求和移动平均模式)建立时间序列预测模型的深度过程。下次再见。
原文标题:
Time Series Analysis in Python – A Comprehensive Guide with Examples
原文链接:
https://www.machinelearningplus.com/time-series/time-series-analysis-python/
编辑:黄继彦

