原来贝叶斯统计分析这么简单?这个技巧了解一下
今天小编就给大家介绍一个非常有用的统计分析小技巧-R-bayestestR。该包和其他大多数的R包只提供一组有限的索引(如点估计和CI)不同,其可以提供了一套全面且一致的函数来分析和描述由各种模型对象生成的后验分布,包括流行的建模包,如rstanarm、brms或BayesFactor。更多关于该包的介绍可参考:R-bayestestR官网[1]
下面小编就简单介绍下该包的用法,主要如下:
特征(Features)
在贝叶斯框架中,参数以概率方式估计为分布,可以通过以下4种指数来总结和描述这些分布,更多其他特征可参考:Many other Features[2]
Centrality(中心性) mean()、median()、map_estimate() 用于估计模式。 point_estimate() 可用于立即获取它们并可直接在模型上运行。 Uncertainty(不确定性) hdi() 表示最高密度区间(HDI)或eti() 表示等尾区间(ETI)。 ci() 可用作置信区间(CI)的通用方法。 Effect Existence:效果是否不同于0。 p_direction() 表示频率派 p 值的贝叶斯等效值。 p_pointnull() 表示与最可能的假设(MAP)相比,零假设 (h0 = 0) 的几率。 bf_pointnull() 用于经典贝叶斯因子(BF),评估效应存在与不存在的可能性(h0 = 0)。 Effect Significance:效应大小是否可以被认为是不可忽略的。 p_rope() 效果落在实际等效区域(ROPE)内的概率。 bf_rope() 根据区域(ROPE)定义的空值计算贝叶斯因子。 p_significance() 将等效区域与方向概率相结合。
R-bayestestR包的describe_posterior() 就可以很好对一些特征进行计算,如下:
library(bayestestR)
bayestestR::describe_posterior(
  rnorm(10000),
  centrality = "median",
  test = c("p_direction", "p_significance")
)

更多关于describe_posterior()的介绍可参考:describe_posterior()函数介绍[3]
Point-estimates
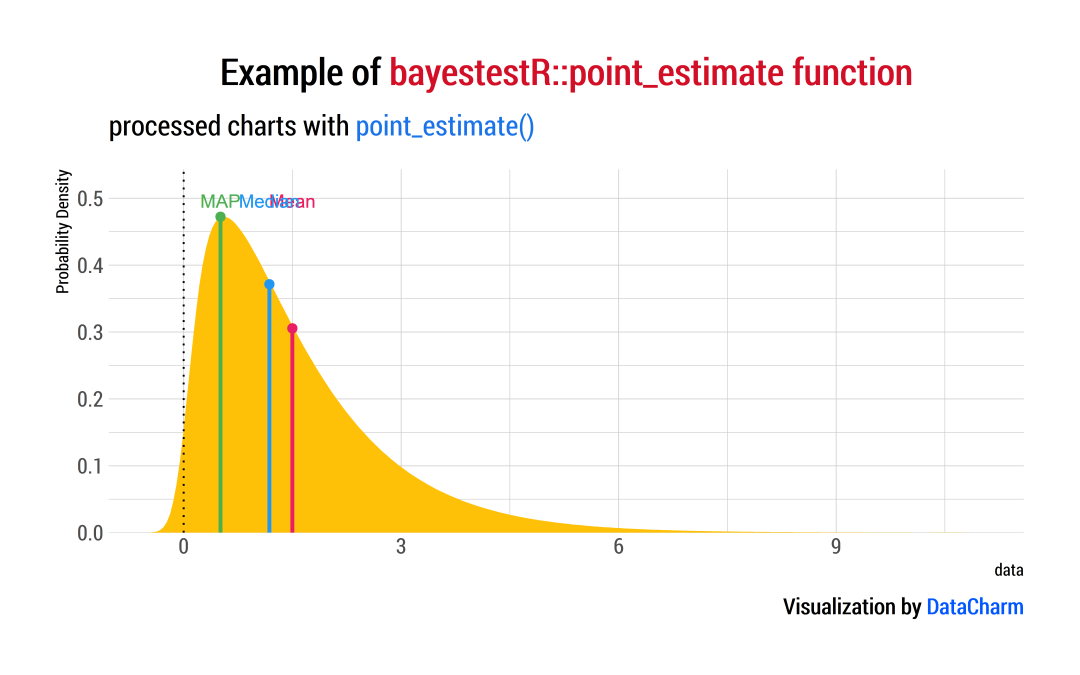
做为bayestestR包分布特征中最常用的一个,Point-estimates()可以计算各种点估计值(例如均值、中值或MAP,以描述后验分布。如下:
posterior <- distribution_gamma(10000, 1.5)  # Generate a skewed distribution
centrality <- point_estimate(posterior)  # Get indices of centrality
plot(centrality) +
  labs(
       title = "Example of bayestestR::point_estimate function",
       subtitle = "processed charts with point_estimate()",
       caption = "Visualization by DataCharm") +
  hrbrthemes::theme_ipsum(base_family = "Roboto Condensed") +
  theme(
    plot.title = element_markdown(hjust = 0.5,vjust = .5,color = "black",
                                  size = 20, margin = margin(t = 1, b = 12)),
    plot.subtitle = element_markdown(hjust = 0,vjust = .5,size=15),
    plot.caption = element_markdown(face = 'bold',size = 12))
Uncertainty (CI)
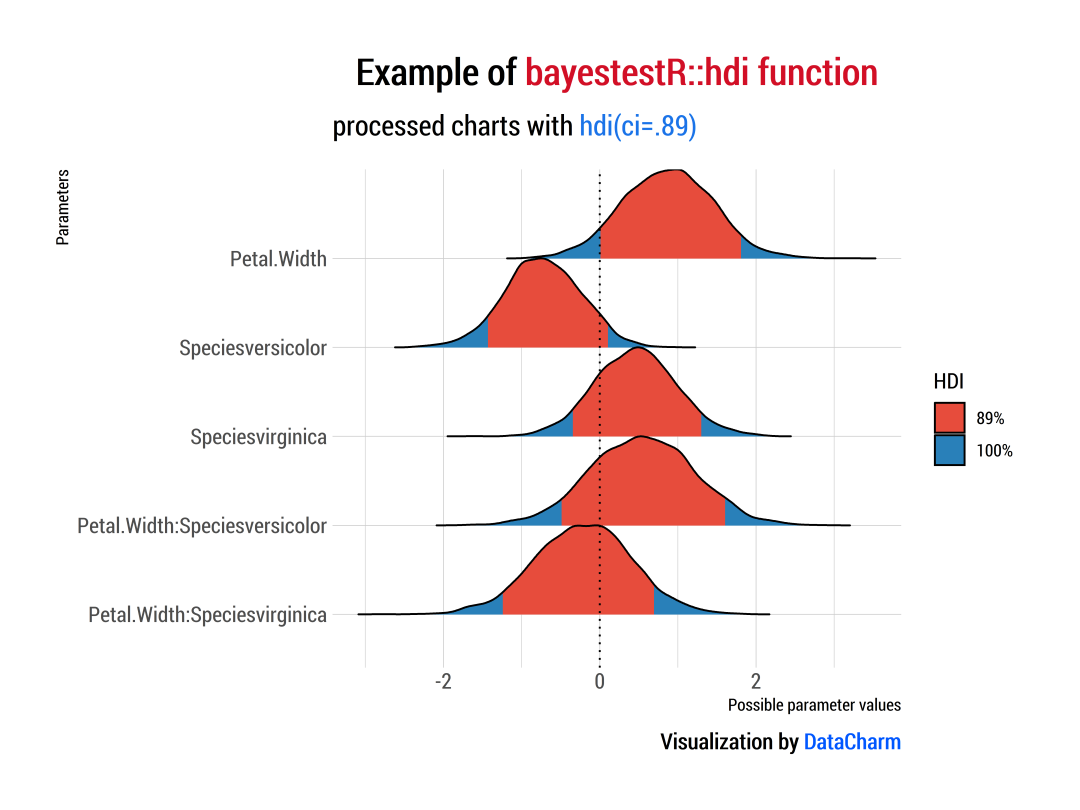
hdi() 计算后验分布的最高密度区间(HDI),即包含区间内所有点的区间比区间外的点具有更高的概率密度。HDI可用于作为可信区间(CI) 的贝叶斯后验表征的上下文中。
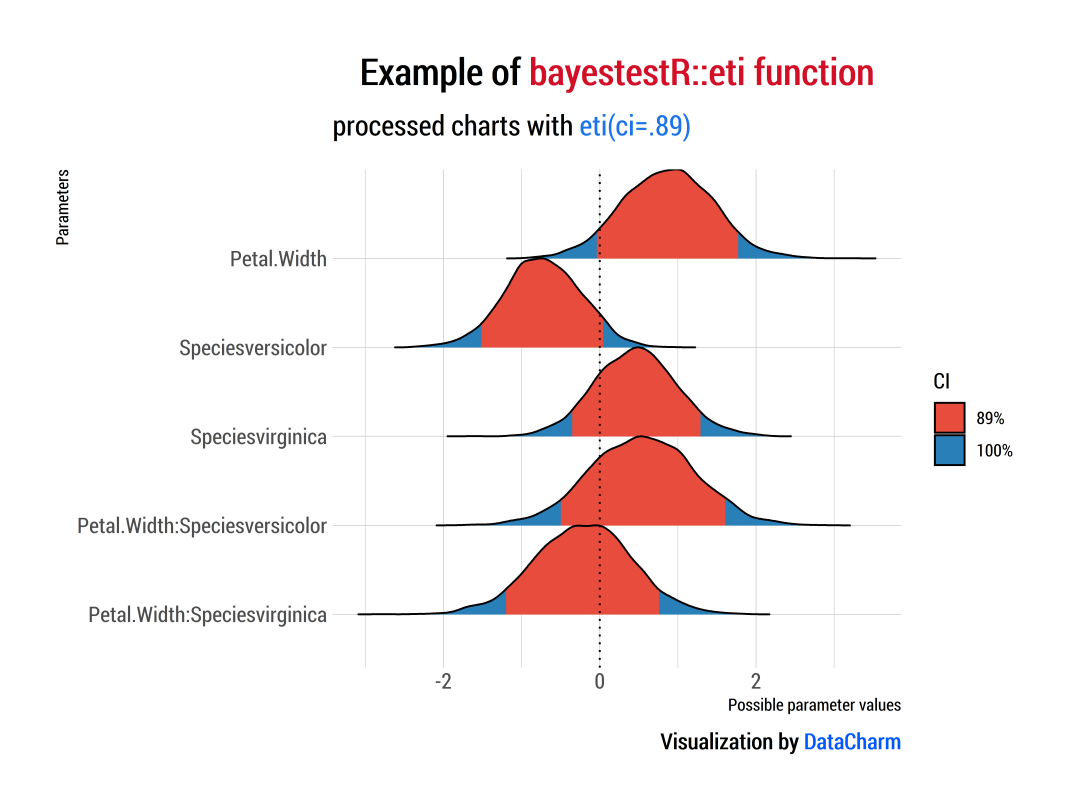
与通常从分布的每个尾部排除2.5%的等尾区间不同,HDI不是等尾区间,因此始终包括后验分布的众数。
默认情况下,hdi()返回89%的区间(ci = 0.89),比例如95%的区间更稳定。可视化展示如下:
「Highest Density Interval (HDI)」:
m <<- stan_glm(Sepal.Length ~ Petal.Width * Species, data = iris, refresh = 0)
result <- hdi(m,ci = .89)

plot(result) +
  labs(
    title = "Example of bayestestR::hdi function",
    subtitle = "processed charts with hdi(ci=.89)",
    caption = "Visualization by DataCharm") +
  hrbrthemes::theme_ipsum(base_family = "Roboto Condensed") +
  theme(
    plot.title = element_markdown(hjust = 0.5,vjust = .5,color = "black",
                                  size = 20, margin = margin(t = 1, b = 12)),
    plot.subtitle = element_markdown(hjust = 0,vjust = .5,size=15),
    plot.caption = element_markdown(face = 'bold',size = 12))
「Equal-Tailed Interval (ETI)」:
m2 <- eti(m,ci = .89)

plot(m2) +
  labs(
    title = "Example of bayestestR::eti function",
    subtitle = "processed charts with eti(ci=.89)",
    caption = "Visualization by DataCharm") +
  hrbrthemes::theme_ipsum(base_family = "Roboto Condensed") +
  theme(
    plot.title = element_markdown(hjust = 0.5,vjust = .5,color = "black",
                                  size = 20, margin = margin(t = 1, b = 12)),
    plot.subtitle = element_markdown(hjust = 0,vjust = .5,size=15),
    plot.caption = element_markdown(face = 'bold',size = 12))
Existence and Significance Testing
「Probability of Direction (pd)」:
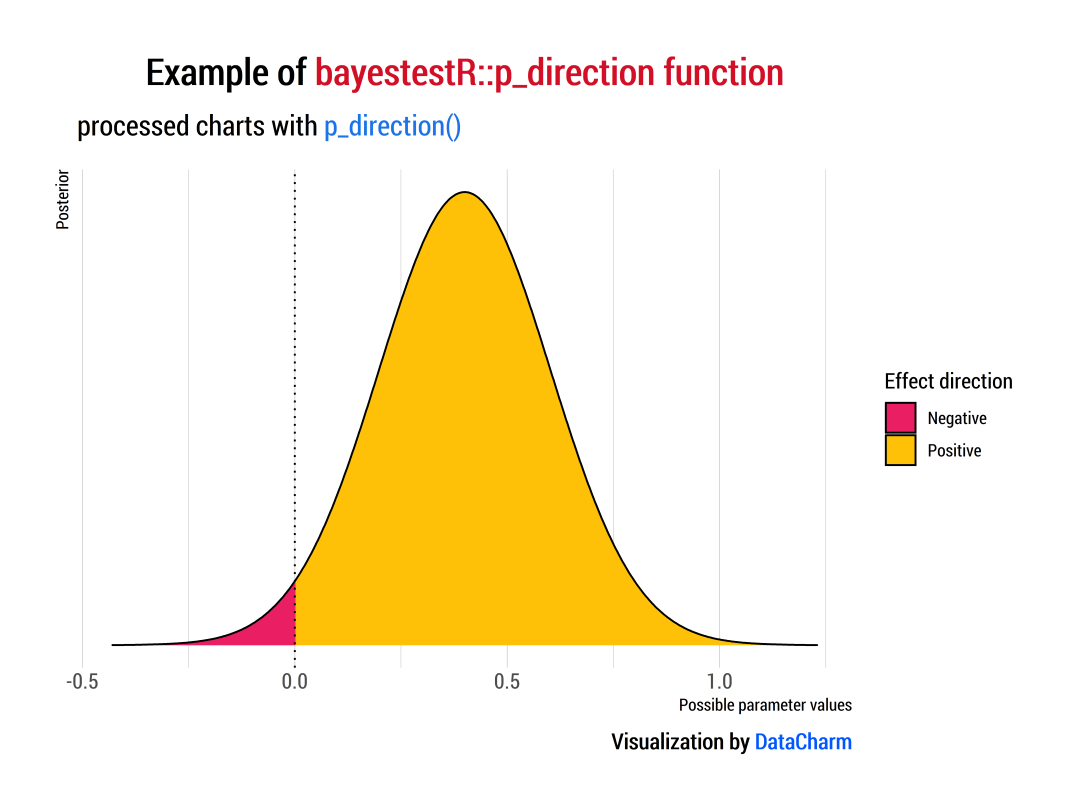
p_direction() 计算方向概率(Probability of Direction)(pd,也称为最大效应概率-MPE)。它在50%到100%(即 0.5 和 1)之间变化,可解释为参数(由其后验分布描述) 严格为正或为负的概率(以百分比表示),且该指数与p值非常相似(即强相关)。
posterior <- distribution_normal(10000, 0.4, 0.2)
m3 <- p_direction(posterior)
plot(m3) +
  scale_fill_manual(values = c("#E91E63","#FFC107"))+
  labs(
    title = "Example of bayestestR::p_direction function",
    subtitle = "processed charts with p_direction()",
    caption = "Visualization by DataCharm") +
  hrbrthemes::theme_ipsum(base_family = "Roboto Condensed") +
  theme(
    plot.title = element_markdown(hjust = 0.5,vjust = .5,color = "black",
                                  size = 20, margin = margin(t = 1, b = 12)),
    plot.subtitle = element_markdown(hjust = 0,vjust = .5,size=15),
    plot.caption = element_markdown(face = 'bold',size = 12))
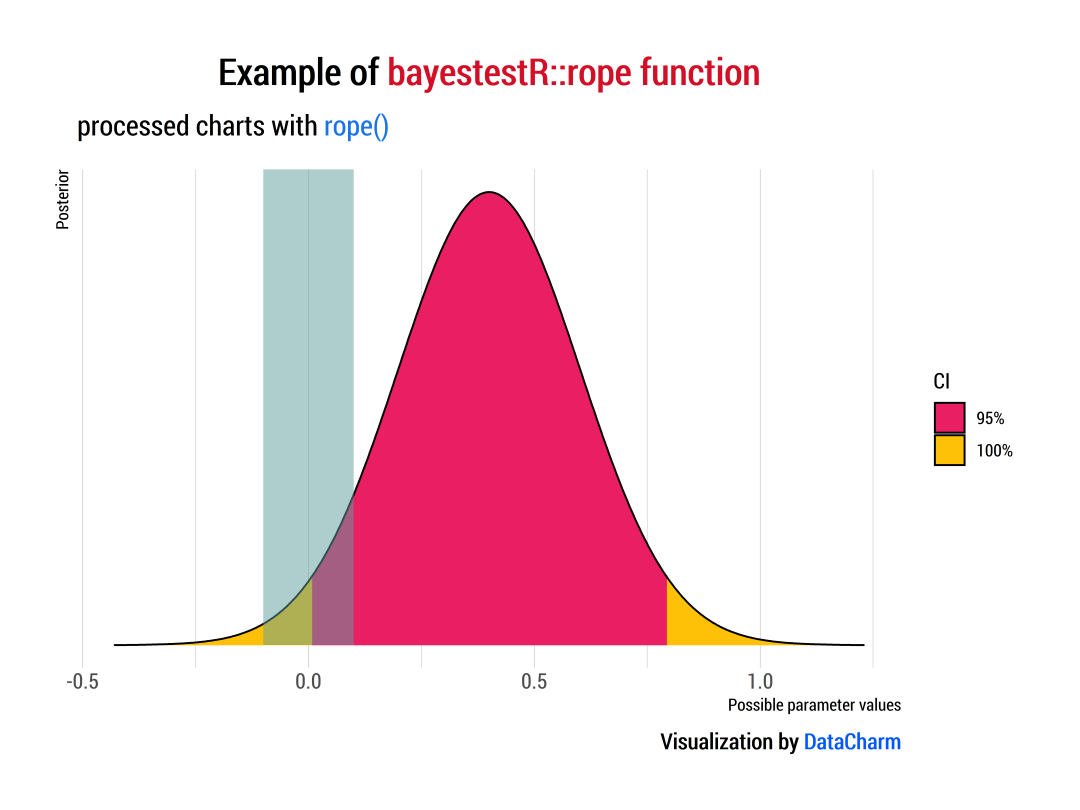
ROPE
rope() 计算位于实际等效区域内的后验分布的HDI(默认为89%HDI)的比例(以百分比表示)。
posterior <- distribution_normal(10000, 0.4, 0.2)
m4 <- rope(posterior, range = c(-0.1, 0.1),)
plot(m4) +
  scale_fill_manual(values = c("#E91E63","#FFC107"))+
  labs(
    title = "Example of bayestestR::rope function",
    subtitle = "processed charts with rope()",
    caption = "Visualization by DataCharm") +
  hrbrthemes::theme_ipsum(base_family = "Roboto Condensed") +
  theme(
    plot.title = element_markdown(hjust = 0.5,vjust = .5,color = "black",
                                  size = 20, margin = margin(t = 1, b = 12)),
    plot.subtitle = element_markdown(hjust = 0,vjust = .5,size=15),
    plot.caption = element_markdown(face = 'bold',size = 12))
Bayes Factor
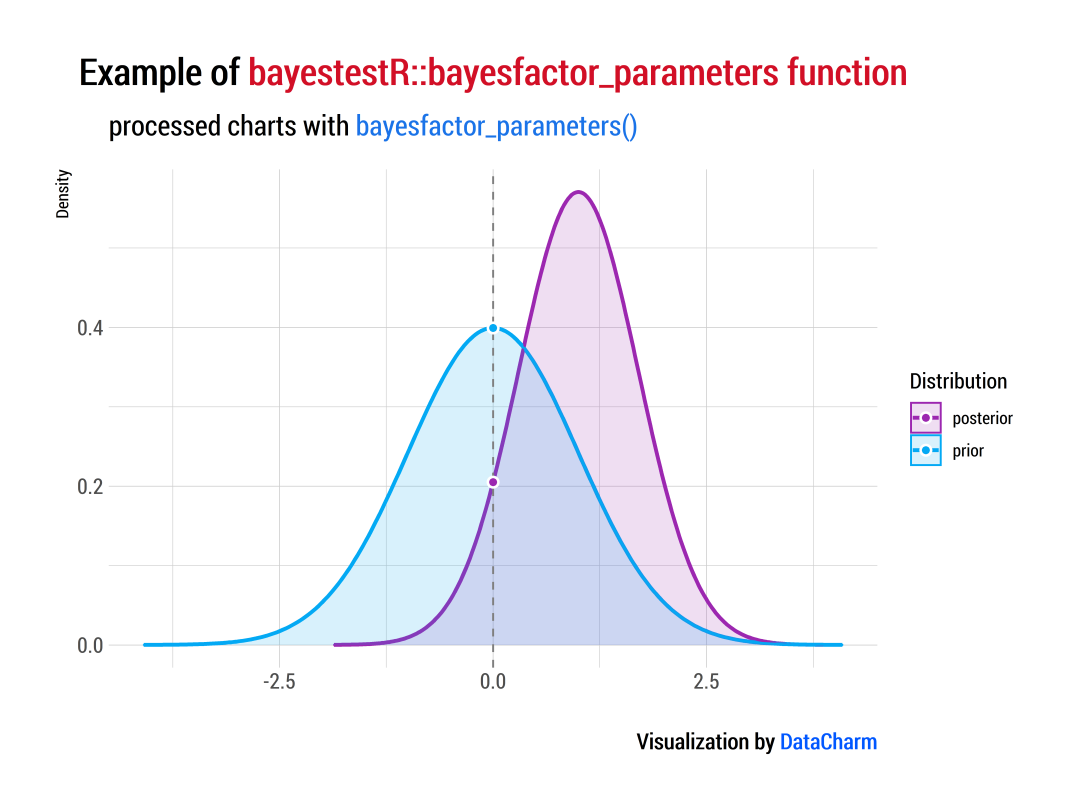
bayesfactor_parameters() 基于单个参数的先验样本和后验样本,针对空值(点或区间)计算贝叶斯因子。这个贝叶斯因子表示后验分布的质量远离或接近空值的程度(相对于先验分布),从而表明空值是否变得更小或更可能给定观察到的数据。
##  Bayes Factor
prior <- distribution_normal(10000, mean = 0, sd = 1)
posterior <- distribution_normal(10000, mean = 1, sd = 0.7)

m5 <- bayesfactor_parameters(posterior, prior, direction = "two-sided", null = 0)
m5

plot(m5)+
  scale_fill_material_d(palette = "ice") +
  scale_color_material_d(palette = "ice") +
  labs(
    title = "Example of bayestestR::bayesfactor_parameters function",
    subtitle = "processed charts with bayesfactor_parameters()",
    caption = "Visualization by DataCharm") +
  hrbrthemes::theme_ipsum(base_family = "Roboto Condensed") +
  theme(
    plot.title = element_markdown(hjust = 0.5,vjust = .5,color = "black",
                                  size = 20, margin = margin(t = 1, b = 12)),
    plot.subtitle = element_markdown(hjust = 0,vjust = .5,size=15),
    plot.caption = element_markdown(face = 'bold',size = 12))
更多关于bayesfactor_parameters()详细内容可参考:bayesfactor_parameters()[4]
总结
今天这篇推文简单介绍了统计学中常用的贝叶斯原理-R-bayestestR(涉及的专业方面可能较少,本意还是了解这个技巧),不仅可以计算各个指标,还能使用恰当的可视化图表表现出来,希望大家可以多了解下这个好用的统计分析包。
再小的技能,也应该被认真对待。
参考资料
R-bayestestR官网: https://easystats.github.io/bayestestR/index.html。
[2]bayestestR其他特征: https://easystats.github.io/bayestestR/reference/index.html。
[3]describe_posterior()函数介绍: https://easystats.github.io/bayestestR/reference/describe_posterior.html。
[4]bayesfactor_parameters()介绍: https://easystats.github.io/bayestestR/reference/bayesfactor_parameters.html。

各位伙伴们好,詹帅本帅搭建了一个个人博客和小程序,汇集各种干货和资源,也方便大家阅读,感兴趣的小伙伴请移步小程序体验一下哦!(欢迎提建议)
推荐阅读
推荐阅读
