如何爬升用于机器学习的测试集

无需查看训练数据集,就可以通过爬上测试集来做出完美的预测。 如何为分类和回归任务爬坡测试集。 当我们过度使用测试集来评估建模管道时,我们暗中爬升了测试集。
爬坡测试仪 爬山算法 如何进行爬山 爬坡糖尿病分类数据集 爬坡房屋回归数据集
# example of a synthetic dataset.
from sklearn.datasets import make_classification
from sklearn.model_selection import train_test_split
# define dataset
X, y = make_classification(n_samples=5000, n_features=20, n_informative=15, n_redundant=5, random_state=1)
print(X.shape, y.shape)
# split dataset
X_train, X_test, y_train, y_test = train_test_split(X, y, test_size=0.33, random_state=1)
print(X_train.shape, X_test.shape, y_train.shape, y_test.shape)
(5000, 20) (5000,)
(3350, 20) (1650, 20) (3350,) (1650,)
# load or prepare the classification dataset
def load_dataset():
 return make_classification(n_samples=5000, n_features=20, n_informative=15, n_redundant=5, random_state=1)
# evaluate a set of predictions
def evaluate_predictions(y_test, yhat):
 return accuracy_score(y_test, yhat)
randint()函数生成0和1的随机值。# create a random set of predictions
def random_predictions(n_examples):
return [randint(0, 1) for _ in range(n_examples)]
# modify the current set of predictions
def modify_predictions(current, n_changes=1):
# copy current solution
updated = current.copy()
for i in range(n_changes):
# select a point to change
ix = randint(0, len(updated)-1)
# flip the class label
updated[ix] = 1 - updated[ix]
return updated
random_predictions()函数和随后的validate_predictions()函数来创建和评估初始解决方案。然后,我们循环进行固定次数的迭代,并通过调用Modify_predictions()生成一个新的候选值,对其进行求值,如果分数与当前解决方案相同或更好,则将其替换。当我们完成预设的迭代次数(任意选择)或达到理想分数时,该循环结束,在这种情况下,我们知道其精度为1.0(100%)。下面的函数hill_climb_testset()实现了此功能,将测试集作为输入并返回在爬坡过程中发现的最佳预测集。# run a hill climb for a set of predictions
def hill_climb_testset(X_test, y_test, max_iterations):
scores = list()
# generate the initial solution
solution = random_predictions(X_test.shape[0])
# evaluate the initial solution
score = evaluate_predictions(y_test, solution)
scores.append(score)
# hill climb to a solution
for i in range(max_iterations):
# record scores
scores.append(score)
# stop once we achieve the best score
if score == 1.0:
break
# generate new candidate
candidate = modify_predictions(solution)
# evaluate candidate
value = evaluate_predictions(y_test, candidate)
# check if it is as good or better
if value >= score:
solution, score = candidate, value
print('>%d, score=%.3f' % (i, score))
return solution, scores
# example of hill climbing the test set for a classification task
from random import randint
from sklearn.datasets import make_classification
from sklearn.model_selection import train_test_split
from sklearn.metrics import accuracy_score
from matplotlib import pyplot
# load or prepare the classification dataset
def load_dataset():
return make_classification(n_samples=5000, n_features=20, n_informative=15, n_redundant=5, random_state=1)
# evaluate a set of predictions
def evaluate_predictions(y_test, yhat):
return accuracy_score(y_test, yhat)
# create a random set of predictions
def random_predictions(n_examples):
 return [randint(0, 1) for _ in range(n_examples)]
# modify the current set of predictions
def modify_predictions(current, n_changes=1):
 # copy current solution
 updated = current.copy()
 for i in range(n_changes):
  # select a point to change
  ix = randint(0, len(updated)-1)
  # flip the class label
  updated[ix] = 1 - updated[ix]
 return updated
# run a hill climb for a set of predictions
def hill_climb_testset(X_test, y_test, max_iterations):
 scores = list()
 # generate the initial solution
 solution = random_predictions(X_test.shape[0])
 # evaluate the initial solution
 score = evaluate_predictions(y_test, solution)
 scores.append(score)
 # hill climb to a solution
 for i in range(max_iterations):
  # record scores
  scores.append(score)
  # stop once we achieve the best score
  if score == 1.0:
   break
  # generate new candidate
  candidate = modify_predictions(solution)
  # evaluate candidate
  value = evaluate_predictions(y_test, candidate)
  # check if it is as good or better
  if value >= score:
   solution, score = candidate, value
   print('>%d, score=%.3f' % (i, score))
 return solution, scores
# load the dataset
X, y = load_dataset()
print(X.shape, y.shape)
# split dataset into train and test sets
X_train, X_test, y_train, y_test = train_test_split(X, y, test_size=0.33, random_state=1)
print(X_train.shape, X_test.shape, y_train.shape, y_test.shape)
# run hill climb
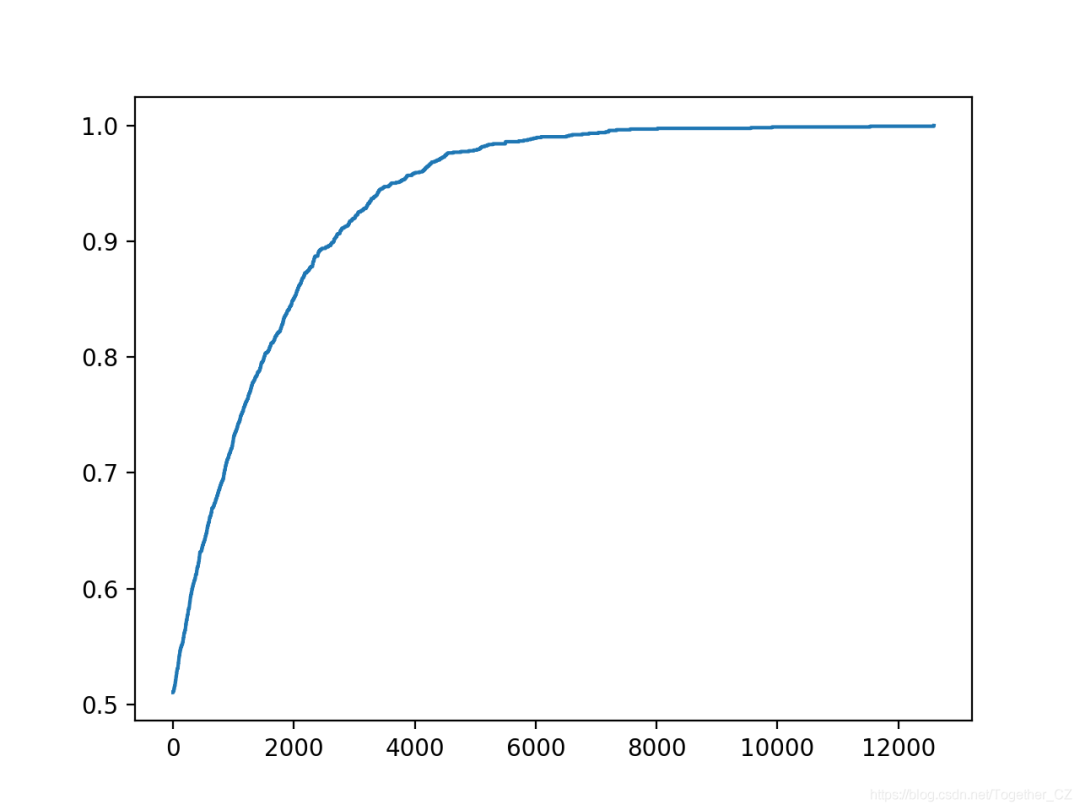
yhat, scores = hill_climb_testset(X_test, y_test, 20000)
# plot the scores vs iterations
pyplot.plot(scores)
pyplot.show()
...
>8092, score=0.996
>8886, score=0.997
>9202, score=0.998
>9322, score=0.998
>9521, score=0.999
>11046, score=0.999
>12932, score=1.000

pima-indians-diabetes.names数据集:pima-indians-diabetes.csv6,148,72,35,0,33.6,0.627,50,1
1,85,66,29,0,26.6,0.351,31,0
8,183,64,0,0,23.3,0.672,32,1
1,89,66,23,94,28.1,0.167,21,0
0,137,40,35,168,43.1,2.288,33,1
...
# load or prepare the classification dataset
def load_dataset():
 url = 'https://raw.githubusercontent.com/jbrownlee/Datasets/master/pima-indians-diabetes.csv'
 df = read_csv(url, header=None)
 data = df.values
 return data[:, :-1], data[:, -1]
# example of hill climbing the test set for the diabetes dataset
from random import randint
from pandas import read_csv
from sklearn.model_selection import train_test_split
from sklearn.metrics import accuracy_score
from matplotlib import pyplot

# load or prepare the classification dataset
def load_dataset():
 url = 'https://raw.githubusercontent.com/jbrownlee/Datasets/master/pima-indians-diabetes.csv'
 df = read_csv(url, header=None)
 data = df.values
 return data[:, :-1], data[:, -1]

# evaluate a set of predictions
def evaluate_predictions(y_test, yhat):
 return accuracy_score(y_test, yhat)

# create a random set of predictions
def random_predictions(n_examples):
 return [randint(0, 1) for _ in range(n_examples)]

# modify the current set of predictions
def modify_predictions(current, n_changes=1):
 # copy current solution
 updated = current.copy()
 for i in range(n_changes):
  # select a point to change
  ix = randint(0, len(updated)-1)
  # flip the class label
  updated[ix] = 1 - updated[ix]
 return updated

# run a hill climb for a set of predictions
def hill_climb_testset(X_test, y_test, max_iterations):
 scores = list()
 # generate the initial solution
 solution = random_predictions(X_test.shape[0])
 # evaluate the initial solution
 score = evaluate_predictions(y_test, solution)
 scores.append(score)
 # hill climb to a solution
 for i in range(max_iterations):
  # record scores
  scores.append(score)
  # stop once we achieve the best score
  if score == 1.0:
   break
  # generate new candidate
  candidate = modify_predictions(solution)
  # evaluate candidate
  value = evaluate_predictions(y_test, candidate)
  # check if it is as good or better
  if value >= score:
   solution, score = candidate, value
   print('>%d, score=%.3f' % (i, score))
 return solution, scores

# load the dataset
X, y = load_dataset()
print(X.shape, y.shape)
# split dataset into train and test sets
X_train, X_test, y_train, y_test = train_test_split(X, y, test_size=0.33, random_state=1)
print(X_train.shape, X_test.shape, y_train.shape, y_test.shape)
# run hill climb
yhat, scores = hill_climb_testset(X_test, y_test, 5000)
# plot the scores vs iterations
pyplot.plot(scores)
pyplot.show()
运行示例将报告每次搜索过程中看到改进时的迭代次数和准确性。
在这种情况下,我们使用的迭代次数较少,因为要进行的预测较少,因此优化起来比较简单。
注意:由于算法或评估程序的随机性,或者数值精度的差异,您的结果可能会有所不同。考虑运行该示例几次并比较平均结果。
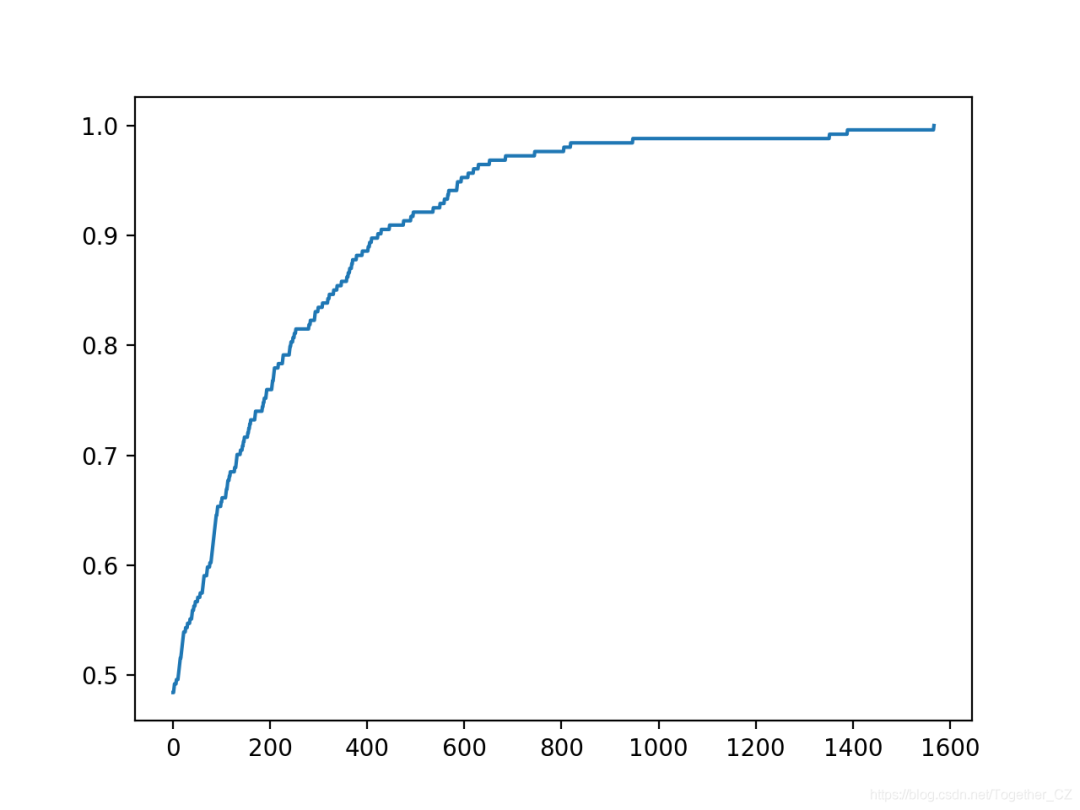
在这种情况下,我们可以看到在大约1,500次迭代中达到了完美的精度。
...
>617, score=0.961
>627, score=0.965
>650, score=0.969
>683, score=0.972
>743, score=0.976
>803, score=0.980
>817, score=0.984
>945, score=0.988
>1350, score=0.992
>1387, score=0.996
>1565, score=1.000
还创建了搜索进度的折线图,表明收敛迅速。

爬坡房屋回归数据集
我们将使用住房数据集作为探索爬坡测试集回归问题的基础。住房数据集包含给定房屋及其附近地区详细信息的数千美元房屋价格预测。
数据集详细信息:housing.names数据集:housing.csv
这是一个回归问题,这意味着我们正在预测一个数值。共有506个观测值,其中包含13个输入变量和一个输出变量。下面列出了前五行的示例。
0.00632,18.00,2.310,0,0.5380,6.5750,65.20,4.0900,1,296.0,15.30,396.90,4.98,24.00
0.02731,0.00,7.070,0,0.4690,6.4210,78.90,4.9671,2,242.0,17.80,396.90,9.14,21.60
0.02729,0.00,7.070,0,0.4690,7.1850,61.10,4.9671,2,242.0,17.80,392.83,4.03,34.70
0.03237,0.00,2.180,0,0.4580,6.9980,45.80,6.0622,3,222.0,18.70,394.63,2.94,33.40
0.06905,0.00,2.180,0,0.4580,7.1470,54.20,6.0622,3,222.0,18.70,396.90,5.33,36.20
...
load_dataset()函数以加载住房数据集。作为加载数据集的一部分,我们将标准化目标值。由于我们可以将浮点值限制在0到1的范围内,这将使爬坡的预测更加简单。通常不需要这样做,只是此处采用的简化搜索算法的方法。# load or prepare the classification dataset
def load_dataset():
url = 'https://raw.githubusercontent.com/jbrownlee/Datasets/master/housing.csv'
df = read_csv(url, header=None)
data = df.values
X, y = data[:, :-1], data[:, -1]
# normalize the target
scaler = MinMaxScaler()
y = y.reshape((len(y), 1))
y = scaler.fit_transform(y)
return X, y
# evaluate a set of predictions
def evaluate_predictions(y_test, yhat):
return mean_absolute_error(y_test, yhat)
我们还必须将解决方案的表示形式从0和1标签更新为介于0和1之间的浮点值。必须更改初始候选解的生成以创建随机浮点列表。
# create a random set of predictions
def random_predictions(n_examples):
return [random() for _ in range(n_examples)]
# modify the current set of predictions
def modify_predictions(current, n_changes=1):
# copy current solution
updated = current.copy()
for i in range(n_changes):
# select a point to change
ix = randint(0, len(updated)-1)
# flip the class label
updated[ix] = random()
return updated
# add gaussian noise
updated[ix] += gauss(0, 0.1)
# stop once we achieve the best score
if score == 0.0:
break
# check if it is as good or better
if value <= score:
solution, score = candidate, value
print('>%d, score=%.3f' % (i, score))
# run a hill climb for a set of predictions
def hill_climb_testset(X_test, y_test, max_iterations):
scores = list()
# generate the initial solution
solution = random_predictions(X_test.shape[0])
# evaluate the initial solution
score = evaluate_predictions(y_test, solution)
print('>%.3f' % score)
# hill climb to a solution
for i in range(max_iterations):
# record scores
scores.append(score)
# stop once we achieve the best score
if score == 0.0:
break
# generate new candidate
candidate = modify_predictions(solution)
# evaluate candidate
value = evaluate_predictions(y_test, candidate)
# check if it is as good or better
if value <= score:
solution, score = candidate, value
print('>%d, score=%.3f' % (i, score))
return solution, scores
# example of hill climbing the test set for the housing dataset
from random import random
from random import randint
from pandas import read_csv
from sklearn.model_selection import train_test_split
from sklearn.metrics import mean_absolute_error
from sklearn.preprocessing import MinMaxScaler
from matplotlib import pyplot
# load or prepare the classification dataset
def load_dataset():
 url = 'https://raw.githubusercontent.com/jbrownlee/Datasets/master/housing.csv'
 df = read_csv(url, header=None)
 data = df.values
 X, y = data[:, :-1], data[:, -1]
 # normalize the target
 scaler = MinMaxScaler()
 y = y.reshape((len(y), 1))
 y = scaler.fit_transform(y)
 return X, y
# evaluate a set of predictions
def evaluate_predictions(y_test, yhat):
 return mean_absolute_error(y_test, yhat)
# create a random set of predictions
def random_predictions(n_examples):
 return [random() for _ in range(n_examples)]
# modify the current set of predictions
def modify_predictions(current, n_changes=1):
 # copy current solution
 updated = current.copy()
 for i in range(n_changes):
  # select a point to change
  ix = randint(0, len(updated)-1)
  # flip the class label
  updated[ix] = random()
 return updated
# run a hill climb for a set of predictions
def hill_climb_testset(X_test, y_test, max_iterations):
scores = list()
# generate the initial solution
solution = random_predictions(X_test.shape[0])
# evaluate the initial solution
score = evaluate_predictions(y_test, solution)
print('>%.3f' % score)
# hill climb to a solution
for i in range(max_iterations):
# record scores
scores.append(score)
# stop once we achieve the best score
if score == 0.0:
 break
# generate new candidate
candidate = modify_predictions(solution)
# evaluate candidate
value = evaluate_predictions(y_test, candidate)
# check if it is as good or better
if value <= score:
 solution, score = candidate, value
 print('>%d, score=%.3f' % (i, score))
return solution, scores
# load the dataset
X, y = load_dataset()
print(X.shape, y.shape)
# split dataset into train and test sets
X_train, X_test, y_train, y_test = train_test_split(X, y, test_size=0.33, random_state=1)
print(X_train.shape, X_test.shape, y_train.shape, y_test.shape)
# run hill climb
yhat, scores = hill_climb_testset(X_test, y_test, 100000)
# plot the scores vs iterations
pyplot.plot(scores)
pyplot.show()
1e-7)或对目标域有意义的值,则最好停止操作。这也留给读者作为练习。例如:# stop once we achieve a good enough
if score <= 1e-7:
break
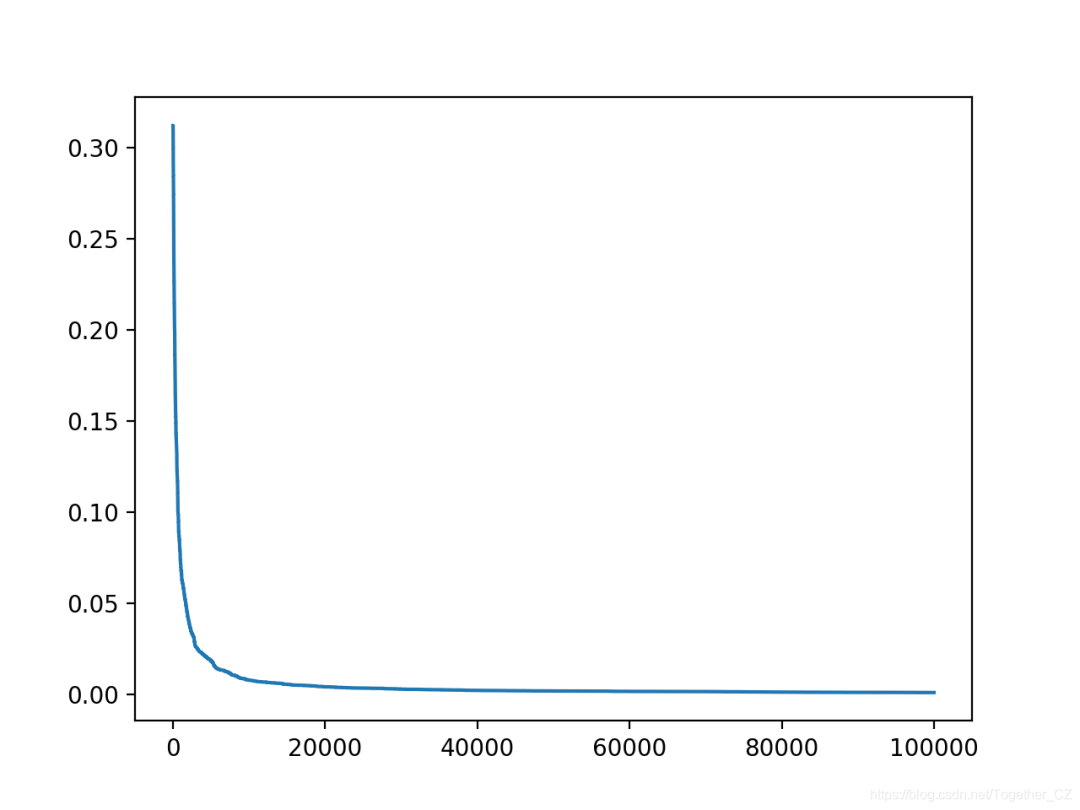
>95991, score=0.001
>96011, score=0.001
>96295, score=0.001
>96366, score=0.001
>96585, score=0.001
>97575, score=0.001
>98828, score=0.001
>98947, score=0.001
>99712, score=0.001
>99913, score=0.001
还创建了搜索进度的折线图,显示收敛速度很快,并且在大多数迭代中保持不变。

作者:沂水寒城,CSDN博客专家,个人研究方向:机器学习、深度学习、NLP、CV
Blog: http://yishuihancheng.blog.csdn.net
赞 赏 作 者

更多阅读
特别推荐

点击下方阅读原文加入社区会员
评论
