Python分析5000+抖音大V,发现大家都喜欢这类视频!

导读:本文给大家用数据分析一下在抖音什么类型的视频最受欢迎。
from pyecharts.charts import Pie, Bar, TreeMap, Map, Geo
from wordcloud import WordCloud, ImageColorGenerator
from pyecharts import options as opts
import matplotlib.pyplot as plt
from PIL import Image
import pandas as pd
import numpy as np
import jieba

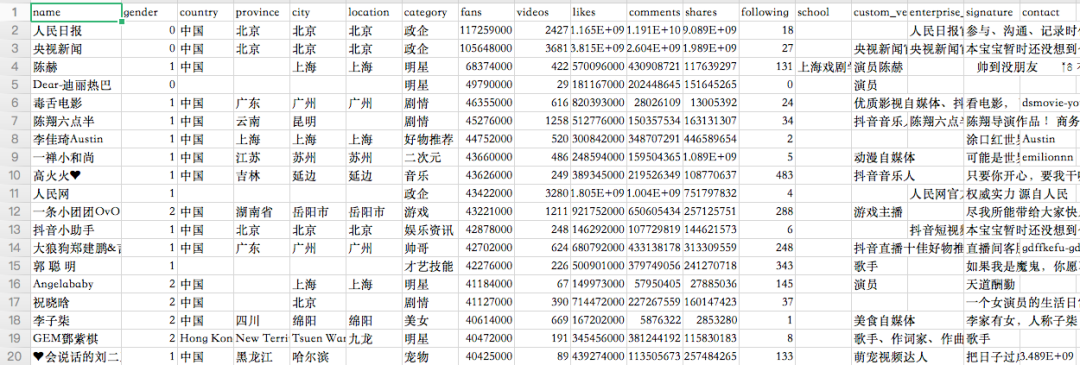
df = pd.read_csv('douyin.csv', header=0, encoding='utf-8-sig')
print(df)
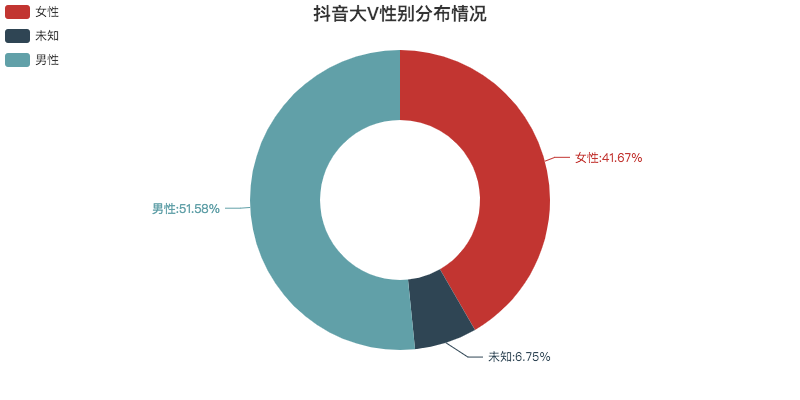
def create_gender(df):
    df = df.copy()
    # 修改数值
    df.loc[df.gender == '0', 'gender'] = '未知'
    df.loc[df.gender == '1', 'gender'] = '男性'
    df.loc[df.gender == '2', 'gender'] = '女性'
    # 根据性别分组
    gender_message = df.groupby(['gender'])
    # 对分组后的结果进行计数
    gender_com = gender_message['gender'].agg(['count'])
    gender_com.reset_index(inplace=True)

    # 饼图数据
    attr = gender_com['gender']
    v1 = gender_com['count']

    # 初始化配置
    pie = Pie(init_opts=opts.InitOpts(width="800px", height="400px"))
    # 添加数据,设置半径
    pie.add("", [list(z) for z in zip(attr, v1)], radius=["40%", "75%"])
    # 设置全局配置项,标题、图例、工具箱(下载图片)
    pie.set_global_opts(title_opts=opts.TitleOpts(title="抖音大V性别分布情况", pos_left="center", pos_top="top"),
                        legend_opts=opts.LegendOpts(orient="vertical", pos_left="left"),
                        toolbox_opts=opts.ToolboxOpts(is_show=True, feature={"saveAsImage": {}}))
    # 设置系列配置项,标签样式
    pie.set_series_opts(label_opts=opts.LabelOpts(is_show=True, formatter="{b}:{d}%"))
    pie.render("抖音大V性别分布情况.html")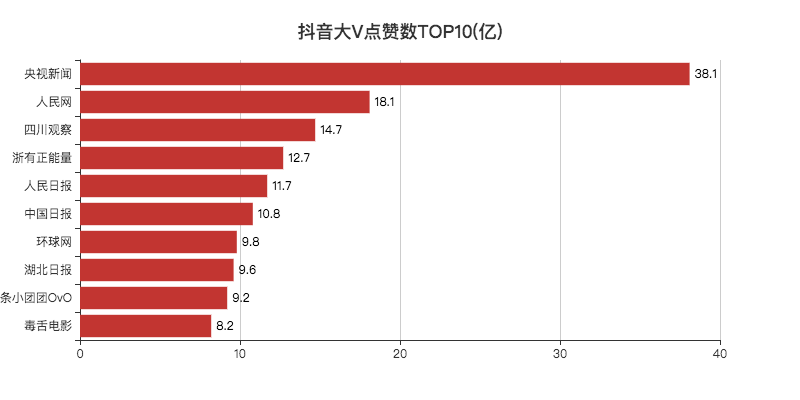
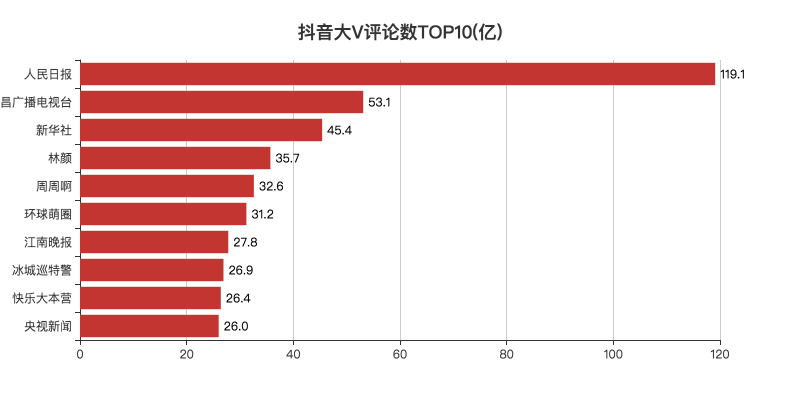
def create_likes(df):
    # 排序,降序
    df = df.sort_values('likes', ascending=False)
    # 获取TOP10的数据
    attr = df['name'][0:10]
    v1 = [float('%.1f' % (float(i) / 100000000)) for i in df['likes'][0:10]]

    # 初始化配置
    bar = Bar(init_opts=opts.InitOpts(width="800px", height="400px"))
    # x轴数据
    bar.add_xaxis(list(reversed(attr.tolist())))
    # y轴数据
    bar.add_yaxis("", list(reversed(v1)))
    # 设置全局配置项,标题、工具箱(下载图片)、y轴分割线
    bar.set_global_opts(title_opts=opts.TitleOpts(title="抖音大V点赞数TOP10(亿)", pos_left="center", pos_top="18"),
                        toolbox_opts=opts.ToolboxOpts(is_show=True, feature={"saveAsImage": {}}),
                        xaxis_opts=opts.AxisOpts(splitline_opts=opts.SplitLineOpts(is_show=True)))
    # 设置系列配置项,标签样式
    bar.set_series_opts(label_opts=opts.LabelOpts(is_show=True, position="right", color="black"))
    bar.reversal_axis()
    bar.render("抖音大V点赞数TOP10(亿).html")


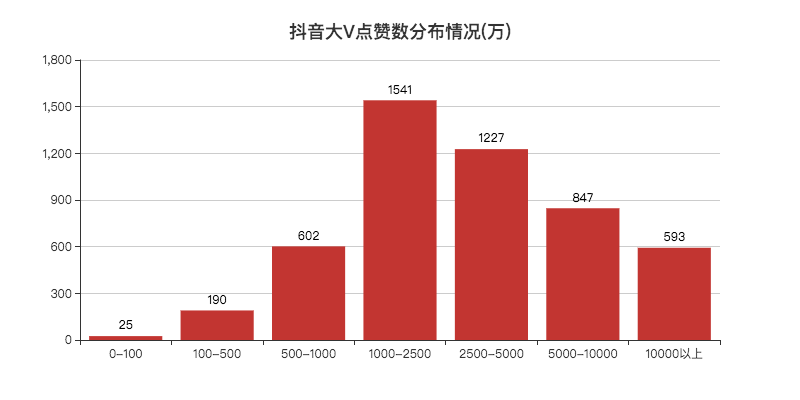
def create_cut_likes(df):
    # 将数据分段
    Bins = [0, 1000000, 5000000, 10000000, 25000000, 50000000, 100000000, 5000000000]
    Labels = ['0-100', '100-500', '500-1000', '1000-2500', '2500-5000', '5000-10000', '10000以上']
    len_stage = pd.cut(df['likes'], bins=Bins, labels=Labels).value_counts().sort_index()
    # 获取数据
    attr = len_stage.index.tolist()
    v1 = len_stage.values.tolist()

    # 生成柱状图
    bar = Bar(init_opts=opts.InitOpts(width="800px", height="400px"))
    bar.add_xaxis(attr)
    bar.add_yaxis("", v1)
    bar.set_global_opts(title_opts=opts.TitleOpts(title="抖音大V点赞数分布情况(万)", pos_left="center", pos_top="18"),
                        toolbox_opts=opts.ToolboxOpts(is_show=True, feature={"saveAsImage": {}}),
                        yaxis_opts=opts.AxisOpts(splitline_opts=opts.SplitLineOpts(is_show=True)))
    bar.set_series_opts(label_opts=opts.LabelOpts(is_show=True, position="top", color="black"))
    bar.render("抖音大V点赞数分布情况(万).html")

def create_type_likes(df):
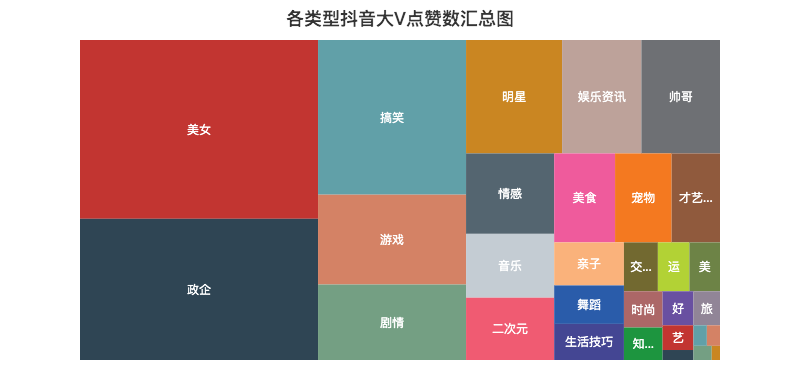
    # 分组求和
    likes_type_message = df.groupby(['category'])
    likes_type_com = likes_type_message['likes'].agg(['sum'])
    likes_type_com.reset_index(inplace=True)
    # 处理数据
    dom = []
    for name, num in zip(likes_type_com['category'], likes_type_com['sum']):
        data = {}
        data['name'] = name
        data['value'] = num
        dom.append(data)
    print(dom)

    # 初始化配置
    treemap = TreeMap(init_opts=opts.InitOpts(width="800px", height="400px"))
    # 添加数据
    treemap.add('', dom)
    # 设置全局配置项,标题、工具箱(下载图片)
    treemap.set_global_opts(title_opts=opts.TitleOpts(title="各类型抖音大V点赞数汇总图", pos_left="center", pos_top="5"),
                            toolbox_opts=opts.ToolboxOpts(is_show=True, feature={"saveAsImage": {}}),
                            legend_opts=opts.LegendOpts(is_show=False))

    treemap.render("各类型抖音大V点赞数汇总图.html")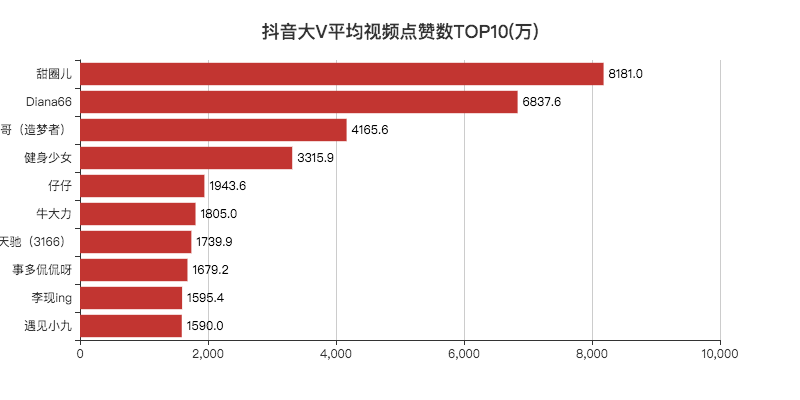

def create_avg_likes(df):
    # 筛选
    df = df[df['videos'] > 0]
    # 计算单个视频平均点赞数
    df.eval('result = likes/(videos*10000)', inplace=True)
    df['result'] = df['result'].round(decimals=1)
    df = df.sort_values('result', ascending=False)

    # 取TOP10
    attr = df['name'][0:10]
    v1 = ['%.1f' % (float(i)) for i in  df['result'][0:10]]

    # 初始化配置
    bar = Bar(init_opts=opts.InitOpts(width="800px", height="400px"))
    # 添加数据
    bar.add_xaxis(list(reversed(attr.tolist())))
    bar.add_yaxis("", list(reversed(v1)))
    # 设置全局配置项,标题、工具箱(下载图片)、y轴分割线
    bar.set_global_opts(title_opts=opts.TitleOpts(title="抖音大V平均视频点赞数TOP10(万)", pos_left="center", pos_top="18"),
                        toolbox_opts=opts.ToolboxOpts(is_show=True, feature={"saveAsImage": {}}),
                        xaxis_opts=opts.AxisOpts(splitline_opts=opts.SplitLineOpts(is_show=True)))
    # 设置系列配置项
    bar.set_series_opts(label_opts=opts.LabelOpts(is_show=True, position="right", color="black"))
    # 翻转xy轴
    bar.reversal_axis()
    bar.render("抖音大V平均视频点赞数TOP10(万).html")
def create_province_map(df):
    # 筛选数据
    df = df[df["country"] == "中国"]
    df1 = df.copy()
    # 数据替换
    df1["province"] = df1["province"].str.replace("省", "").str.replace("壮族自治区", "").str.replace("维吾尔自治区", "").str.replace("自治区", "")
    # 分组计数
    df_num = df1.groupby("province")["province"].agg(count="count")
    df_province = df_num.index.values.tolist()
    df_count = df_num["count"].values.tolist()

    # 初始化配置
    map = Map(init_opts=opts.InitOpts(width="800px", height="400px"))
    # 中国地图
    map.add("", [list(z) for z in zip(df_province, df_count)], "china")
    # 设置全局配置项,标题、工具箱(下载图片)、颜色图例
    map.set_global_opts(title_opts=opts.TitleOpts(title="抖音大V省份分布情况", pos_left="center", pos_top="0"),
                        toolbox_opts=opts.ToolboxOpts(is_show=True, feature={"saveAsImage": {}}),
                        # 设置数值范围0-600,is_piecewise标签值连续
                        visualmap_opts=opts.VisualMapOpts(max_=600, is_piecewise=False))
    map.render("抖音大V省份分布情况.html")
def create_city(df):
    df1 = df[df["country"] == "中国"]
    df1 = df1.copy()
    df1["city"] = df1["city"].str.replace("市", "")

    df_num = df1.groupby("city")["city"].agg(count="count").reset_index().sort_values(by="count", ascending=False)
    df_city = df_num[:10]["city"].values.tolist()
    df_count = df_num[:10]["count"].values.tolist()

    bar = Bar(init_opts=opts.InitOpts(width="800px", height="400px"))
    bar.add_xaxis(df_city)
    bar.add_yaxis("", df_count)
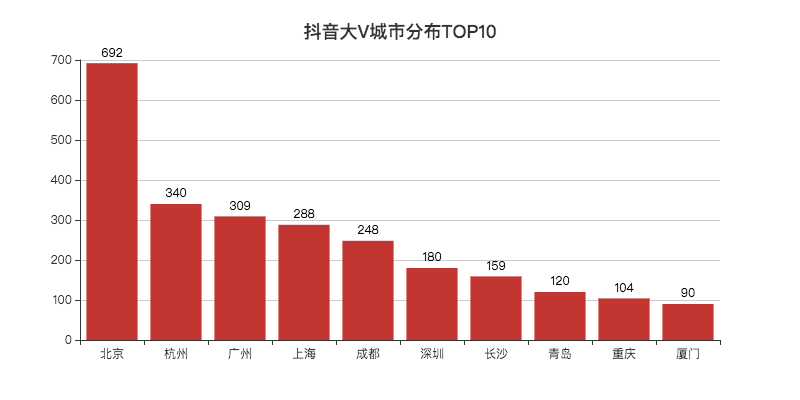
    bar.set_global_opts(title_opts=opts.TitleOpts(title="抖音大V城市分布TOP10", pos_left="center", pos_top="18"),
                        toolbox_opts=opts.ToolboxOpts(is_show=True, feature={"saveAsImage": {}}),
                        yaxis_opts=opts.AxisOpts(splitline_opts=opts.SplitLineOpts(is_show=True)))
    bar.set_series_opts(label_opts=opts.LabelOpts(is_show=True, position="top", color="black"))
    bar.render("抖音大V城市分布TOP10.html")
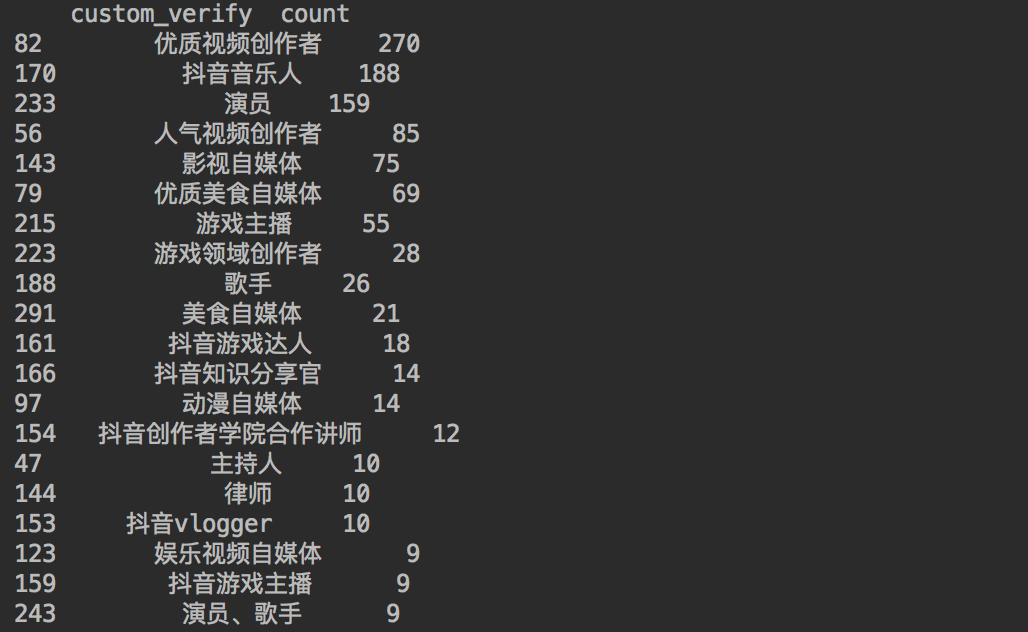
df1 = df[(df["custom_verify"] != "") & (df["custom_verify"] != "未知")]
df1 = df1.copy()
df_num = df1.groupby("custom_verify")["custom_verify"].agg(count="count").reset_index().sort_values(by="count", ascending=False)
print(df_num[:20])

def create_wordcloud(df, picture):
    words = pd.read_csv('chineseStopWords.txt', encoding='gbk', sep='\t', names=['stopword'])
    # 分词
    text = ''
    df1 = df[df["signature"] != ""]
    df1 = df1.copy()
    for line in df1['signature']:
        text += ' '.join(jieba.cut(str(line).replace(" ", ""), cut_all=False))
    # 停用词
    stopwords = set('')
    stopwords.update(words['stopword'])
    backgroud_Image = plt.imread('douyin.png')
    # 使用抖音背景色
    alice_coloring = np.array(Image.open(r"douyin.png"))
    image_colors = ImageColorGenerator(alice_coloring)
    wc = WordCloud(
        background_color='white',
        mask=backgroud_Image,
        font_path='方正兰亭刊黑.TTF',
        max_words=2000,
        max_font_size=70,
        min_font_size=1,
        prefer_horizontal=1,
        color_func=image_colors,
        random_state=50,
        stopwords=stopwords,
        margin=5
    )
    wc.generate_from_text(text)
    # 看看词频高的有哪些
    process_word = WordCloud.process_text(wc, text)
    sort = sorted(process_word.items(), key=lambda e: e[1], reverse=True)
    print(sort[:50])
    plt.imshow(wc)
    plt.axis('off')
    wc.to_file(picture)
    print('生成词云成功!')

评论
