在华为云上安装高可用 K8S + KubeSphere
随着多云多集群的场景越来越丰富,在各个云厂商环境部署 KubeSphere 的需求随之升高。由于各云厂商的云资源使用规则和菜单导航栏各不相同,会使用户花大量时间去排错。为降低部署过程错误率,本教程使用华为云平台部署一套高可用的 KubeSphere,希望可以帮助大家提高部署体验。
一、部署前期准备
所需环境的资源满足以下条件即可:
| 华为云产品 | 数量 | 用途 |
|---|---|---|
| ECS 云服务器 | 6 | master、node |
| VPC | 1 | 可用区 |
| ELB | 2 | 负载均衡 |
| 安全组 | 1 | 出入口管控 |
| 公网 IP | 7 | 外网访问 |
二、云平台资源初始化
1. 创建 VPC
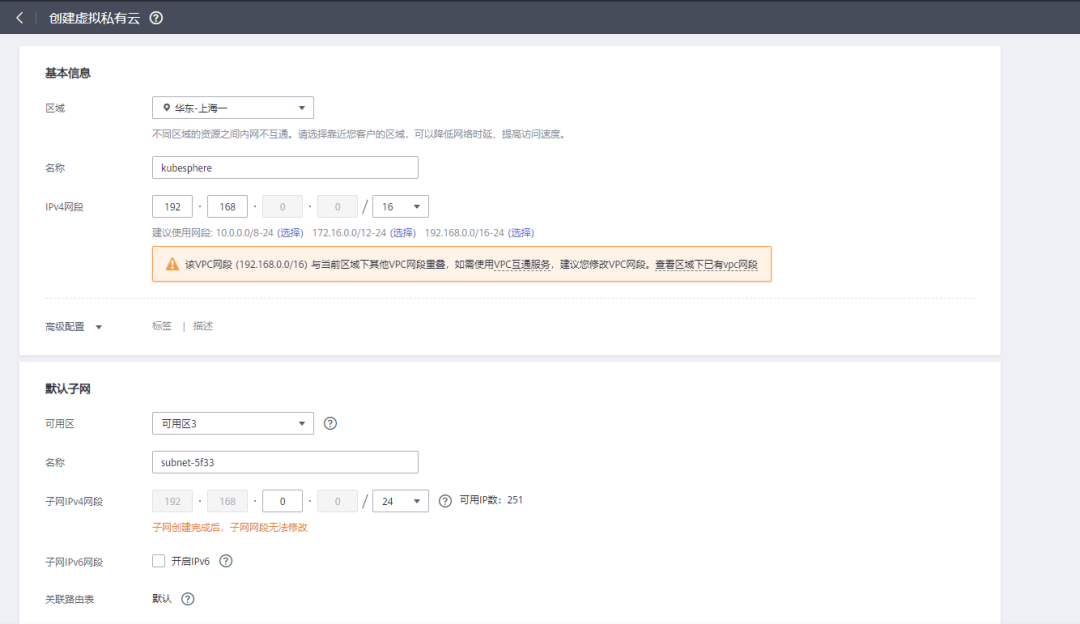
进入到华为云控制,在左侧列表选择「虚拟私有云」,选择「创建虚拟私有云」创建 VPC,配置如下图:
2. 创建安全组
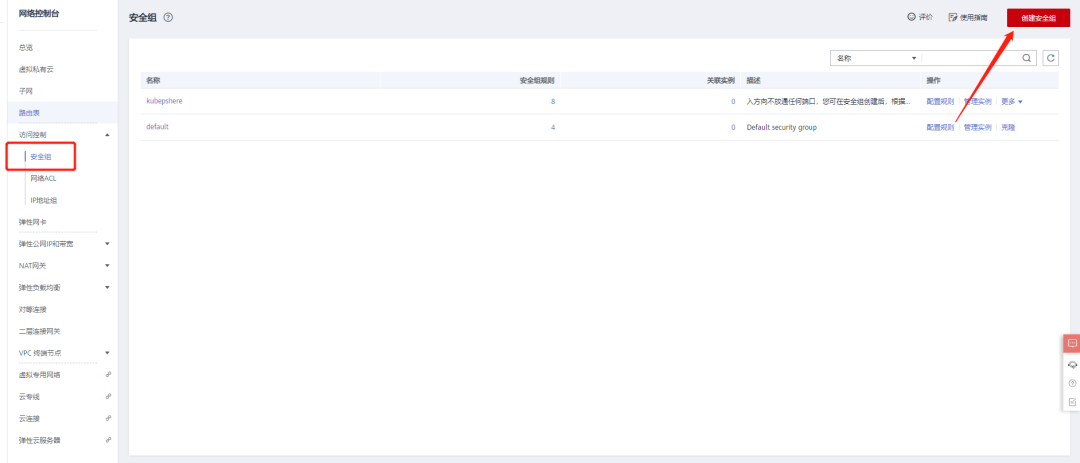
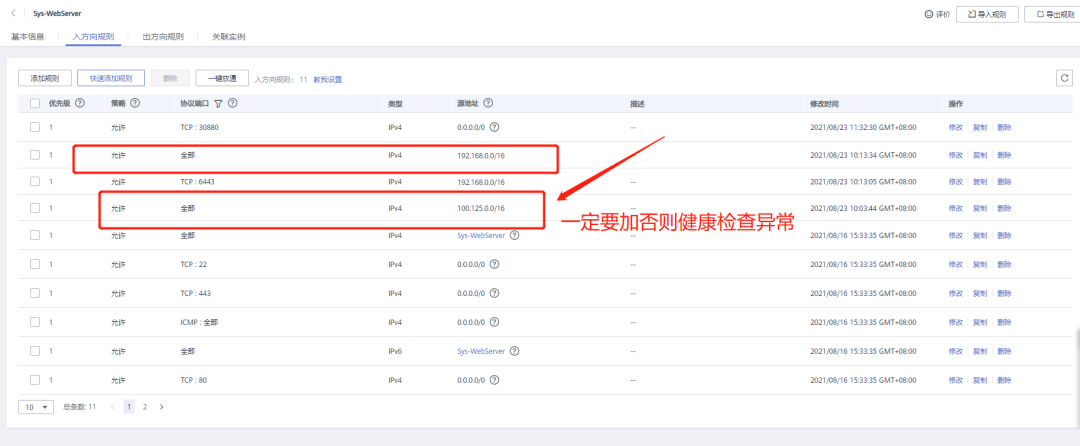
创建一个安全组,设置入方向的规则、关联实例参考如下:

3. 创建实例
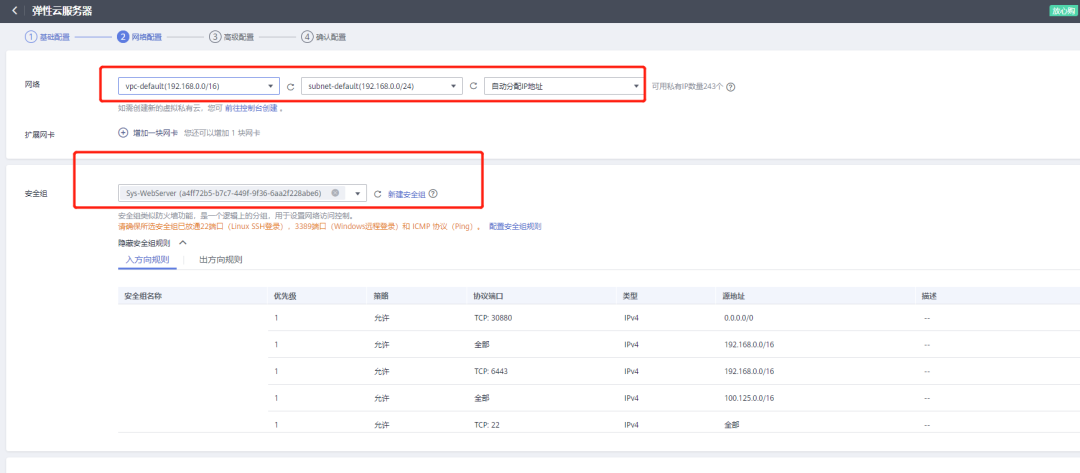
在网络配置中,网络选择第一步创建的 VPC 和子网。在安全组中,选择上一步创建的安全组。
4. 创建负载均衡器(创建内外两个)
内网 ELB
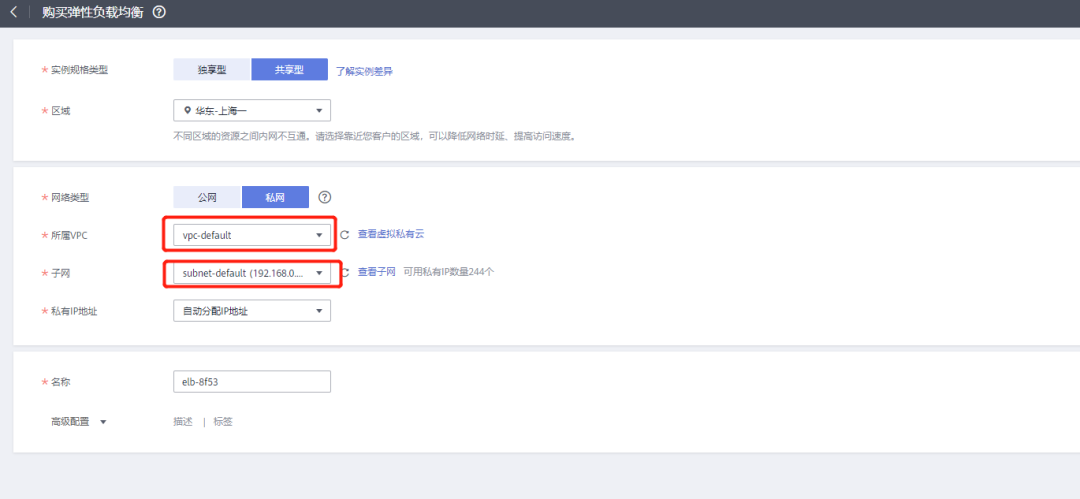

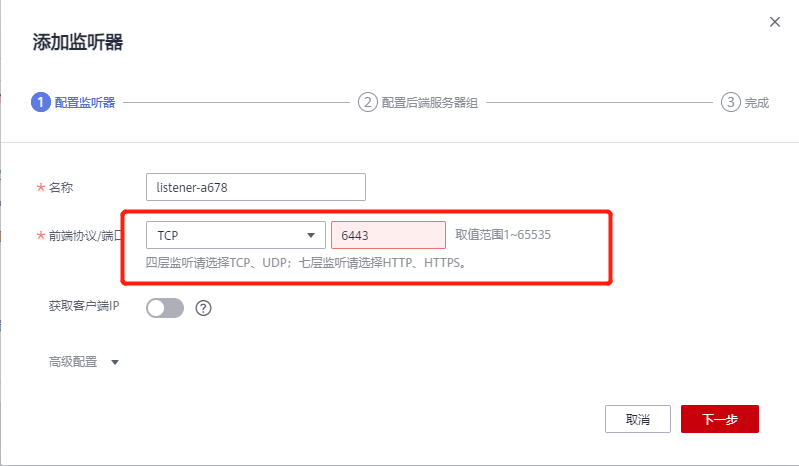
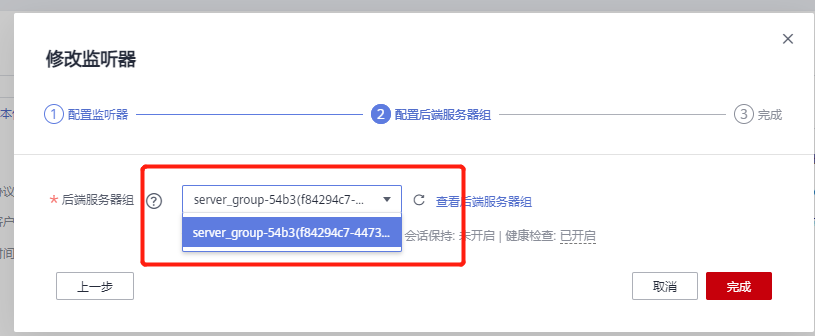
外网 ELB
若集群需要配置公网访问,则需要为外网负载均衡器配置一个公网 IP 为所有节点添加后端监听器,监听端口为 80(测试使用 30880 端口,此处 80 端口也需要在安全组中开放)。
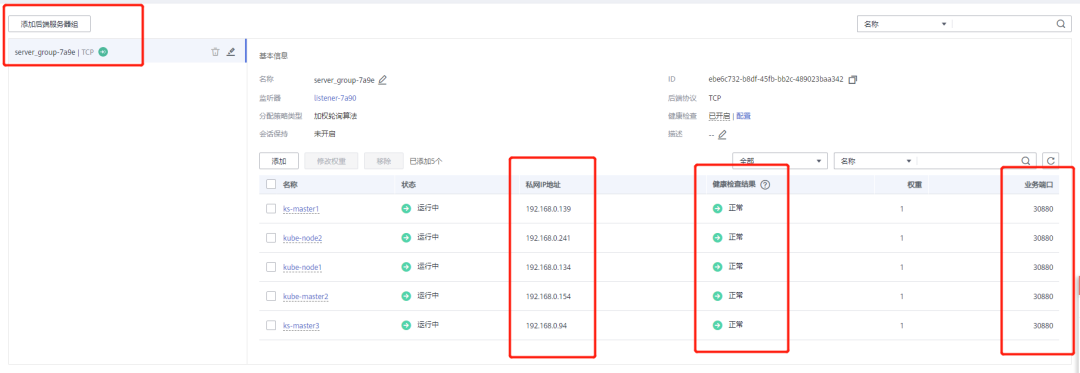
后面配置文件 config.yaml 需要配置在前面创建的内网 SLB 分配的地址(VIP)
 controlPlaneEndpoint:
   domain: lb.kubesphere.local
   address: "192.168.0.205"
   port: "6443"
部署 KubeSphere 平台
1. 下载 KK
$ curl -sfL https://get-kk.kubesphere.io | VERSION=v1.1.1 sh -
2. 添加执行权限
$ chmod +x kk
3. 使用 kubekey 部署
$ ./kk create config --with-kubesphere v3.1.1 --with-kubernetes v1.17.9 -f master-HA.yaml
4. 集群配置调整
apiVersion: kubekey.kubesphere.io/v1alpha1
kind: Cluster
metadata:
  name: master-HA
spec:
  hosts:
  - {name: master1, address: 192.168.1.10, internalAddress: 192.168.1.10, password: yourpassword} # Assume that the default port for SSH is 22, otherwise add the port number after the IP address as above
  - {name: master2, address: 192.168.1.11, internalAddress: 192.168.1.11, password: yourpassword} # Assume that the default port for SSH is 22, otherwise add the port number after the IP address as above
  - {name: master3, address: 192.168.1.12, internalAddress: 192.168.1.12, password: yourpassword} # Assume that the default port for SSH is 22, otherwise add the port number after the IP address as above
  - {name: node1, address:  192.168.1.13, internalAddress: 192.168.1.13, password: yourpassword} # Assume that the default port for SSH is 22, otherwise add the port number after the IP address as above
  - {name: node2, address: 192.168.1.14, internalAddress: 192.168.1.14, password: yourpassword} # Assume that the default port for SSH is 22SSH is 22, otherwise add the port number after the IP address as above
  - {name: node3, address: 192.168.1.15, internalAddress: 192.168.1.15, password: yourpassword} # Assume that the default port for SSH is 22, otherwise add the port number after the IP address as above
  roleGroups:
    etcd:
     - master[1:3]
    master:
     - master[1:3]
    worker:
     - node[1:3]
  controlPlaneEndpoint:
    domain: lb.kubesphere.local
    address: "192.168.1.8"
    port: "6443"
  kubernetes:
    version: v1.17.9
    imageRepo: kubesphere
    clusterName: cluster.local
    masqueradeAll: false  # masqueradeAll tells kube-proxy to SNAT everything if using the pure iptables proxy mode. [Default: false]
    maxPods: 110  # maxPods is the number of pods that can run on this Kubelet. [Default: 110]
    nodeCidrMaskSize: 24  # internal network node size allocation. This is the size allocated to each node on your network. [Default: 24]
    proxyMode: ipvs  # mode specifies which proxy mode to use. [Default: ipvs]
  network:
    plugin: calico
    calico:
      ipipMode: Always  # IPIP Mode to use for the IPv4 POOL created at start up. If set to a value other than Never, vxlanMode should be set to "Never". [Always | CrossSubnet | Never] [Default: Always]
      vxlanMode: Never  # VXLAN Mode to use for the IPv4 POOL created at start up. If set to a value other than Never, ipipMode should be set to "Never". [Always | CrossSubnet | Never] [Default: Never]
      vethMTU: 1440  # The maximum transmission unit (MTU) setting determines the largest packet size that can be transmitted through your network. [Default: 1440]
    kubePodsCIDR: 10.233.64.0/18
    kubeServiceCIDR: 10.233.0.0/18
  registry:
    registryMirrors: ["https://*.mirror.aliyuncs.com"] # # input your registryMirrors
    insecureRegistries: []
    privateRegistry: ""
  storage:
    defaultStorageClass: localVolume
    localVolume:
      storageClassName: local

---
apiVersion: installer.kubesphere.io/v1alpha1
kind: ClusterConfiguration
metadata:
  name: ks-installer
  namespace: kubesphere-system
  labels:
    version: v3.1.1
spec:
  local_registry: ""
  persistence:
    storageClass: ""
  authentication:
    jwtSecret: ""
  etcd:
    monitoring: true        # Whether to install etcd monitoring dashboard
    endpointIps: 192.168.1.10,192.168.1.11,192.168.1.12  # etcd cluster endpointIps
    port: 2379              # etcd port
    tlsEnable: true
  common:
    mysqlVolumeSize: 20Gi # MySQL PVC size
    minioVolumeSize: 20Gi # Minio PVC size
    etcdVolumeSize: 20Gi  # etcd PVC size
    openldapVolumeSize: 2Gi   # openldap PVC size
    redisVolumSize: 2Gi # Redis PVC size
    es:  # Storage backend for logging, tracing, events and auditing.
      elasticsearchMasterReplicas: 1   # total number of master nodes, it's not allowed to use even number
      elasticsearchDataReplicas: 1     # total number of data nodes
      elasticsearchMasterVolumeSize: 4Gi   # Volume size of Elasticsearch master nodes
      elasticsearchDataVolumeSize: 20Gi    # Volume size of Elasticsearch data nodes
      logMaxAge: 7                     # Log retention time in built-in Elasticsearch, it is 7 days by default.
      elkPrefix: logstash              # The string making up index names. The index name will be formatted as ks-<elk_prefix>-log
      # externalElasticsearchUrl:
      # externalElasticsearchPort:
  console:
    enableMultiLogin: false  # enable/disable multiple sing on, it allows an account can be used by different users at the same time.
    port: 30880
  alerting:                # Whether to install KubeSphere alerting system. It enables Users to customize alerting policies to send messages to receivers in time with different time intervals and alerting levels to choose from.
    enabled: true
  auditing:                # Whether to install KubeSphere audit log system. It provides a security-relevant chronological set of records,recording the sequence of activities happened in platform, initiated by different tenants.
    enabled: true
  devops:                  # Whether to install KubeSphere DevOps System. It provides out-of-box CI/CD system based on Jenkins, and automated workflow tools including Source-to-Image & Binary-to-Image
    enabled: true
    jenkinsMemoryLim: 2Gi      # Jenkins memory limit
    jenkinsMemoryReq: 1500Mi   # Jenkins memory request
    jenkinsVolumeSize: 8Gi     # Jenkins volume size
    jenkinsJavaOpts_Xms: 512m  # The following three fields are JVM parameters
    jenkinsJavaOpts_Xmx: 512m
    jenkinsJavaOpts_MaxRAM: 2g
  events:                  # Whether to install KubeSphere events system. It provides a graphical web console for Kubernetes Events exporting, filtering and alerting in multi-tenant Kubernetes clusters.
    enabled: true
  logging:                 # Whether to install KubeSphere logging system. Flexible logging functions are provided for log query, collection and management in a unified console. Additional log collectors can be added, such as Elasticsearch, Kafka and Fluentd.
    enabled: true
    logsidecarReplicas: 2
  metrics_server:                    # Whether to install metrics-server. IT enables HPA (Horizontal Pod Autoscaler).
    enabled: true
  monitoring:                        #
    prometheusReplicas: 1            # Prometheus replicas are responsible for monitoring different segments of data source and provide high availability as well.
    prometheusMemoryRequest: 400Mi   # Prometheus request memory
    prometheusVolumeSize: 20Gi       # Prometheus PVC size
    alertmanagerReplicas: 1          # AlertManager Replicas
  multicluster:
    clusterRole: none  # host | member | none  # You can install a solo cluster, or specify it as the role of host or member cluster
  networkpolicy:       # Network policies allow network isolation within the same cluster, which means firewalls can be set up between certain instances (Pods).
    enabled: true
  notification:        # It supports notification management in multi-tenant Kubernetes clusters. It allows you to set AlertManager as its sender, and receivers include Email, Wechat Work, and Slack.
    enabled: true
  openpitrix:          # Whether to install KubeSphere App Store. It provides an application store for Helm-based applications, and offer application lifecycle management
    enabled: true
  servicemesh:         # Whether to install KubeSphere Service Mesh (Istio-based). It provides fine-grained traffic management, observability and tracing, and offer visualization for traffic topology
    enabled: true
5. 执行命令创建集群
# 指定配置文件创建集群
$ ./kk create cluster --with-kubesphere v3.1.1 -f master-HA.yaml

# 查看 KubeSphere 安装日志  -- 直到出现控制台的访问地址和登录帐户
$ kubectl logs -n kubesphere-system $(kubectl get pod -n kubesphere-system -l app=ks-install -o jsonpath='{.items[0].metadata.name}') -f
#####################################################
###              Welcome to KubeSphere!           ###
#####################################################

Console: http://192.168.1.10:30880
Account: admin
Password: P@88w0rd

NOTES:
  1. After you log into the console, please check the
     monitoring status of service components in
     the "Cluster Management". If any service is not
     ready, please wait patiently until all components
     are up and running.
  2. Please change the default password after login.

#####################################################
https://kubesphere.io             2020-08-28 01:25:54
#####################################################
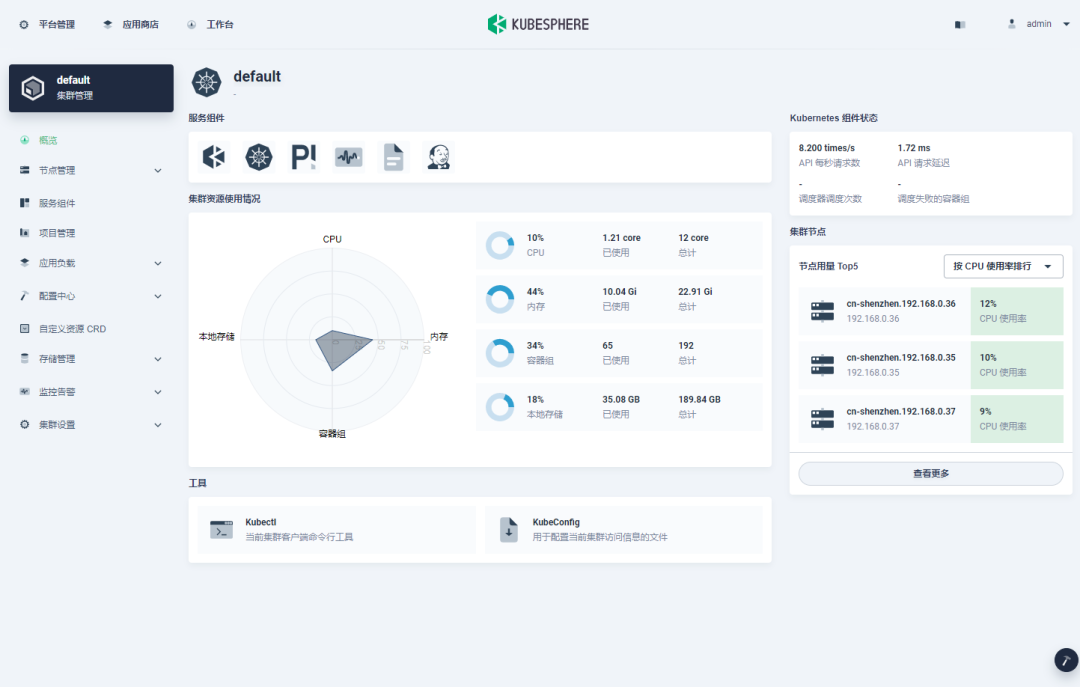
访问公网 IP + Port,使用默认帐户密码 (admin/P@88w0rd) 登录,登录成功后,点击「平台管理」 → 「集群管理」可看到组件列表和机器的详细信息。在集群概述页面中,可以看到如下图所示的仪表板。
评论
