
Python实现前向逐步回归(stepwise)
共 4136字,需浏览 9分钟
· 2024-04-12

         来源:我不爱机器学习


        本文约1200字,建议阅读5分钟
        本文为你介绍用statsmodels写的向前逐步回归的工具。
Python的statsmodels包含了一些R风格的统计模型和工具。在内部实现上,statsmodels使用patsy包将数据转化为矩阵并建立线性模型,具体信息参见pasty主页http://patsy.readthedocs.io/en/latest/overview.html。
但是,Python的statsmodels工具中没有向前逐步回归算法。逐步回归的基本思想是将变量逐个引入模型,每引入一个解释变量后都要进行F检验,并对已经选入的解释变量逐个进行t检验,当原来引入的解释变量由于后面解释变量的引入变得不再显著时,则将其删除。以确保每次引入新的变量之前回归方程中只包含显著性变量。
这是一个反复的过程,直到既没有显著的解释变量选入回归方程,也没有不显著的解释变量从回归方程中剔除为止。以保证最后所得到的解释变量集是最优的(https://baike.baidu.com/item/%E9%80%90%E6%AD%A5%E5%9B%9E%E5%BD%92/585832?fr=aladdin)。
网上有人用statsmodels写了一个向前逐步回归的工具,具体网址见https://planspace.org/20150423-forward_selection_with_statsmodels/。我试了一下,速度还不错,比我用sklearn写的要好。具体代码如下:
import statsmodels.formula.api as smfimport pandas as pddef forward_selected(data, response):"""前向逐步回归算法,源代码来自https://planspace.org/20150423-forward_selection_with_statsmodels/使用Adjusted R-squared来评判新加的参数是否提高回归中的统计显著性Linear model designed by forward selection.Parameters:-----------data : pandas DataFrame with all possible predictors and responseresponse: string, name of response column in dataReturns:--------model: an "optimal" fitted statsmodels linear modelwith an interceptselected by forward selectionevaluated by adjusted R-squared"""remaining = set(data.columns)remaining.remove(response)selected = []current_score, best_new_score = 0.0, 0.0while remaining and current_score == best_new_score:scores_with_candidates = []for candidate in remaining:formula = "{} ~ {} + 1".format(response,' + '.join(selected + [candidate]))score = smf.ols(formula, data).fit().rsquared_adjscores_with_candidates.append((score, candidate))scores_with_candidates.sort()best_new_score, best_candidate = scores_with_candidates.pop()if current_score < best_new_score:remaining.remove(best_candidate)selected.append(best_candidate)current_score = best_new_scoreformula = "{} ~ {} + 1".format(response,' + '.join(selected))model = smf.ols(formula, data).fit()return modeldef main():'''首先从网上读取普林斯顿大学52位员工的工资信息,工资文件一共有6列,各列意义解释如下:sx = Sex, coded 1 for female and 0 for malerk = Rank, coded1 for assistant professor,2 for associate professor, and3 for full professoryr = Number of years in current rankdg = Highest degree, coded 1 if doctorate, 0 if mastersyd = Number of years since highest degree was earnedsl = Academic year salary, in dollars.'''url = "http://data.princeton.edu/wws509/datasets/salary.dat"data = pd.read_csv(url, sep='\\s+')#将sl(年收入)设为目标变量model = forward_selected(data, 'sl')#打印出最后的回归模型print(model.model.formula)# sl ~ rk + yr + 1print(model.params)# Intercept 16203.268154# rk[T.associate] 4262.284707# rk[T.full] 9454.523248# yr 375.695643# dtype: float64# 0.835190760538print(model.rsquared_adj)# 0.835190760538if __name__ == '__main__':main()
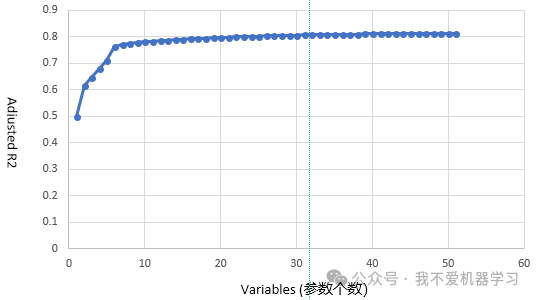
最好,该方法也有缺点。随着模型中参数增多,Adjusted R-squared的增加不太明显,所以后来加的很多参数对模型的影响不大。
下面是在我自己的数据集(包含98个参数)上做的测试图,我们看到,当参数个数多于7个时,再增加参数,模型的R2并不能显著增加,所以最终模型取前7个参数即可。
作者:carlwu
链接:https://blog.csdn.net/carlwu/article/details/80017560
编辑:黄继彦