让你的单细胞数据动起来!|iCellR(二)
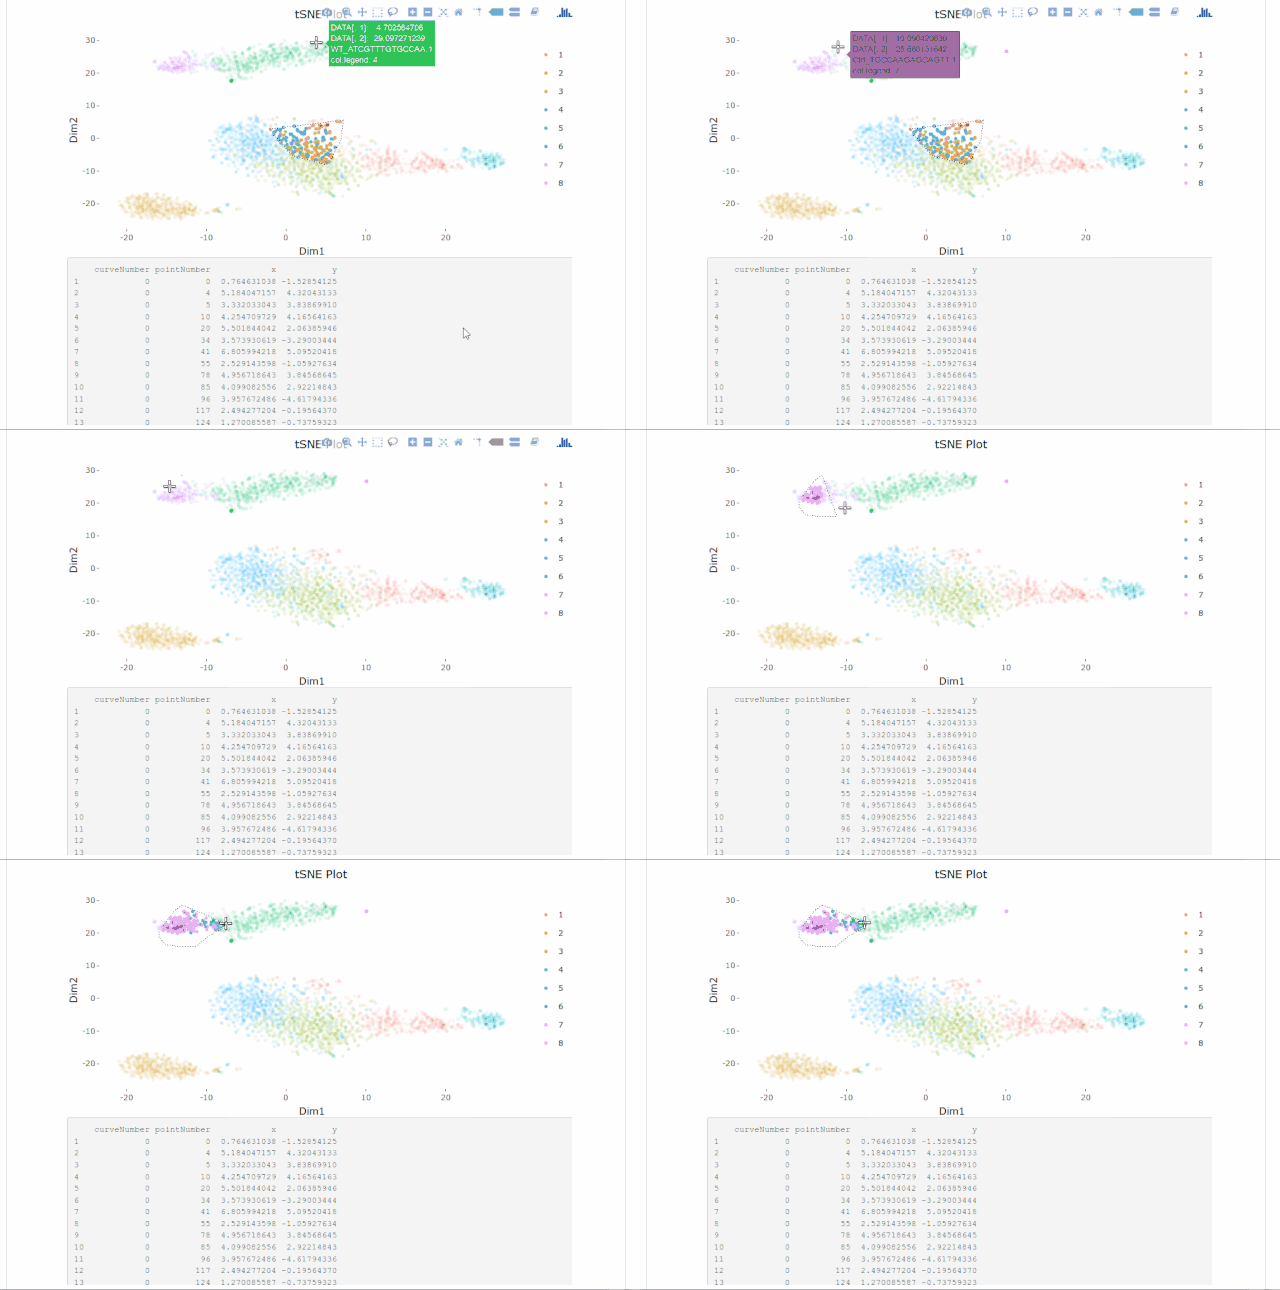
前情回顾:让你的单细胞数据动起来!|iCellR(一)
在上文我们已经基本完成了聚类分析和细胞在不同条件下的比例分析,下面继续开始啦,让你看看iCellR的强大!
1. 每个cluster的平均表达量
my.obj <- clust.avg.exp(my.obj)

head(my.obj@clust.avg)
#      gene   cluster_1   cluster_2  cluster_3 cluster_4   cluster_5   cluster_6
#1     A1BG 0.072214723 0.092648973 0.08258609         0 0.027183115 0.072291636
#2 A1BG.AS1 0.014380756 0.003280237 0.01817982         0 0.000000000 0.011545546
#3     A1CF 0.000000000 0.000000000 0.00000000         0 0.000000000 0.000000000
#4      A2M 0.000000000 0.000000000 0.00000000         0 0.007004131 0.004672857
#5  A2M.AS1 0.003520828 0.039985296 0.00876364         0 0.056596203 0.018445562
#6    A2ML1 0.000000000 0.000000000 0.00000000         0 0.000000000 0.000000000
#   cluster_7  cluster_8   cluster_9
#1 0.09058946 0.04466827 0.027927923
#2 0.00000000 0.01534541 0.005930566
#3 0.00000000 0.00000000 0.000000000
#4 0.00000000 0.00000000 0.003411938
#5 0.00000000 0.00000000 0.000000000
#6 0.00000000 0.00000000 0.000000000
保存object
save(my.obj, file = "my.obj.Robj")2. 寻找marker基因
marker.genes <- findMarkers(my.obj,
    fold.change = 2,
    padjval = 0.1)   # 筛选条件

dim(marker.genes)
# [1] 1070   17

head(marker.genes)
#                row   baseMean    baseSD AvExpInCluster AvExpInOtherClusters
#LRRN3         LRRN3 0.01428477 0.1282046     0.05537243          0.003437002
#LINC00176 LINC00176 0.06757573 0.2949763     0.21404151          0.028906516
#FHIT           FHIT 0.10195359 0.3885343     0.31404936          0.045957058
#TSHZ2         TSHZ2 0.04831334 0.2628778     0.14300998          0.023311970
#CCR7           CCR7 0.28132627 0.6847417     0.81386444          0.140728033
#SCGB3A1     SCGB3A1 0.06319598 0.3554273     0.18130557          0.032013232
#          foldChange log2FoldChange         pval         padj clusters
#LRRN3      16.110677       4.009945 1.707232e-06 2.847662e-03        1
#LINC00176   7.404611       2.888424 4.189197e-16 7.117446e-13        1
#FHIT        6.833539       2.772633 1.576339e-19 2.681353e-16        1
#TSHZ2       6.134616       2.616973 8.613622e-10 1.455702e-06        1
#CCR7        5.783243       2.531879 1.994533e-42 3.400679e-39        1
#SCGB3A1     5.663457       2.501683 2.578484e-07 4.313805e-04        1
#               gene  cluster_1   cluster_2   cluster_3 cluster_4   cluster_5
#LRRN3         LRRN3 0.05537243 0.004102916 0.002190847         0 0.010902326
#LINC00176 LINC00176 0.21404151 0.016772401 0.005203161         0 0.009293024
#FHIT           FHIT 0.31404936 0.008713243 0.022934924         0 0.035701186
#TSHZ2         TSHZ2 0.14300998 0.008996236 0.009444180         0 0.000000000
#CCR7           CCR7 0.81386444 0.075719109 0.034017494         0 0.021492756
#SCGB3A1     SCGB3A1 0.18130557 0.039644151 0.001183264         0 0.000000000
#            cluster_6  cluster_7   cluster_8   cluster_9
#LRRN3     0.002087831 0.00000000 0.000000000 0.012113258
#LINC00176 0.086762509 0.01198777 0.003501552 0.003560614
#FHIT      0.104189143 0.04144293 0.041064681 0.007218861
#TSHZ2     0.065509372 0.01690584 0.002352707 0.015350123
#CCR7      0.272580821 0.06523324 0.257130255 0.031304151
#SCGB3A1   0.078878071 0.01198777 0.000000000 0.043410608

# baseMean: average expression in all the cells 所有细胞的平均表达值
# baseSD: Standard Deviation 标准偏差
# AvExpInCluster: average expression in cluster number (see clusters) 该cluster中的平均表达值
# AvExpInOtherClusters: average expression in all the other clusters  在所有其他cluster的平均表达值
# foldChange: AvExpInCluster/AvExpInOtherClusters  表达差异倍数
# log2FoldChange: log2(AvExpInCluster/AvExpInOtherClusters) 取表达差异倍数的log2的值
# pval: P value
# padj: Adjusted P value
# clusters: marker for cluster number
# gene: marker gene for the cluster cluster的marker gene
# the rest are the average expression for each cluster3. 绘制基因表达情况
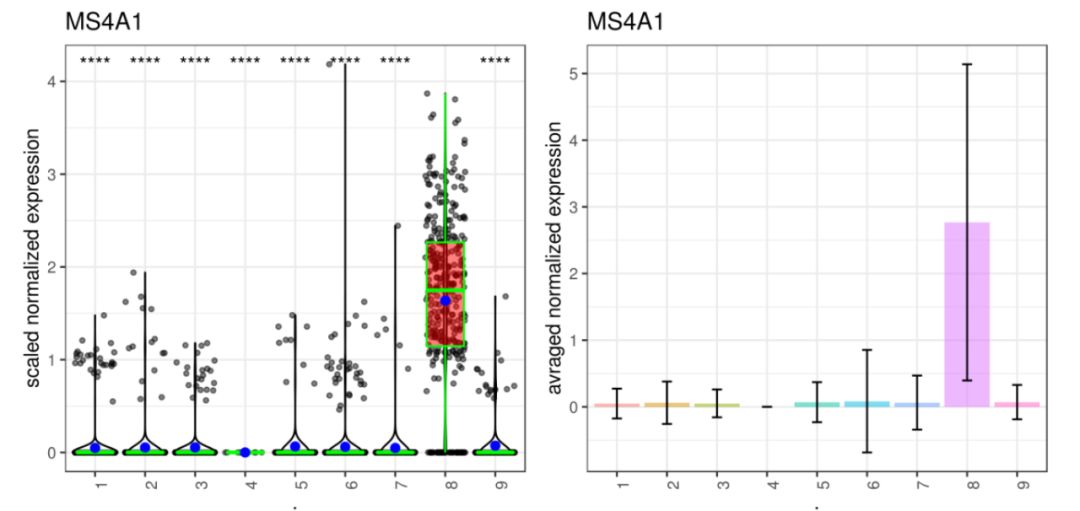
基因MS4A1:tSNE 2D,PCA 2D展示该基因在两种降维方式下,每个组的平均表达分布图。Box Plot和Bar plot展示了该基因在每个簇中的表达箱线图和条形图
# tSNE 2D
A <- gene.plot(my.obj, gene = "MS4A1",
    plot.type = "scatterplot",
    interactive = F,
    out.name = "scatter_plot")
# PCA 2D
B <- gene.plot(my.obj, gene = "MS4A1",
    plot.type = "scatterplot",
    interactive = F,
    out.name = "scatter_plot",
    plot.data.type = "pca")

# Box Plot
C <- gene.plot(my.obj, gene = "MS4A1",
    box.to.test = 0,
    box.pval = "sig.signs",
    col.by = "clusters",
    plot.type = "boxplot",
    interactive = F,
    out.name = "box_plot")

# Bar plot (to visualize fold changes)
D <- gene.plot(my.obj, gene = "MS4A1",
    col.by = "clusters",
    plot.type = "barplot",
    interactive = F,
    out.name = "bar_plot")

library(gridExtra)
grid.arrange(A,B,C,D) # 4个图合并展示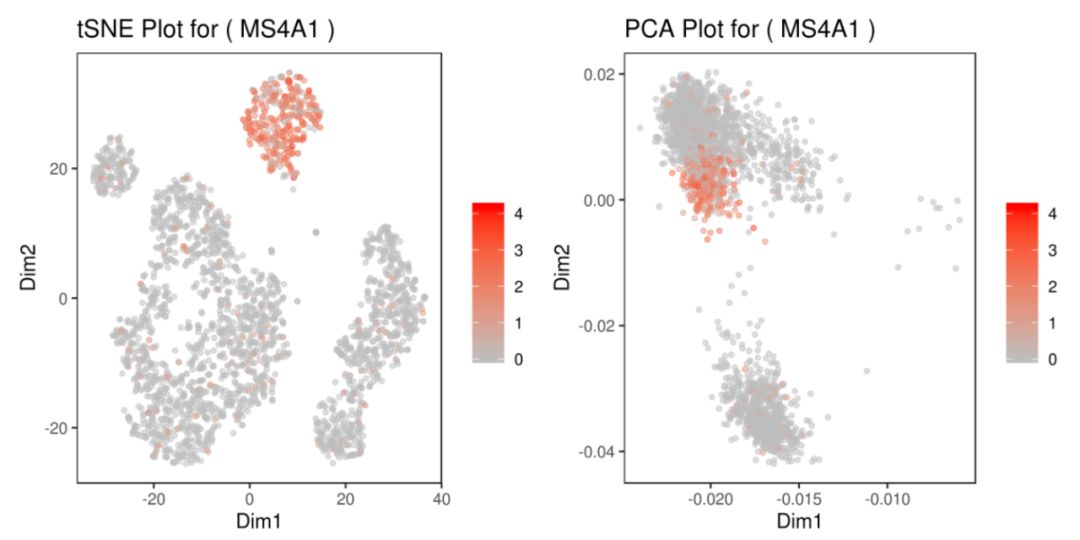
展示多个基因的plots:
genelist = c("PPBP","LYZ","MS4A1","GNLY","LTB","NKG7","IFITM2","CD14","S100A9")
###
for(i in genelist){
    MyPlot <- gene.plot(my.obj, gene = i,
        interactive = F,
        plot.data.type = "umap",
        cell.transparency = 1)
    NameCol=paste("PL",i,sep="_")
    eval(call("<-", as.name(NameCol), MyPlot))
}
###
library(cowplot)
filenames <- ls(pattern="PL_")
plot_grid(plotlist=mget(filenames[1:9]))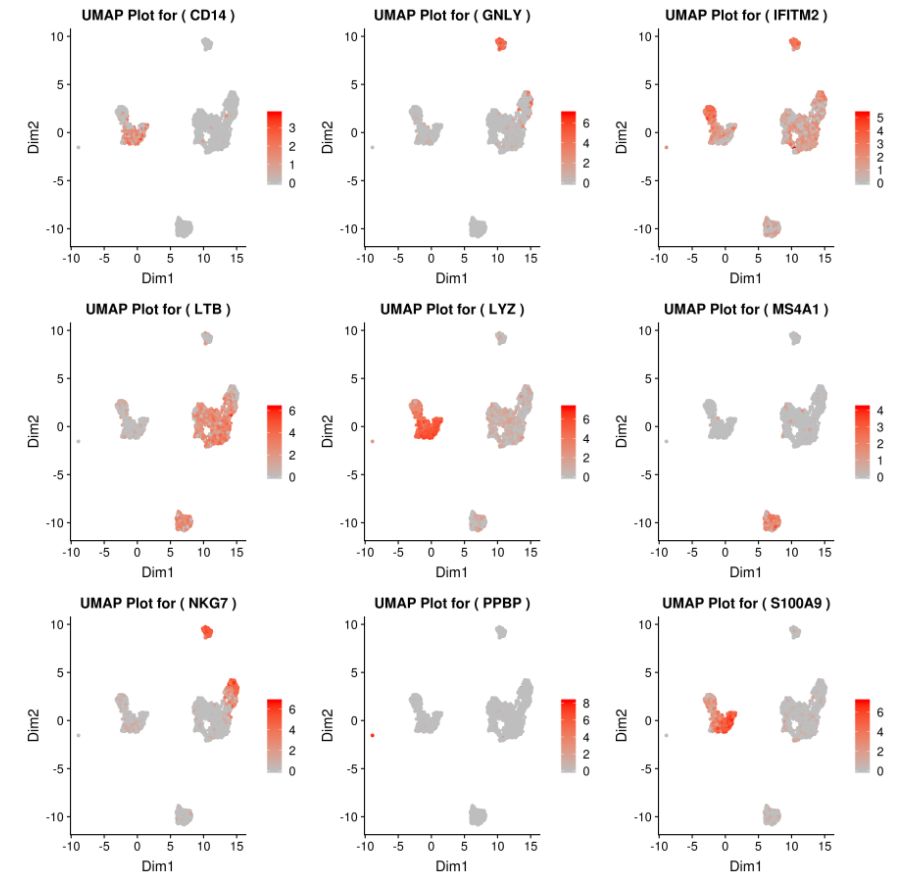
热图分析:
# 获取top10高变基因
MyGenes <- top.markers(marker.genes, topde = 10, min.base.mean = 0.2,filt.ambig = F)
MyGenes <- unique(MyGenes)
# plot
heatmap.gg.plot(my.obj, gene = MyGenes, interactive = T, out.name = "plot", cluster.by = "clusters")
# or
heatmap.gg.plot(my.obj, gene = MyGenes, interactive = F, cluster.by = "clusters")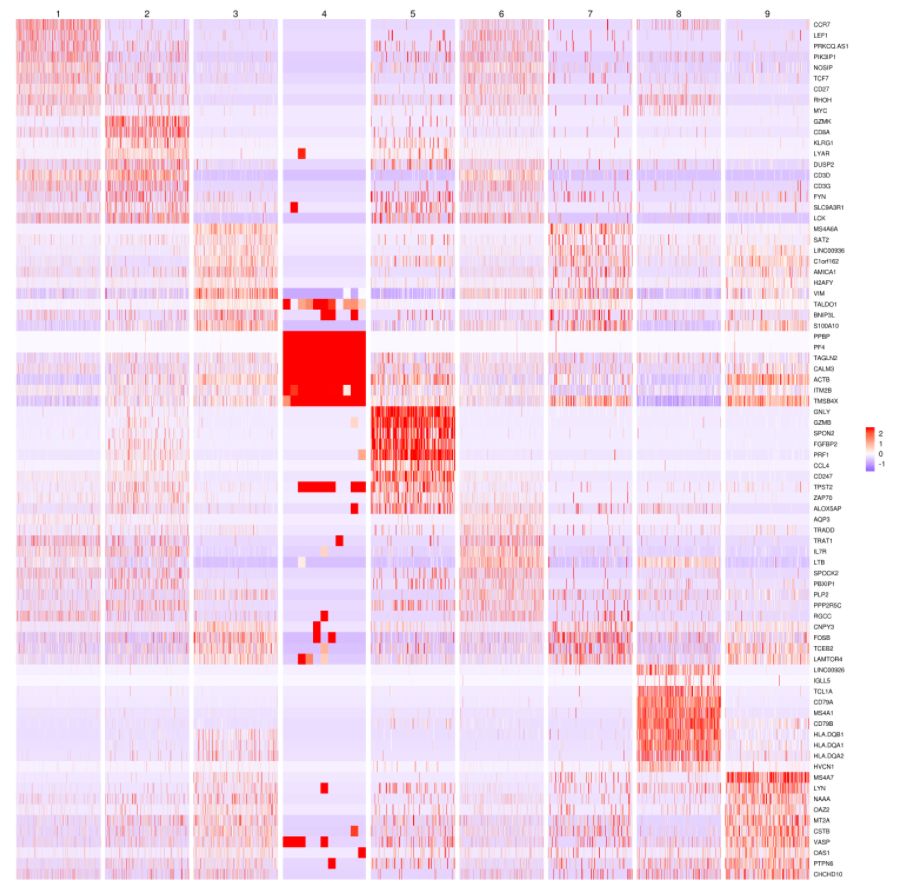
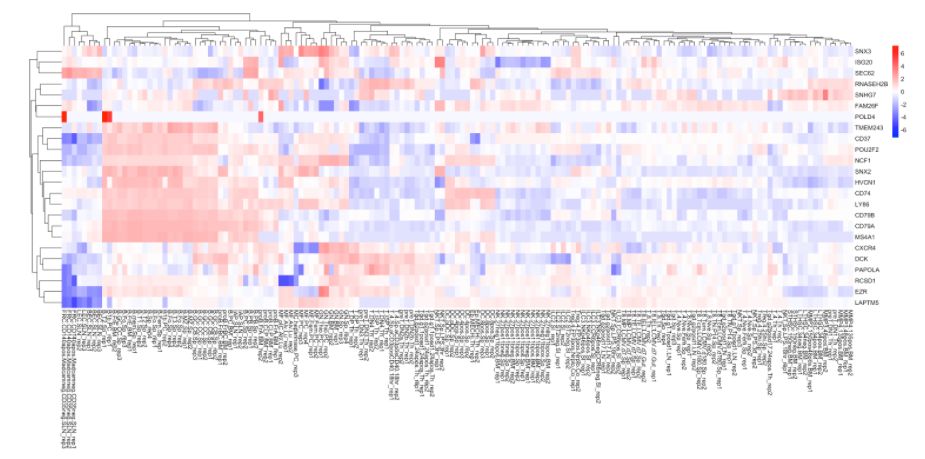
4. 使用ImmGen进行细胞类型预测
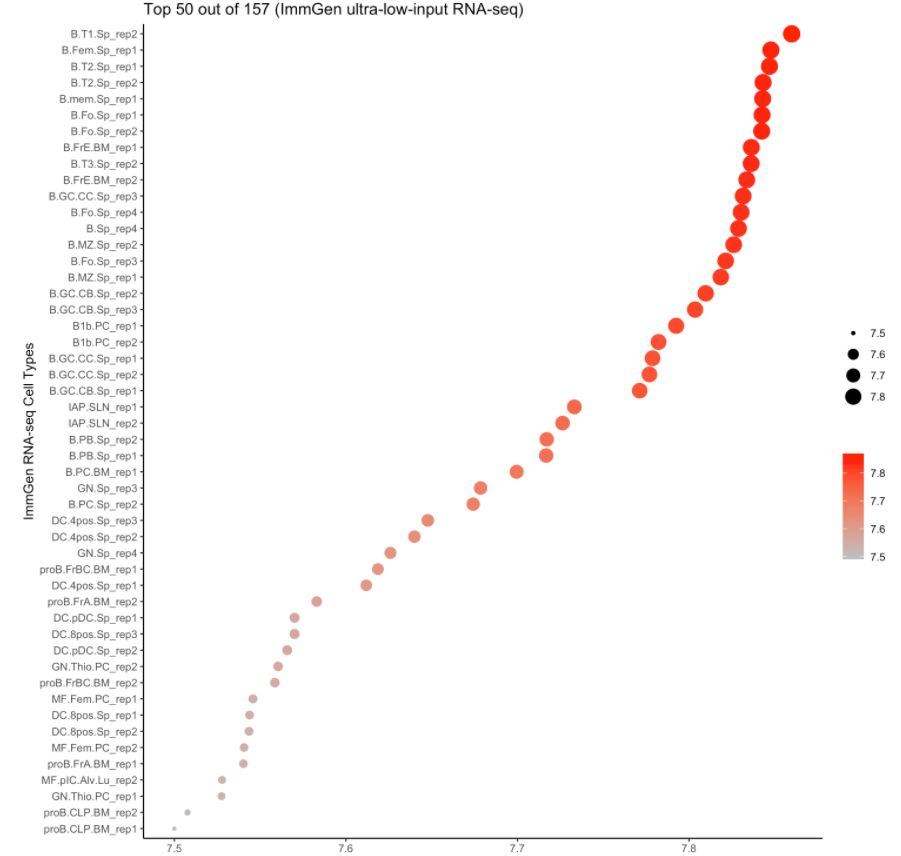
注意:ImmGen是小鼠基因组数据,此处的样本数据是人的。对于157个ULI-RNA-Seq(Ultra-low-input RNA-seq)样本,使用的metadata是:
https://github.com/rezakj/scSeqR/blob/dev/doc/uli_RNA_metadat.txt
# 绘制cluster8中top40基因(平均表达值最小为0.2)在不同细胞的表达分布图
Cluster = 8
MyGenes <- top.markers(marker.genes, topde = 40, min.base.mean = 0.2, cluster = Cluster)
# 画图
cell.type.pred(immgen.data = "rna", gene = MyGenes, plot.type = "point.plot")
# and
cell.type.pred(immgen.data = "uli.rna", gene = MyGenes, plot.type = "point.plot", top.cell.types = 50)
# or
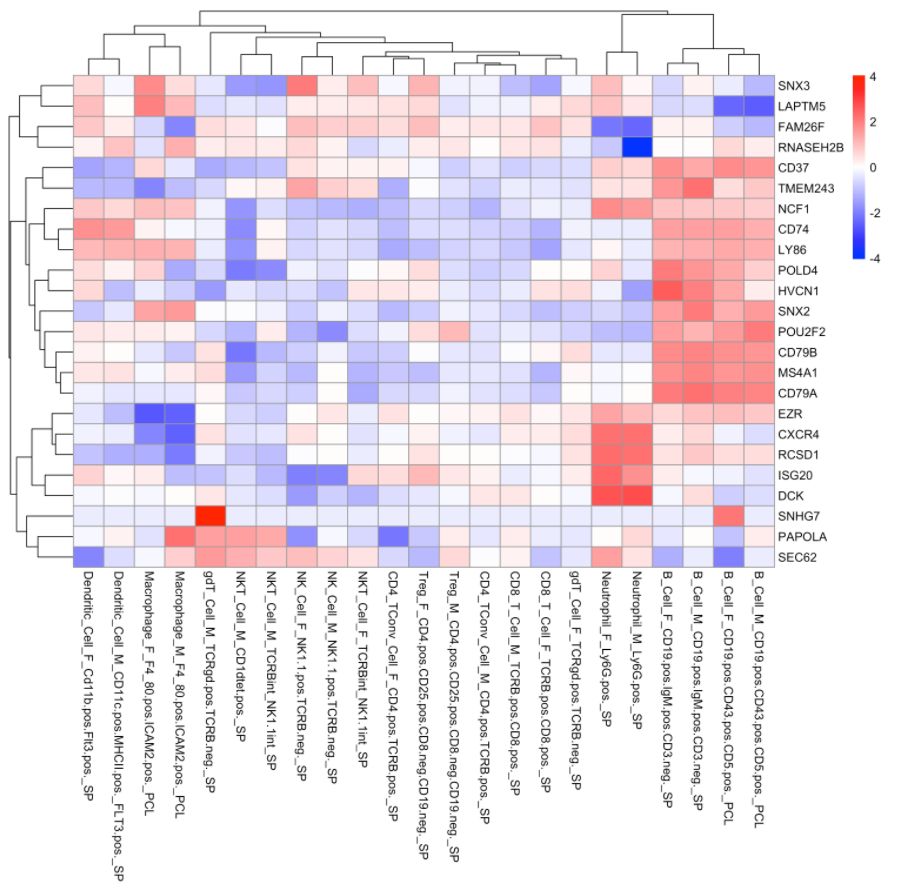
cell.type.pred(immgen.data = "rna", gene = MyGenes, plot.type = "heatmap")
# and
cell.type.pred(immgen.data = "uli.rna", gene = MyGenes, plot.type = "heatmap")

# And finally check the genes in the cells and find the common ones to predict
# heatmap.gg.plot(my.obj, gene = MyGenes, interactive = F, cluster.by = "clusters")

# 可以看出来cluster 8更像B细胞!# for tissue type prediction use this:
#cell.type.pred(immgen.data = "mca", gene = MyGenes, plot.type = "point.plot")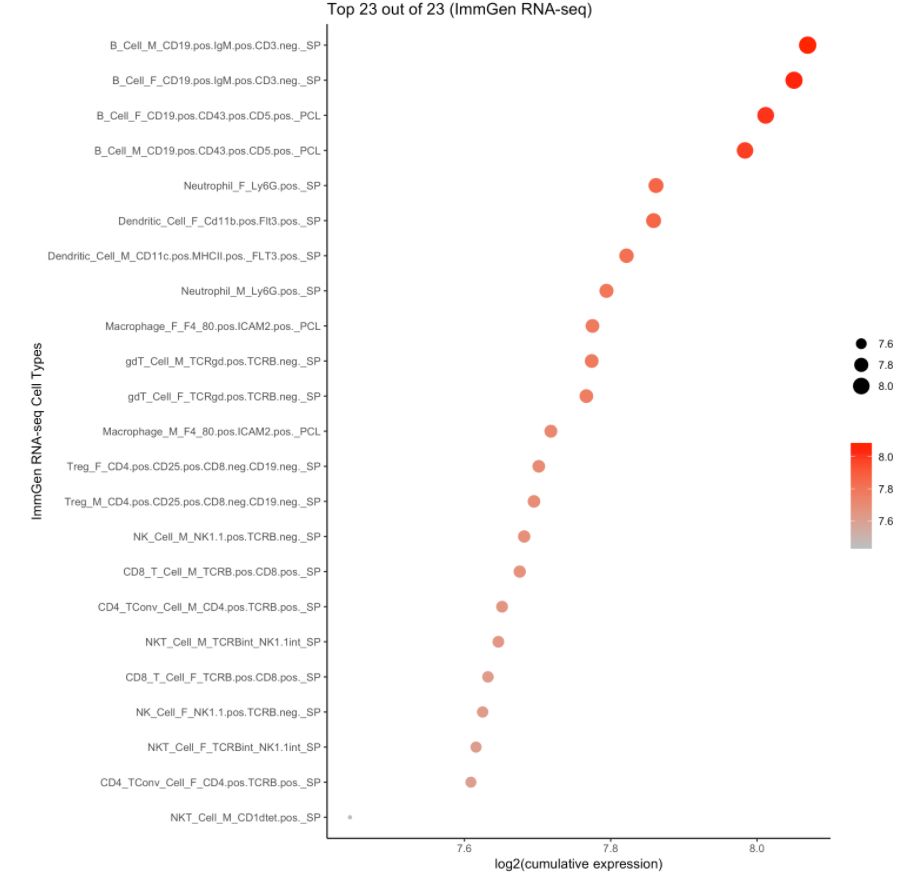
5. Pathway analysis
# cluster7的KEGG Pathway
# pathways.kegg(my.obj, clust.num = 7)
# this function is being improved and soon will be available 这个函数还要改进,很快就能用了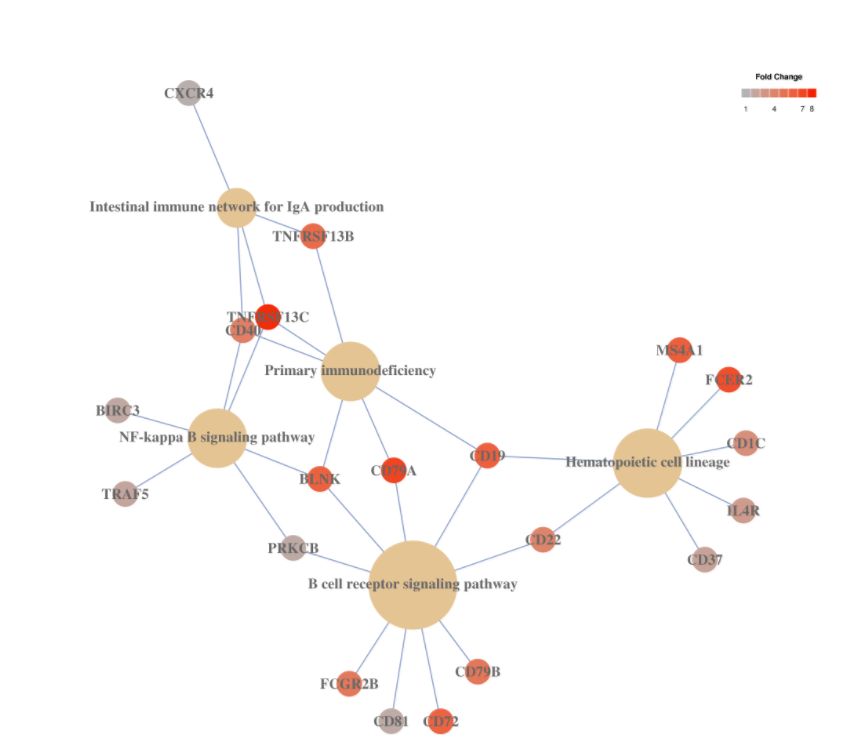
对cluster进行QC:
clust.stats.plot(my.obj, plot.type = "box.mito", interactive = F)  # 每个cluster中细胞的线粒体基因分布图
clust.stats.plot(my.obj, plot.type = "box.gene", interactive = F)  # 每个cluster中细胞的基因分布图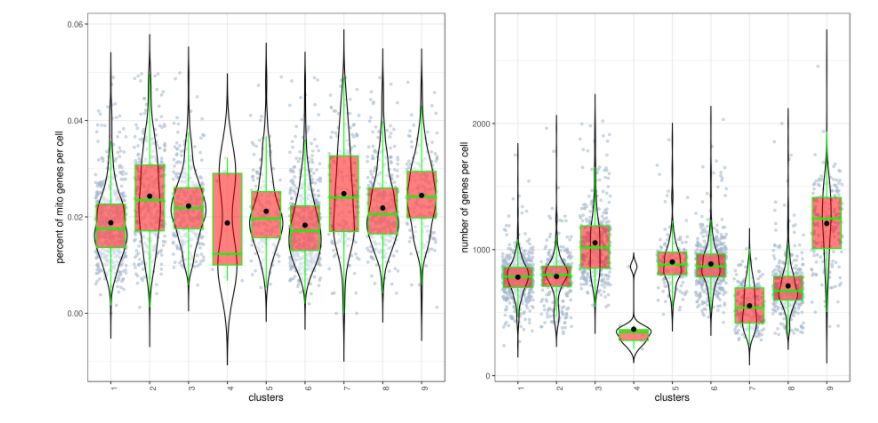
6. 差异表达分析
diff.res <- run.diff.exp(my.obj, de.by = "clusters", cond.1 = c(1,4), cond.2 = c(2))  # cluster之间的比较得到差异表达基因
diff.res1 <- as.data.frame(diff.res)
diff.res1 <- subset(diff.res1, padj < 0.05)   # 筛选padj < 0.05的基因
head(diff.res1)
#             baseMean        1_4           2 foldChange log2FoldChange         pval
#AAK1       0.19554589 0.26338228 0.041792762 0.15867719      -2.655833 8.497012e-33
#ABHD14A    0.09645732 0.12708519 0.027038379 0.21275791      -2.232715 1.151865e-11
#ABHD14B    0.19132829 0.23177944 0.099644572 0.42991118      -1.217889 3.163623e-09
#ABLIM1     0.06901900 0.08749258 0.027148089 0.31029018      -1.688310 1.076382e-06
#AC013264.2 0.07383608 0.10584821 0.001279649 0.01208947      -6.370105 1.291674e-19
#AC092580.4 0.03730859 0.05112053 0.006003441 0.11743700      -3.090041 5.048838e-07
                   padj
#AAK1       1.294690e-28
#ABHD14A    1.708446e-07
#ABHD14B    4.636290e-05
#ABLIM1     1.540087e-02
#AC013264.2 1.950557e-15
#AC092580.4 7.254675e-03

# more examples 注意参数“de.by”设置的是不同差异比较方式
diff.res <- run.diff.exp(my.obj, de.by = "conditions", cond.1 = c("WT"), cond.2 = c("KO"))  #  WT vs KO
diff.res <- run.diff.exp(my.obj, de.by = "clusters", cond.1 = c(1,4), cond.2 = c(2))  # cluster 1 and 2 vs. 4
diff.res <- run.diff.exp(my.obj, de.by = "clustBase.condComp", cond.1 = c("WT"), cond.2 = c("KO"), base.cond = 1)  #  cluster 1 WT vs cluster 1 KO
diff.res <- run.diff.exp(my.obj, de.by = "condBase.clustComp", cond.1 = c(1), cond.2 = c(2), base.cond = "WT") # cluster 1 vs cluster 2 but only the WT sample
画差异表达基因的火山图和MA图:
# Volcano Plot
volcano.ma.plot(diff.res,
    sig.value = "pval",
    sig.line = 0.05,
    plot.type = "volcano",
    interactive = F)

# MA Plot
volcano.ma.plot(diff.res,
    sig.value = "pval",
    sig.line = 0.05,
    plot.type = "ma",
    interactive = F)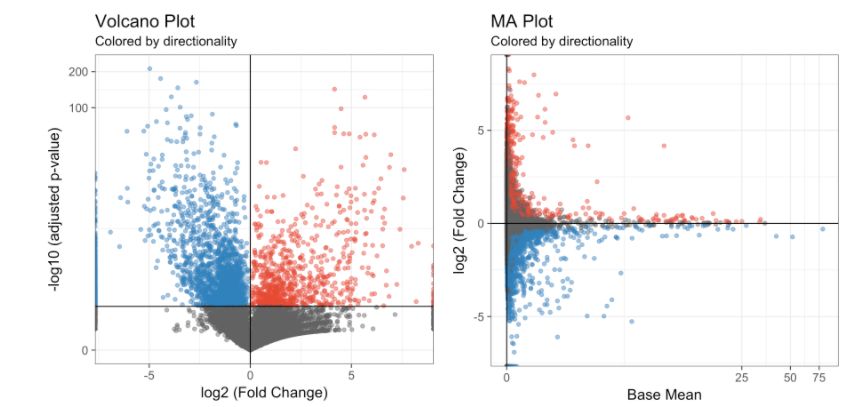
7. 合并,重置,重命名和删除cluster
# 如果你想要合并cluster 2和cluster 3
my.obj <- change.clust(my.obj, change.clust = 3, to.clust = 2)

# 重置为原来的分类
my.obj <- change.clust(my.obj, clust.reset = T)

# 可以将cluster7编号重命名为细胞类型-"B Cell".
my.obj <- change.clust(my.obj, change.clust = 7, to.clust = "B Cell")

# 删除cluster1
my.obj <- clust.rm(my.obj, clust.to.rm = 1)

# 进行tSNE对细胞重新定位
my.obj <- run.tsne(my.obj, clust.method = "gene.model", gene.list = "my_model_genes.txt")

# Use this for plotting as you make the changes
cluster.plot(my.obj,
   cell.size = 1,
   plot.type = "tsne",
   cell.color = "black",
   back.col = "white",
   col.by = "clusters",
   cell.transparency = 0.5,
   clust.dim = 2,
   interactive = F)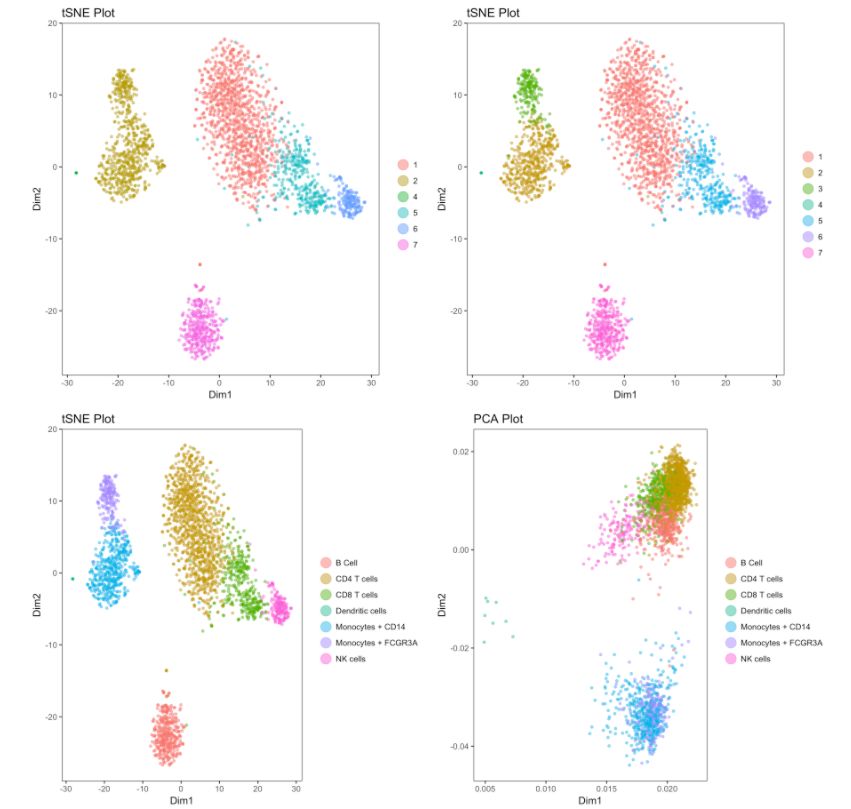
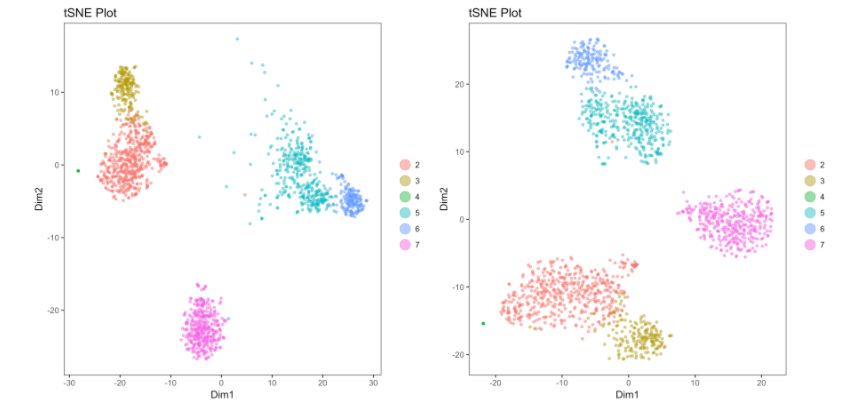
Cell gating:可以框出指定的信息
my.plot <- gene.plot(my.obj, gene = "GNLY",
  plot.type = "scatterplot",
  clust.dim = 2,
  interactive = F)

cell.gating(my.obj, my.plot = my.plot)

# or

#my.plot <- cluster.plot(my.obj,
#    cell.size = 1,
#    cell.transparency = 0.5,
#    clust.dim = 2,
#    interactive = F)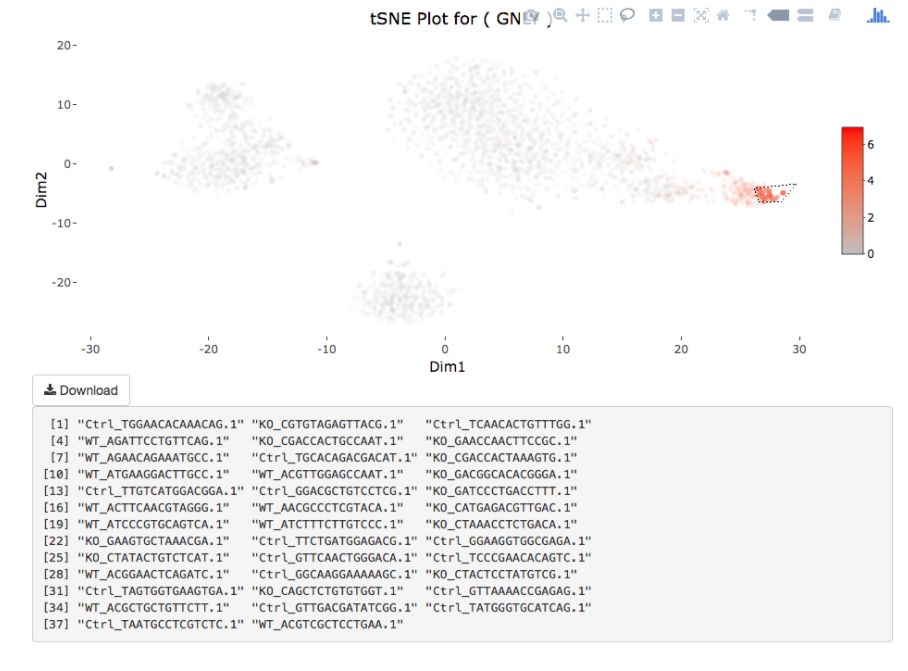
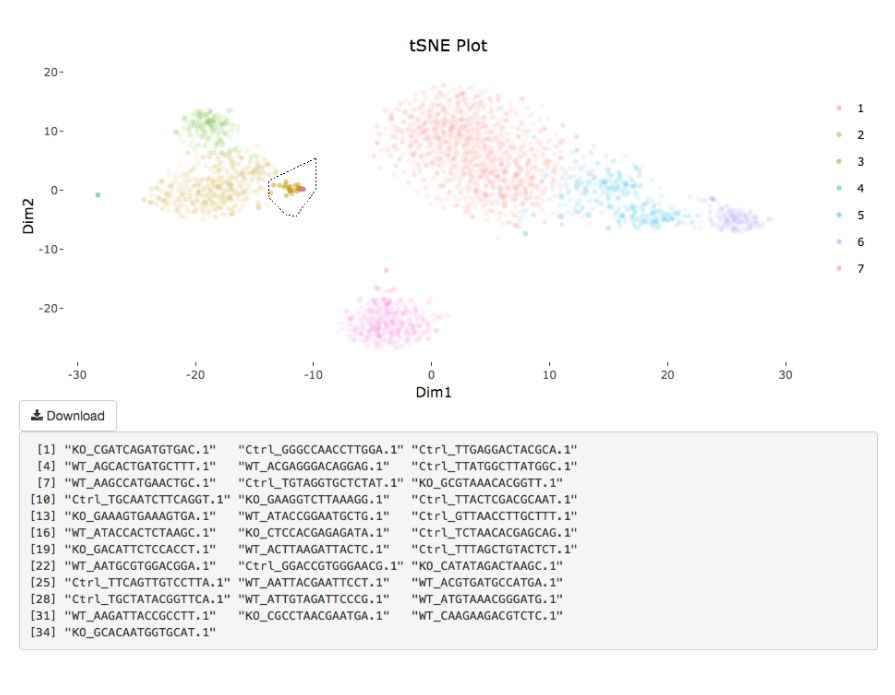
my.obj <- gate.to.clust(my.obj, my.gate = "cellGating.txt", to.clust = 10)8. 伪时序分析
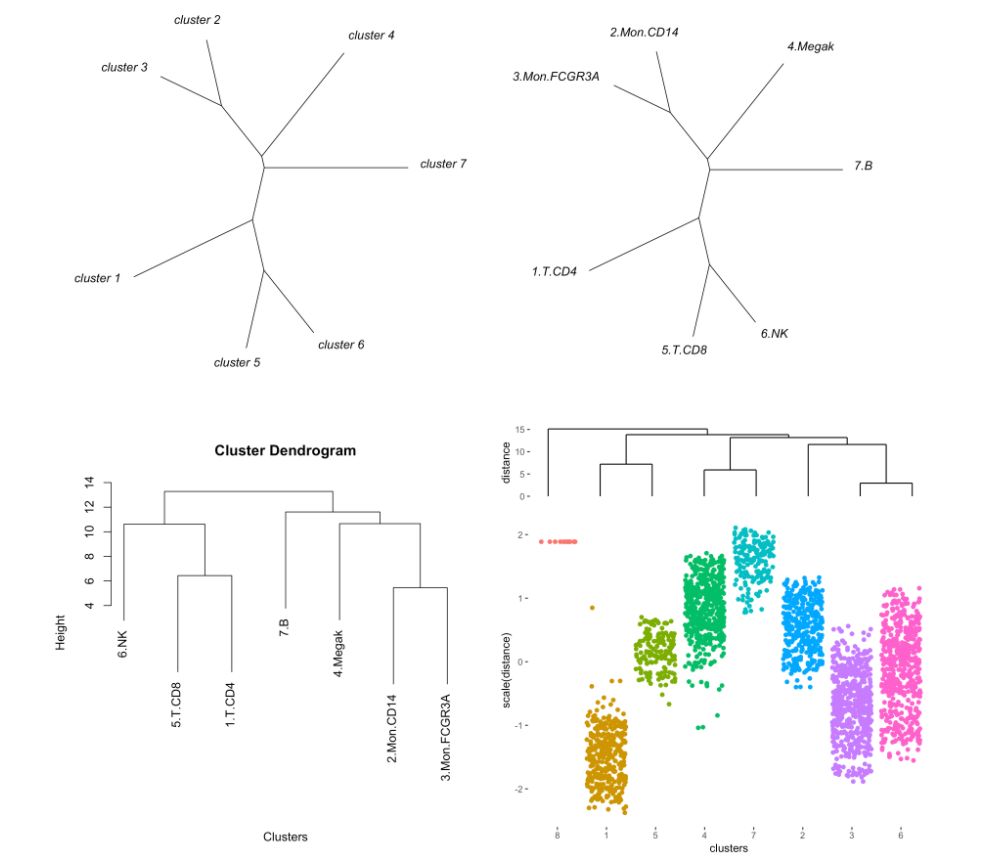
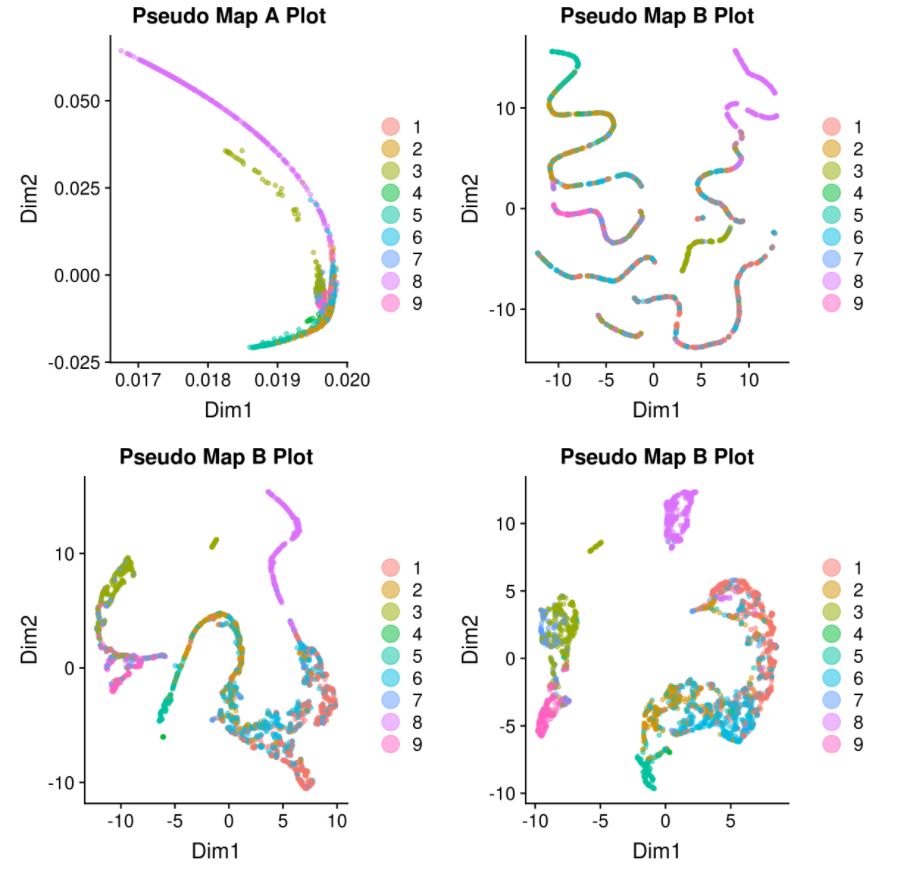
注意参数“type”
MyGenes <- top.markers(marker.genes, topde = 50, min.base.mean = 0.2)
MyGenes <- unique(MyGenes)

pseudotime.tree(my.obj,
   marker.genes = MyGenes,
   type = "unrooted",
   clust.method = "complete")

# or

pseudotime.tree(my.obj,
   marker.genes = MyGenes,
   type = "classic",
   clust.method = "complete")
9. 应用monocle进行伪时序分析
library(monocle)

MyMTX <- my.obj@main.data
GeneAnno <- as.data.frame(row.names(MyMTX))
colnames(GeneAnno) <- "gene_short_name"
row.names(GeneAnno) <- GeneAnno$gene_short_name
cell.cluster <- (my.obj@best.clust)
Ha <- data.frame(do.call('rbind', strsplit(as.character(row.names(cell.cluster)),'_',fixed=TRUE)))[1]
clusts <- paste("cl.",as.character(cell.cluster$clusters),sep="")
cell.cluster <- cbind(cell.cluster,Ha,clusts)
colnames(cell.cluster) <- c("Clusts","iCellR.Conds","iCellR.Clusts")
Samp <- new("AnnotatedDataFrame", data = cell.cluster)
Anno <- new("AnnotatedDataFrame", data = GeneAnno)
my.monoc.obj <- newCellDataSet(as.matrix(MyMTX),phenoData = Samp, featureData = Anno)

## find disperesedgenes
my.monoc.obj <- estimateSizeFactors(my.monoc.obj)
my.monoc.obj <- estimateDispersions(my.monoc.obj)
disp_table <- dispersionTable(my.monoc.obj)

unsup_clustering_genes <- subset(disp_table, mean_expression >= 0.1)
my.monoc.obj <- setOrderingFilter(my.monoc.obj, unsup_clustering_genes$gene_id)

# tSNE
my.monoc.obj <- reduceDimension(my.monoc.obj, max_components = 2, num_dim = 10,reduction_method = 'tSNE', verbose = T)
# cluster
my.monoc.obj <- clusterCells(my.monoc.obj, num_clusters = 10)

## plot conditions and clusters based on iCellR analysis
A <- plot_cell_clusters(my.monoc.obj, 1, 2, color = "iCellR.Conds")
B <- plot_cell_clusters(my.monoc.obj, 1, 2, color = "iCellR.Clusts")

## plot clusters based monocle analysis
C <- plot_cell_clusters(my.monoc.obj, 1, 2, color = "Cluster")

# get marker genes from iCellR analysis
MyGenes <- top.markers(marker.genes, topde = 30, min.base.mean = 0.2)
my.monoc.obj <- setOrderingFilter(my.monoc.obj, MyGenes)

my.monoc.obj <- reduceDimension(my.monoc.obj, max_components = 2,method = 'DDRTree')
# order cells
my.monoc.obj <- orderCells(my.monoc.obj)

# plot based on iCellR analysis and marker genes from iCellR
D <- plot_cell_trajectory(my.monoc.obj, color_by = "iCellR.Clusts")

## heatmap genes from iCellR

plot_pseudotime_heatmap(my.monoc.obj[MyGenes,],
  cores = 1,
  cluster_rows = F,
  use_gene_short_name = T,
  show_rownames = T)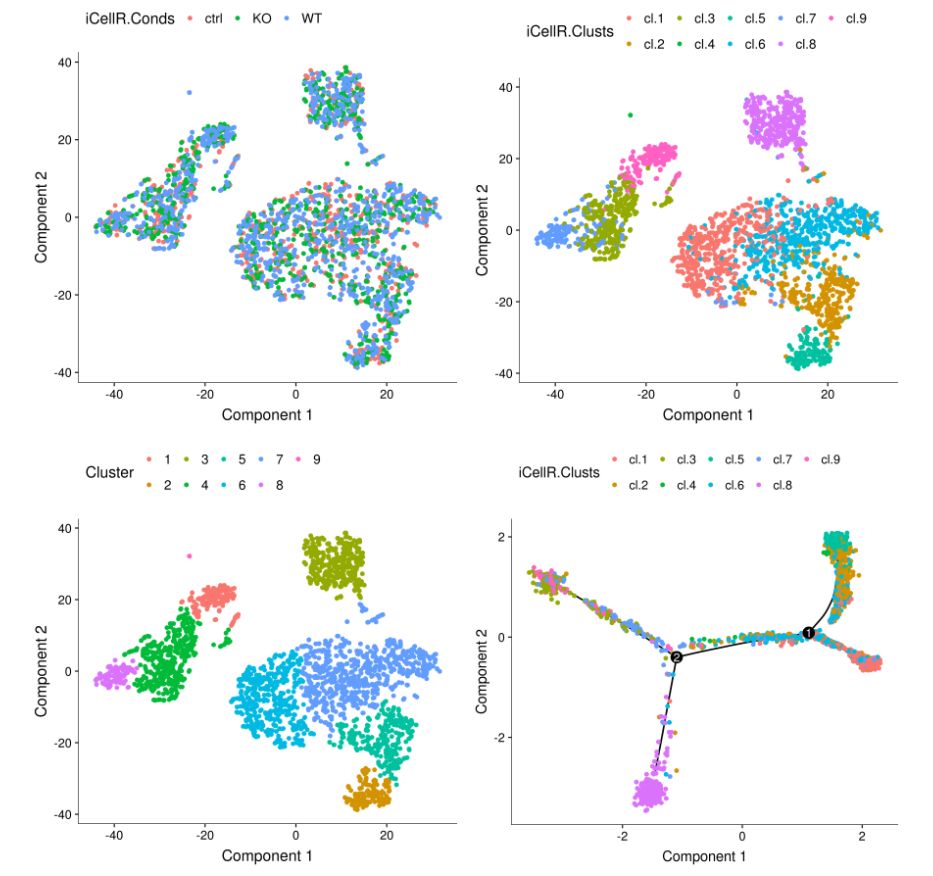
10. iCellR应用于scVDJ-seq数据
# first prepare the files.
# this function would filter the files, calculate clonotype frequencies and proportions and add conditions to the cell ids.
my.vdj.1 <- prep.vdj(vdj.data = "all_contig_annotations.csv", cond.name = "WT")
my.vdj.2 <- prep.vdj(vdj.data = "all_contig_annotations.csv", cond.name = "KO")
my.vdj.3 <- prep.vdj(vdj.data = "all_contig_annotations.csv", cond.name = "Ctrl")

# concatenate all the conditions
my.vdj.data <- rbind(my.vdj.1, my.vdj.2, my.vdj.3)

# see head of the file
head(my.vdj.data)
#  raw_clonotype_id               barcode is_cell                   contig_id
#1       clonotype1 WT_AAACCTGAGCTAACTC-1    True AAACCTGAGCTAACTC-1_contig_1
#2       clonotype1 WT_AAACCTGAGCTAACTC-1    True AAACCTGAGCTAACTC-1_contig_2
#3       clonotype1 WT_AGTTGGTTCTCGCATC-1    True AGTTGGTTCTCGCATC-1_contig_3
#4       clonotype1 WT_TGACAACCAACTGCTA-1    True TGACAACCAACTGCTA-1_contig_1
#5       clonotype1 WT_TGTCCCAGTCAAACTC-1    True TGTCCCAGTCAAACTC-1_contig_1
#6       clonotype1 WT_TGTCCCAGTCAAACTC-1    True TGTCCCAGTCAAACTC-1_contig_2
#  high_confidence length chain  v_gene d_gene  j_gene c_gene full_length
#1            True    693   TRA TRAV8-1   None  TRAJ21   TRAC        True
#2            True    744   TRB  TRBV28  TRBD1 TRBJ2-1  TRBC2        True
#3            True    647   TRA TRAV8-1   None  TRAJ21   TRAC        True
#4            True    508   TRB  TRBV28  TRBD1 TRBJ2-1  TRBC2        True
#5            True    660   TRA TRAV8-1   None  TRAJ21   TRAC        True
#6            True    770   TRB  TRBV28  TRBD1 TRBJ2-1  TRBC2        True
#  productive             cdr3                                          cdr3_nt
#1       True      CAVKDFNKFYF                TGTGCCGTGAAAGACTTCAACAAATTTTACTTT
#2       True CASSLFSGTGTNEQFF TGTGCCAGCAGTTTATTTTCCGGGACAGGGACGAATGAGCAGTTCTTC
#3       True      CAVKDFNKFYF                TGTGCCGTGAAAGACTTCAACAAATTTTACTTT
#4       True CASSLFSGTGTNEQFF TGTGCCAGCAGTTTATTTTCCGGGACAGGGACGAATGAGCAGTTCTTC
#5       True      CAVKDFNKFYF                TGTGCCGTGAAAGACTTCAACAAATTTTACTTT
#6       True CASSLFSGTGTNEQFF TGTGCCAGCAGTTTATTTTCCGGGACAGGGACGAATGAGCAGTTCTTC
#  reads umis       raw_consensus_id my.raw_clonotype_id clonotype.Freq
#1  1241    2 clonotype1_consensus_1          clonotype1            120
#2  2400    4 clonotype1_consensus_2          clonotype1            120
#3  1090    2 clonotype1_consensus_1          clonotype1            120
#4  2455    4 clonotype1_consensus_2          clonotype1            120
#5  1346    2 clonotype1_consensus_1          clonotype1            120
#6  3073    8 clonotype1_consensus_2          clonotype1            120
#  proportion total.colonotype
#1 0.04098361             1292
#2 0.04098361             1292
#3 0.04098361             1292
#4 0.04098361             1292
#5 0.04098361             1292
#6 0.04098361             1292

# add it to iCellR object
add.vdj(my.obj, vdj.data = my.vdj.data)
reference
如果想尝试一下,这里有传送门哦!
https://github.com/rezakj/iCellR
推荐阅读
学习津贴
单篇留言点赞数的第一位(点赞数至少为8)可获得我们赠送的在线基础课的9折优惠券。
越留言,越幸运。
主编会在每周选择一位最有深度的留言,评论者可获得我们赠送的任意一门在线课程的9折优惠券(偷偷告诉你,这个任意是由你选择哦)。
高颜值免费在线绘图
往期精品
后台回复“生信宝典福利第一波”或点击阅读原文获取教程合集
评论
