vue3 + element 绘制腾讯地图折线和Marker标记
近期有个关于亚运会项目的小程序,需求是做一个城市路线图,获取微信步数进行兑换里程的功能。
后端代码实现
(function(){
const vue_temp_data = {id:'',title:'',img:'',route:[],marker:[],sort:'100',status: '1',
};
appConfig.components['views/route/components/createRoute'] = Vue.defineComponent({// 在 JavaScript 中是 camelCase 的props: {name:{type: String,default:"string",}},components:{ },data:function() {return {dialogVisible:false,title: '新增',pageObj:{},cate_list:[],services_list:[],drawingManager:undefined,map:undefined,polyline:undefined,markerList:[],temp: Object.assign({},vue_temp_data),rules: {},}},computed:{get_title:function(){return this.temp.id ? '编辑':'新增'},
},mounted:function(){},methods: {
showDialog:function(item,pageObj){this.pageObj = pageObjthis.$tempDataInit(vue_temp_data, this.temp, item)this.dialogVisible = truethis.$nextTick(function(){this.initMap(item.first?item.first:{lat:0,lng:0})})},initMap(temp) {if(temp.lat && temp.lng){var latitude = temp.latvar longitude = temp.lng}else{var latitude = 39.916527var longitude = 116.397128}this.map = new qq.maps.Map(document.getElementById("container"),{center: new qq.maps.LatLng(latitude,longitude),zoom: 14});
this.drawingManager = new qq.maps.drawing.DrawingManager({drawingMode: qq.maps.drawing.OverlayType.POLYLINE,drawingControl: true,drawingControlOptions: {position: qq.maps.ControlPosition.TOP_CENTER,drawingModes: [qq.maps.drawing.OverlayType.POLYLINE]},circleOptions: {fillColor: new qq.maps.Color(255, 208, 70, 0.3),strokeColor: new qq.maps.Color(88, 88, 88, 1),strokeWeight: 3,clickable: false}});this.drawingManager.setMap(this.map);
this.$nextTick(function(){this.listeners()this.getLine()this.setMarker()this.getMarker()})},setMarker:function(){//添加监听事件 获取鼠标点击事件let that = thisqq.maps.event.addListener(this.map, 'click', function(event) {let markerName = prompt('请输入标记名称:');if(markerName){that.temp.marker.push({lat:event.latLng.lat,lng:event.latLng.lng,title:markerName})that.marker=new qq.maps.Marker({position:event.latLng,map:that.map,title:markerName});}
});},getLine:function(){var pathCoordinates = [];
this.temp.route.map(function(item) {pathCoordinates.push(new qq.maps.LatLng(item.lat, item.lng))});
this.polyline = new qq.maps.Polyline({path: pathCoordinates,strokeColor: new qq.maps.Color(0, 0, 255, 1), // 设置折线颜色strokeWeight: 3, // 设置折线宽度map: this.map // 将折线添加到地图上});},getMarker:function(){let that = thisvar pathCoordinates = [];
this.temp.marker.map(function(item) {
that.markerList.push(new qq.maps.Marker({position: new qq.maps.LatLng(item.lat, item.lng),map: that.map,title:item.title}));});
},listeners:function(){let that = thisqq.maps.event.addListener(this.drawingManager, 'overlaycomplete', function(event) {if (event.type === qq.maps.drawing.OverlayType.POLYLINE) {var path = event.overlay.getPath().getArray();var coordinates = path.map(function(point) {return {lat: point.getLat(),lng: point.getLng()};});
const new_coordinates = that.insertPointsBetween(coordinates,100)console.log(new_coordinates); // 这里输出折线的经纬度数组new_coordinates.map(function(item) {that.temp.route.push({lat:item.lat,lng:item.lng})
});
}});
},calculateDistance:function(lat1, lon1, lat2, lon2) {var R = 6371000; // 地球半径(米)var dLat = (lat2 - lat1) * Math.PI / 180;var dLon = (lon2 - lon1) * Math.PI / 180;var a = Math.sin(dLat / 2) * Math.sin(dLat / 2) +Math.cos(lat1 * Math.PI / 180) * Math.cos(lat2 * Math.PI / 180) *Math.sin(dLon / 2) * Math.sin(dLon / 2);var c = 2 * Math.atan2(Math.sqrt(a), Math.sqrt(1 - a));return R * c;},
insertPointsBetween:function (points, maxDistance) {var resultPoints = [];
for (var i = 0; i < points.length - 1; i++) {resultPoints.push(points[i]);
var lat1 = points[i].lat;var lon1 = points[i].lng;var lat2 = points[i + 1].lat;var lon2 = points[i + 1].lng;
var distance = this.calculateDistance(lat1, lon1, lat2, lon2);var numNewPoints = Math.floor(distance / maxDistance);
if (numNewPoints > 0) {for (var j = 1; j <= numNewPoints; j++) {var fraction = j / (numNewPoints + 1);var newLat = lat1 + (lat2 - lat1) * fraction;var newLng = lon1 + (lon2 - lon1) * fraction;resultPoints.push({ lat: newLat, lng: newLng });}}}
resultPoints.push(points[points.length - 1]);
return resultPoints;},
deleteRoute:function(){this.temp.route = [];this.polyline.setMap(null);},deleteMarker:function(){this.temp.marker = [];
for (var i = 0; i < this.markerList.length; i++) {this.markerList[i].setMap(null);}},closeDialog:function(e,res){this.dialogVisible = false;if(res){this.pageObj.initData()}},uploadChanged:function(file,field){this.temp[field] = file||''}
},template: `<el-dialog:title="get_title"append-to-body:close-on-click-modal="false"v-model="dialogVisible"top="1vh"width="95%"><el-form ref="form" :model="temp" label-width="120px"><el-form-item label="封面(750*750)" prop="img"><file-upload:limit="1":files="temp.img"@changed="(files)=>uploadChanged(files[0]||'','img')"/></el-form-item><el-form-item label="名称" prop="title"><el-input v-model="temp.title"></el-input></el-form-item>
<el-form-item label="路线规划" prop="route"><el-button size="small" type="primary" @click="deleteRoute">清除绘制路线</el-button><el-button size="small" type="warning" @click="deleteMarker">清除标记</el-button><div id="container" style="width:100%; height:800px"></div></el-form-item>
<el-form-item label="状态" prop="status"><el-radio v-model="temp.status" label="1" >正常</el-radio><el-radio v-model="temp.status" label="2" >关闭</el-radio></el-form-item>
</el-form>
<template #footer><el-button @click="dialogVisible=false">取 消</el-button><my-btn-submit :data="temp" :complete="closeDialog" url="/admin/db/routeModel_add"/></template>
</el-dialog>`})
})();
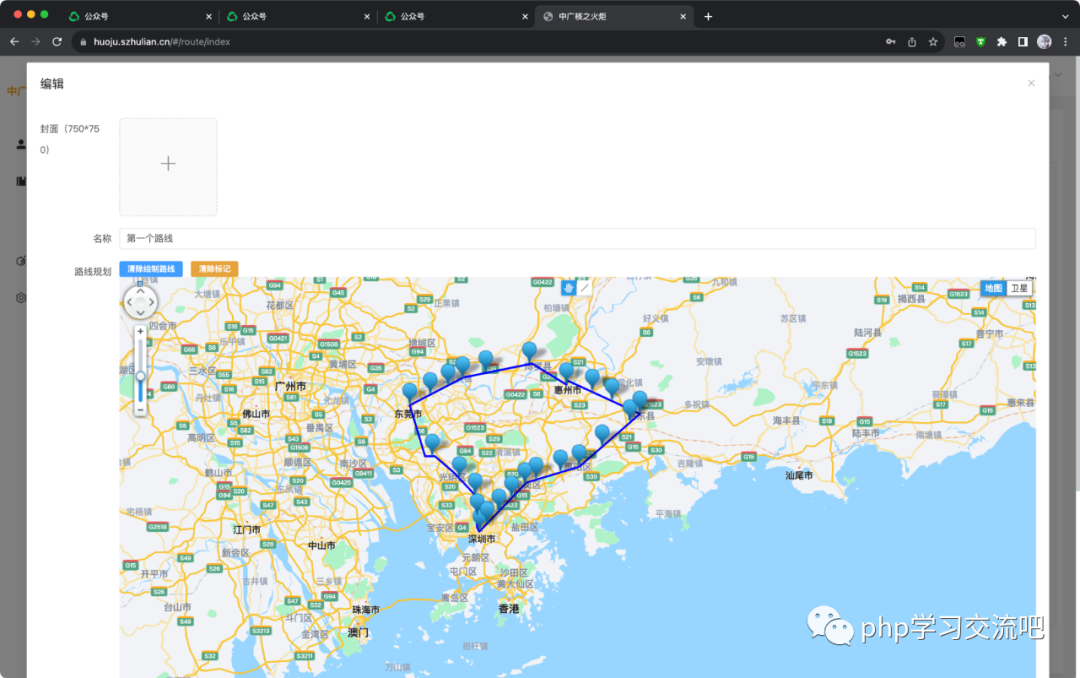
展示的效果图

uniapp 对接腾讯地图 折线显示并且获取微信步数 兑换里程功能
-
获取微信步数: 要获取微信步数,你可以使用微信提供的 API。在微信开放平台注册并获取到appid后,你可以使用JavaScript API,如wx.startRecord和wx.endRecord来记录步数。不过,这些API仅在微信内置浏览器中可用,如果你需要在其他浏览器中获取步数,你可能需要使用其他方式,例如调用微信的开放接口。
-
将步数兑换成里程: 这部分需要在你的服务器端完成。你可以创建一个兑换算法,将步数转换成相应的里程。例如,你可以设定每1000步等于1公里,那么每当用户步数达到1000时,你就将他们的步数转换为1公里。
-
在Uniapp中显示折线图: 为了在Uniapp中显示折线图,你可以使用一些图表库,如ECharts或者F2。这些库提供了强大的数据可视化能力,可以轻松地创建出各种各样的图表,包括折线图。你需要在Uniapp中引入这些库,然后使用它们来显示你的数据。
-
对接腾讯地图: 你可以使用腾讯地图的JavaScript API在Uniapp中显示地图。这部分可能需要一些额外的开发工作,因为你需要将你的折线数据(代表你的路径)显示在地图上。你可以使用腾讯地图的标绘功能来画出你的路径。
获取微信步数并在Uniapp中显示折线图的基本步骤如下:
首先,你需要引入ECharts库。在 main.js 中添加以下代码:
import * as echarts from 'echarts';Vue.prototype.$echarts = echarts
在你的组件中,你可以添加以下代码来创建一个折线图:
<template><div><div ref="chart" style="width: 100%; height: 400px;"></div></div></template><script>export default {data() {return {chartData: null,};},mounted() {this.chartData = this.initChart();},methods: {initChart() {const chartDom = this.$refs.chart;const myChart = echarts.init(chartDom);const option = {xAxis: {type: 'category',data: ['Mon', 'Tue', 'Wed', 'Thu', 'Fri', 'Sat', 'Sun'], // 这里需要根据你的实际情况来设定},yAxis: {type: 'value'},series: [{data: [820, 932, 901, 934, 1290, 1330, 1320], // 这里需要根据你的实际情况来设定type: 'line'}]};myChart.setOption(option);return myChart;}}};</script>
以上代码会创建一个简单的折线图。如果你需要获取微信步数,并将其转换为里程并显示在图上,你可能需要调用微信的开放接口或者使用其他第三方服务来获取步数,然后将步数转换为里程,并添加到你的数据中。你需要根据自己的实际情况来编写这部分代码。
