
使用Prometheus监控你的SpringBoot项目
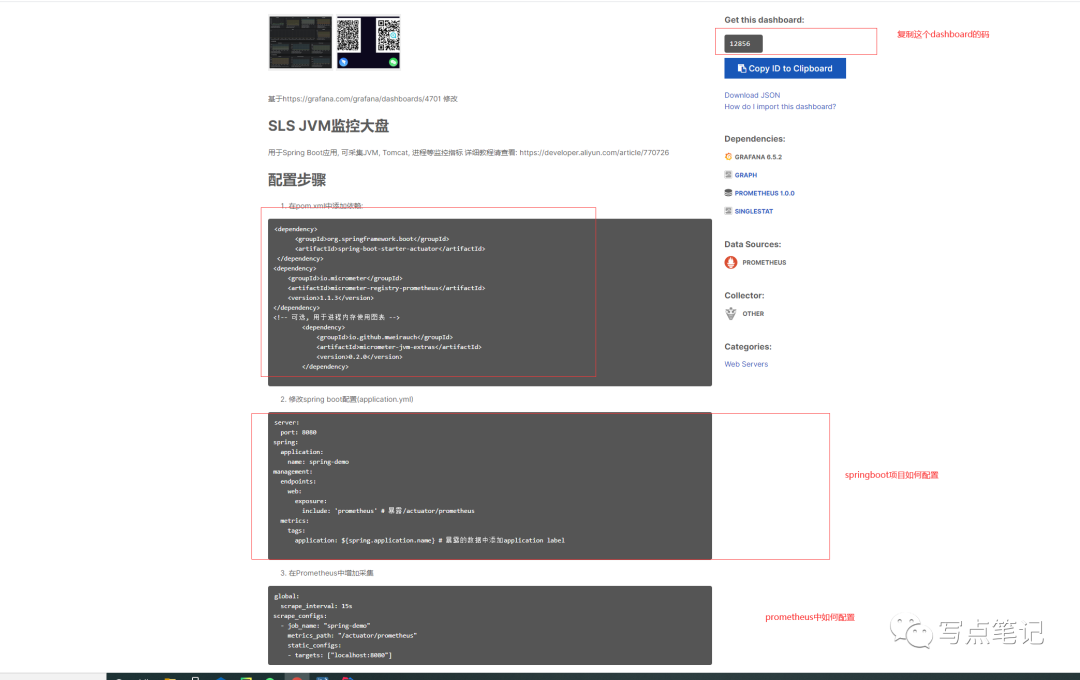
<dependency><groupId>org.springframework.boot</groupId><artifactId>spring-boot-starter-actuator</artifactId></dependency><dependency><groupId>io.micrometer</groupId><artifactId>micrometer-registry-prometheus</artifactId></dependency><dependency><groupId>io.github.mweirauch</groupId><artifactId>micrometer-jvm-extras</artifactId><version>0.2.0</version></dependency>
<dependency><groupId>org.springframework.boot</groupId><artifactId>spring-boot-starter-actuator</artifactId></dependency>
server.port=8081spring.application.name=tianjl## 暴露所有的actuator endpointsmanagement.endpoints.web.exposure.include=*## Grafana上的应用名字management.metrics.tags.application=${spring.application.name}
在配置好上述prometheus的配置之后,相当于我们配置好了内外呼应的外,那么剩下的内就是我们的prometheus了。

配置文件如下:
- job_name: 'bounter-monitor' #prometheus任务名称scrape_interval: 5s #每五秒抓取一次数据metrics_path: '/actuator/prometheus' #数据来源的地址static_configs:- targets: ['localhost:8081'] #拉去数据的地址

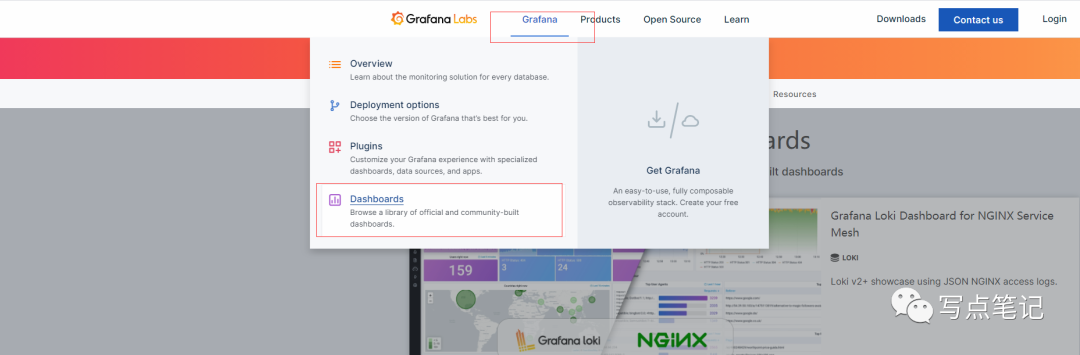
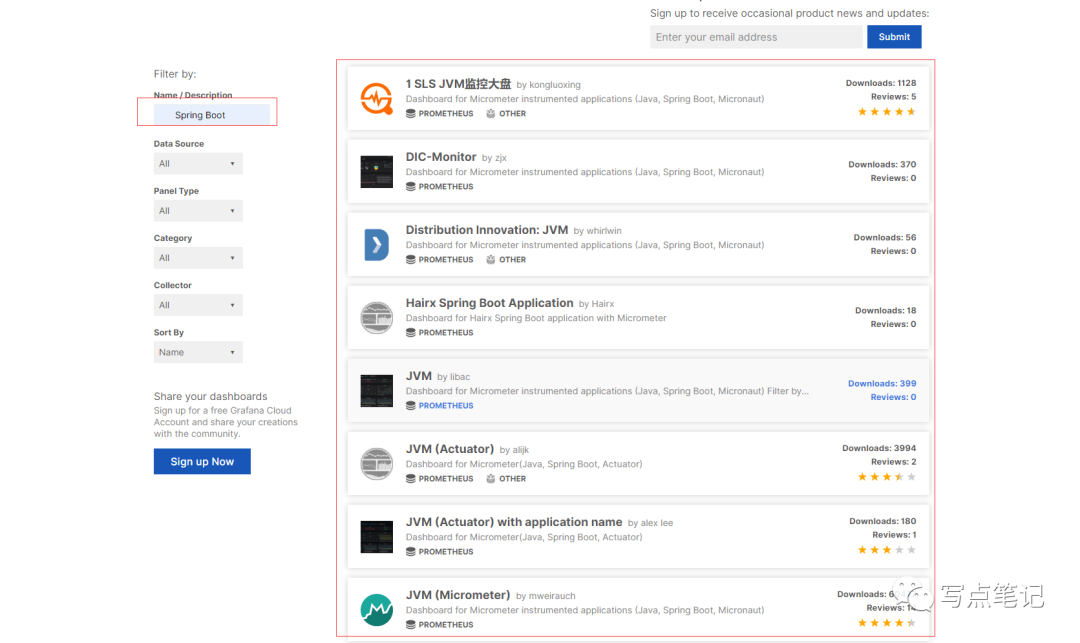
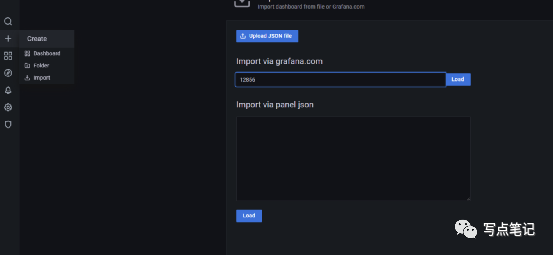
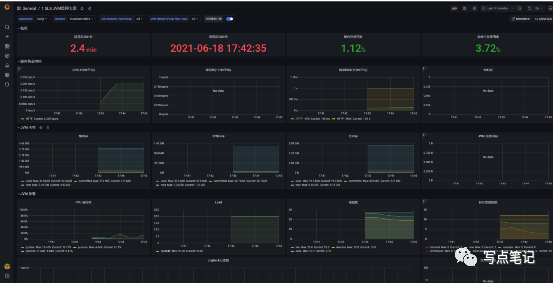
4、导入监控面板和监控
添加好gafana面板之后,我们就在home中刷新一下,发现我们的项目已经被监控了。哈哈,这个效果怎么样?
早呀~
评论