收藏!14 种异常检测方法总结
↑ 关注 + 星标 ,每天学Python新技能
后台回复【大礼包】送你Python自学大礼包
本文收集整理了公开网络上一些常见的异常检测方法(附资料来源和代码)。
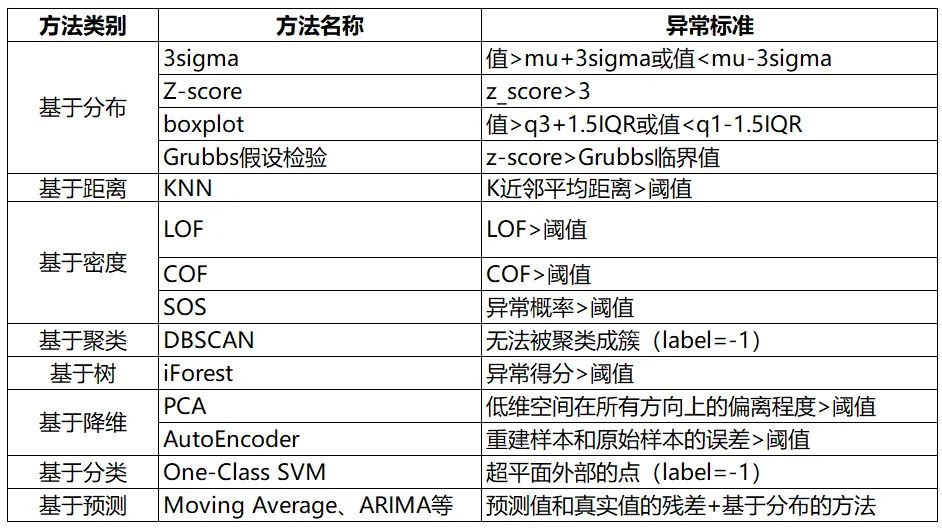
一、基于分布的方法
1. 3sigma
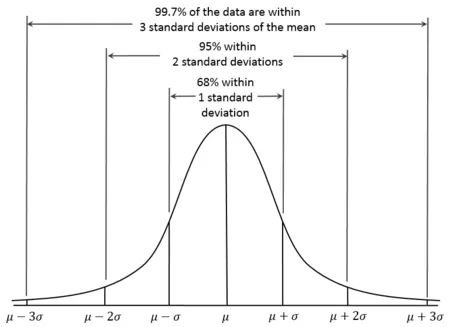
def three_sigma(s):
    mu, std = np.mean(s), np.std(s)
    lower, upper = mu-3*std, mu+3*std
    return lower, upper
2. Z-score
def z_score(s):
  z_score = (s - np.mean(s)) / np.std(s)
  return z_score
3. boxplot
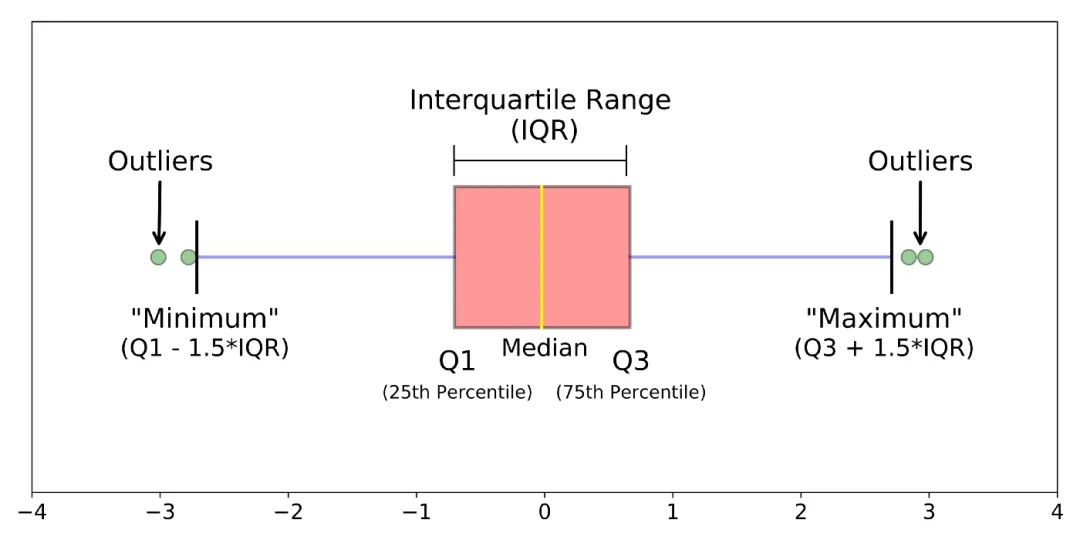
def boxplot(s):
    q1, q3 = s.quantile(.25), s.quantile(.75)
    iqr = q3 - q1
    lower, upper = q1 - 1.5*iqr, q3 + 1.5*iqr
    return lower, upper
4. Grubbs假设检验
[1] 时序预测竞赛之异常检测算法综述 - 鱼遇雨欲语与余,知乎:https://zhuanlan.zhihu.com/p/336944097 [2] 剔除异常值栅格计算器_数据分析师所需的统计学:异常检测 - weixin_39974030,CSDN:https://blog.csdn.net/weixin_39974030/article/details/112569610
H0: 数据集中没有异常值
H1: 数据集中有一个异常值
from outliers import smirnov_grubbs as grubbs
print(grubbs.test([8, 9, 10, 1, 9], alpha=0.05))
print(grubbs.min_test_outliers([8, 9, 10, 1, 9], alpha=0.05))
print(grubbs.max_test_outliers([8, 9, 10, 1, 9], alpha=0.05))
print(grubbs.max_test_indices([8, 9, 10, 50, 9], alpha=0.05))二、基于距离的方法
1. KNN
[3] 异常检测算法之(KNN)-K Nearest Neighbors - 小伍哥聊风控,知乎:https://zhuanlan.zhihu.com/p/501691799
from pyod.models.knn import KNN

# 初始化检测器clf
clf = KNN( method='mean', n_neighbors=3, )
clf.fit(X_train)
# 返回训练数据上的分类标签 (0: 正常值, 1: 异常值)
y_train_pred = clf.labels_
# 返回训练数据上的异常值 (分值越大越异常)
y_train_scores = clf.decision_scores_
三、基于密度的方法
1. Local Outlier Factor (LOF)
[4] 一文读懂异常检测 LOF 算法(Python代码)- 东哥起飞,知乎:https://zhuanlan.zhihu.com/p/448276009
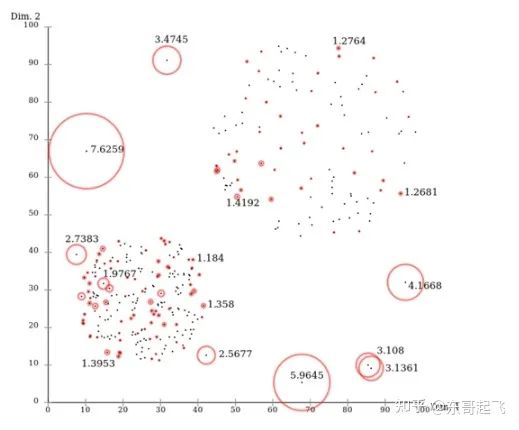
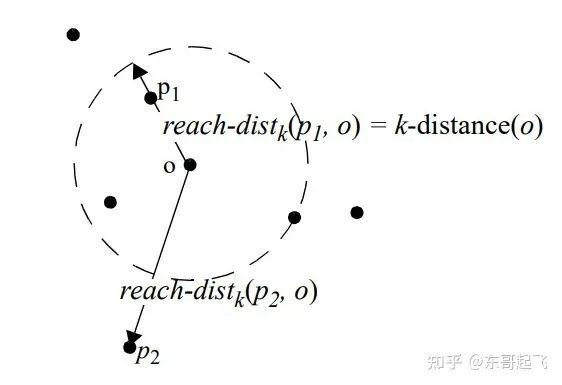
对于每个数据点,计算它与其他所有点的距离,并按从近到远排序;
对于每个数据点,找到它的K-Nearest-Neighbor,计算LOF得分。
from sklearn.neighbors import LocalOutlierFactor as LOF

X = [[-1.1], [0.2], [100.1], [0.3]]
clf = LOF(n_neighbors=2)
res = clf.fit_predict(X)
print(res)
print(clf.negative_outlier_factor_)
2. Connectivity-Based Outlier Factor (COF)
[5] Nowak-Brzezińska, A., & Horyń, C. (2020). Outliers in rules-the comparision of LOF, COF and KMEANS algorithms. *Procedia Computer Science*, *176*, 1420-1429. [6] 機器學習_學習筆記系列(98):基於連接異常因子分析(Connectivity-Based Outlier Factor) - 劉智皓 (Chih-Hao Liu)
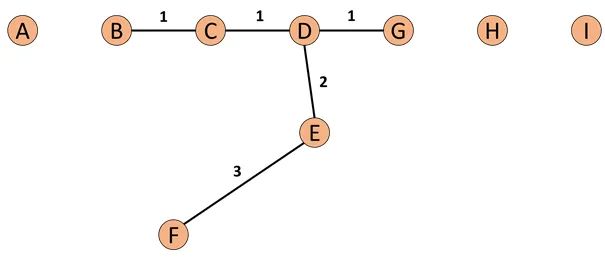
而接下来我们有了SBN Path我们就会接着计算,p点的链式距离:
# https://zhuanlan.zhihu.com/p/362358580
from pyod.models.cof import COF
cof = COF(contamination = 0.06,  ## 异常值所占的比例
          n_neighbors = 20,      ## 近邻数量
        )
cof_label = cof.fit_predict(iris.values) # 鸢尾花数据
print("检测出的异常值数量为:",np.sum(cof_label == 1))
3. Stochastic Outlier Selection (SOS)
[7] 异常检测之SOS算法 - 呼广跃,知乎:https://zhuanlan.zhihu.com/p/34438518
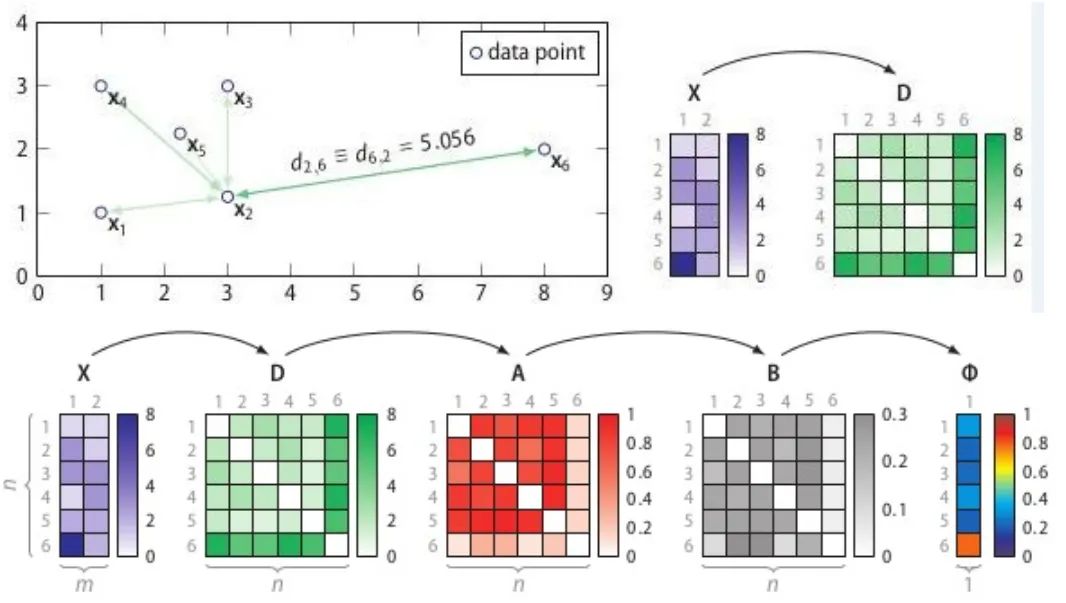
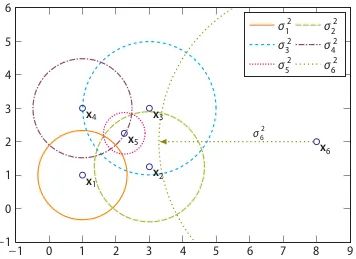
计算相异度矩阵D;
计算关联度矩阵A;
计算关联概率矩阵B;
算出异常概率向量。

# Ref: https://github.com/jeroenjanssens/scikit-sos
import pandas as pd
from sksos import SOS
iris = pd.read_csv("http://bit.ly/iris-csv")
X = iris.drop("Name", axis=1).values
detector = SOS()
iris["score"] = detector.predict(X)
iris.sort_values("score", ascending=False).head(10)
四、基于聚类的方法
1. DBSCAN
输入:数据集,邻域半径Eps,邻域中数据对象数目阈值MinPts;
输出:密度联通簇。
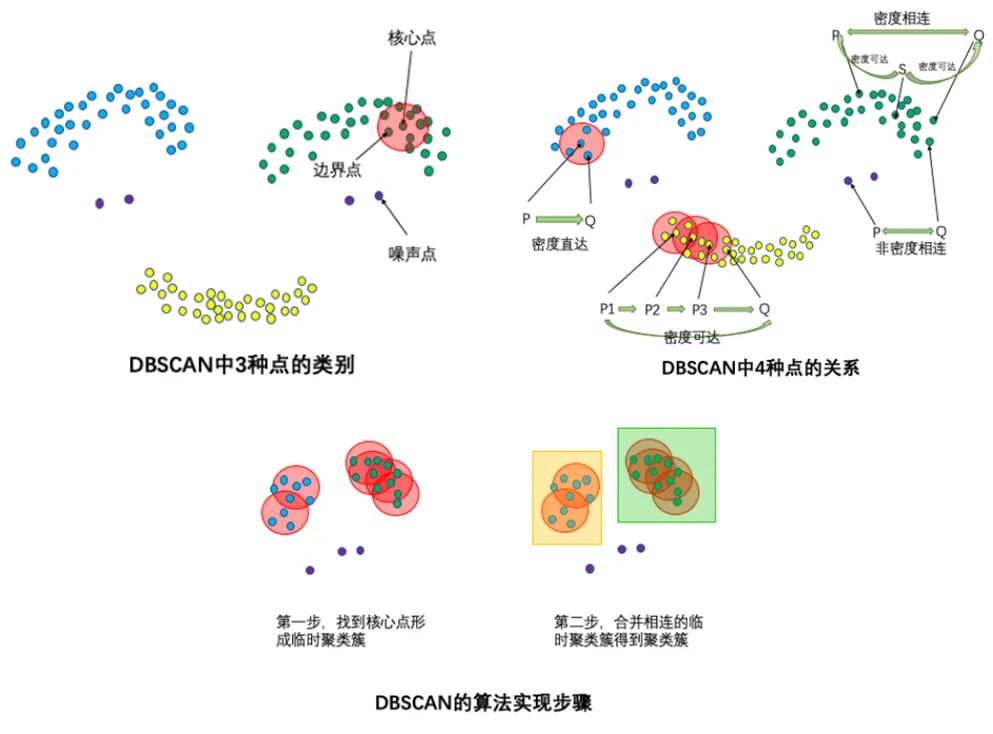
从数据集中任意选取一个数据对象点p;
如果对于参数Eps和MinPts,所选取的数据对象点p为核心点,则找出所有从p密度可达的数据对象点,形成一个簇;
如果选取的数据对象点 p 是边缘点,选取另一个数据对象点;
重复以上2、3步,直到所有点被处理。
# Ref: https://zhuanlan.zhihu.com/p/515268801
from sklearn.cluster import DBSCAN
import numpy as np
X = np.array([[1, 2], [2, 2], [2, 3],
              [8, 7], [8, 8], [25, 80]])
clustering = DBSCAN(eps=3, min_samples=2).fit(X)

clustering.labels_
array([ 0,  0,  0,  1,  1, -1])
# 0,,0,,0:表示前三个样本被分为了一个群
# 1, 1:中间两个被分为一个群
# -1:最后一个为异常点,不属于任何一个群
五、基于树的方法
1. Isolation Forest (iForest)
[8] 异常检测算法 -- 孤立森林(Isolation Forest)剖析 - 风控大鱼,知乎:https://zhuanlan.zhihu.com/p/74508141 [9] 孤立森林(isolation Forest)-一个通过瞎几把乱分进行异常检测的算法 - 小伍哥聊风控,知乎:https://zhuanlan.zhihu.com/p/484495545 [10] 孤立森林阅读 - Mark_Aussie,博文:https://blog.csdn.net/MarkAustralia/article/details/120181899
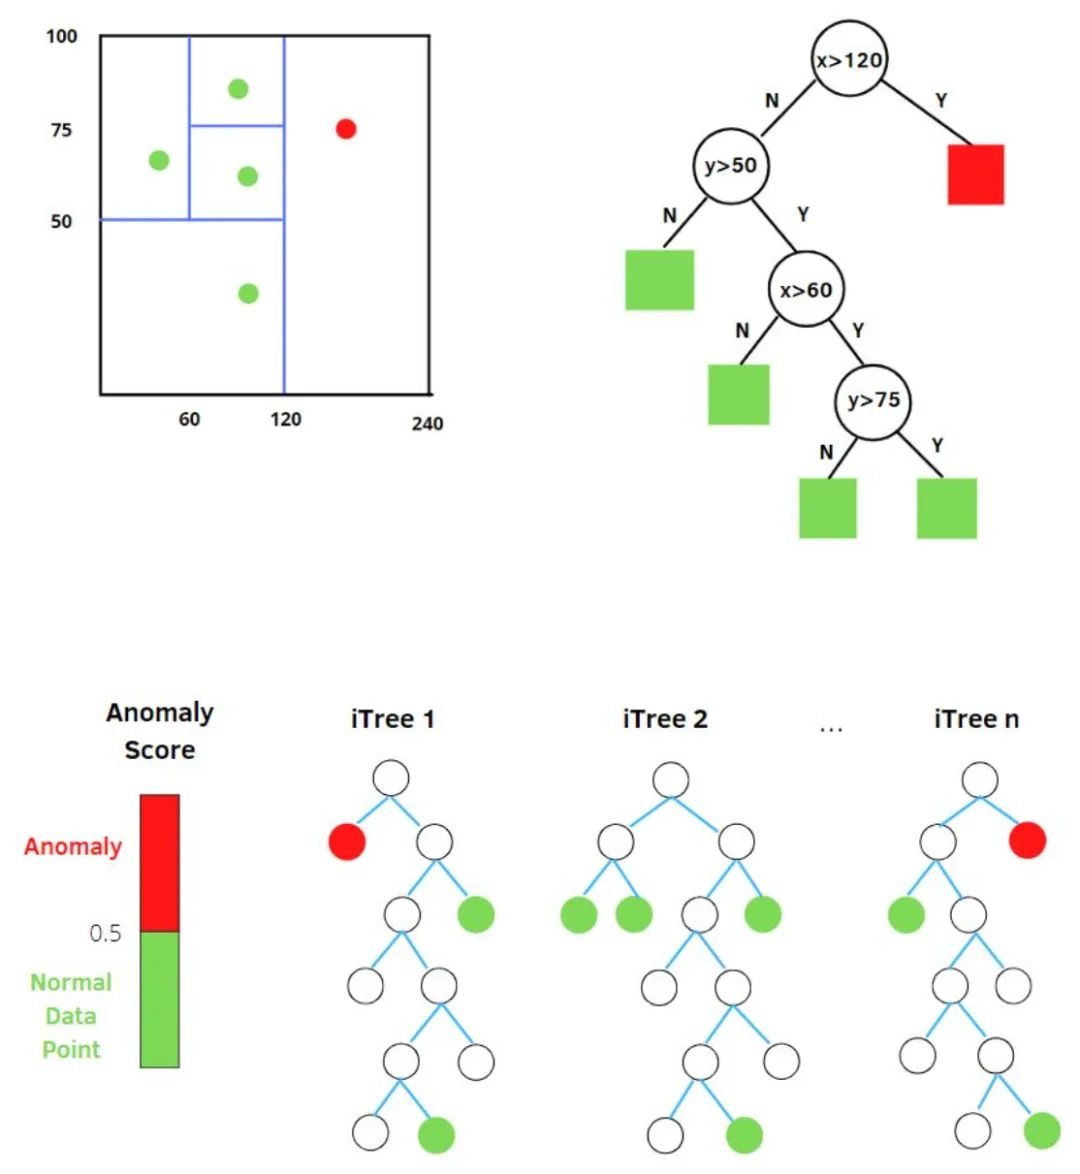
h(x):为样本在iTree上的PathLength;
E(h(x)):为样本在t棵iTree的PathLength的均值;
: 为 个样本构建一个二叉搜索树BST中的末成功搜索平均路径长度 (均值h(x)对外部节点终端的估计等同于BST中的末成功搜索)。 是对样本x的路径长度 进行标准化处理。 是调和数, 可使用 (欧拉常数) 估算。
# Ref:https://zhuanlan.zhihu.com/p/484495545
from sklearn.datasets import load_iris
from sklearn.ensemble import IsolationForest

data = load_iris(as_frame=True)
X,y = data.data,data.target
df = data.frame

# 模型训练
iforest = IsolationForest(n_estimators=100, max_samples='auto',
                          contamination=0.05, max_features=4,
                          bootstrap=False, n_jobs=-1, random_state=1)

#  fit_predict 函数 训练和预测一起 可以得到模型是否异常的判断,-1为异常,1为正常
df['label'] = iforest.fit_predict(X)

# 预测 decision_function 可以得出 异常评分
df['scores'] = iforest.decision_function(X)
六、基于降维的方法
1. Principal Component Analysis (PCA)
[11] 机器学习-异常检测算法(三):Principal Component Analysis - 刘腾飞,知乎:https://zhuanlan.zhihu.com/p/29091645 [12] Anomaly Detection异常检测--PCA算法的实现 - CC思SS,知乎:https://zhuanlan.zhihu.com/p/48110105
特征向量:反应了原始数据方差变化程度的不同方向;
特征值:数据在对应方向上的方差大小。
考虑在前k个特征向量方向上的偏差:前k个特征向量往往直接对应原始数据里的某几个特征,在前几个特征向量方向上偏差比较大的数据样本,往往就是在原始数据中那几个特征上的极值点。
考虑后r个特征向量方向上的偏差:后r个特征向量通常表示某几个原始特征的线性组合,线性组合之后的方差比较小反应了这几个特征之间的某种关系。在后几个特征方向上偏差比较大的数据样本,表示它在原始数据里对应的那几个特征上出现了与预计不太一致的情况。
得分大于阈值C则判断为异常。
第二种做法,PCA提取了数据的主要特征,如果一个数据样本不容易被重构出来,表示这个数据样本的特征跟整体数据样本的特征不一致,那么它显然就是一个异常的样本:
# Ref: [https://zhuanlan.zhihu.com/p/48110105](https://zhuanlan.zhihu.com/p/48110105)
from sklearn.decomposition import PCA
pca = PCA()
pca.fit(centered_training_data)
transformed_data = pca.transform(training_data)
y = transformed_data

# 计算异常分数
lambdas = pca.singular_values_
M = ((y*y)/lambdas)

# 前k个特征向量和后r个特征向量
q = 5
print "Explained variance by first q terms: ", sum(pca.explained_variance_ratio_[:q])
q_values = list(pca.singular_values_ < .2)
r = q_values.index(True)

# 对每个样本点进行距离求和的计算
major_components = M[:,range(q)]
minor_components = M[:,range(r, len(features))]
major_components = np.sum(major_components, axis=1)
minor_components = np.sum(minor_components, axis=1)

# 人为设定c1、c2阈值
components = pd.DataFrame({'major_components': major_components,
                               'minor_components': minor_components})
c1 = components.quantile(0.99)['major_components']
c2 = components.quantile(0.99)['minor_components']

# 制作分类器
def classifier(major_components, minor_components):
    major = major_components > c1
    minor = minor_components > c2
    return np.logical_or(major,minor)

results = classifier(major_components=major_components, minor_components=minor_components)
2. AutoEncoder
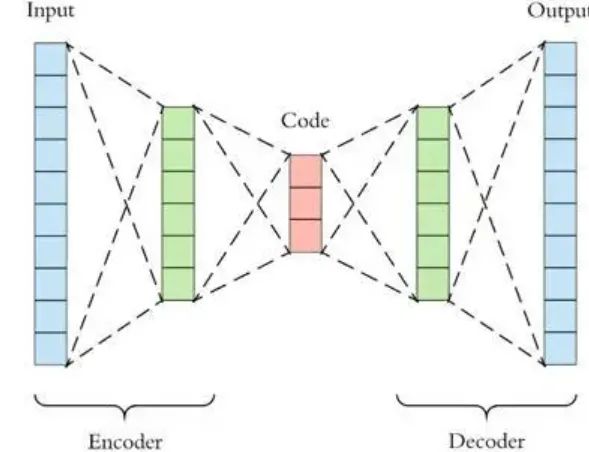
[13] 利用Autoencoder进行无监督异常检测(Python) - SofaSofa.io,知乎:https://zhuanlan.zhihu.com/p/46188296 [14] 自编码器AutoEncoder解决异常检测问题(手把手写代码) - 数据如琥珀,知乎:https://zhuanlan.zhihu.com/p/260882741
# Ref: [https://zhuanlan.zhihu.com/p/260882741](https://zhuanlan.zhihu.com/p/260882741)
import tensorflow as tf
from keras.models import Sequential
from keras.layers import Dense

# 标准化数据
scaler = preprocessing.MinMaxScaler()
X_train = pd.DataFrame(scaler.fit_transform(dataset_train),
                              columns=dataset_train.columns,
                              index=dataset_train.index)
# Random shuffle training data
X_train.sample(frac=1)
X_test = pd.DataFrame(scaler.transform(dataset_test),
                             columns=dataset_test.columns,
                             index=dataset_test.index)

tf.random.set_seed(10)
act_func = 'relu'
# Input layer:
model=Sequential()
# First hidden layer, connected to input vector X.
model.add(Dense(10,activation=act_func,
                kernel_initializer='glorot_uniform',
                kernel_regularizer=regularizers.l2(0.0),
                input_shape=(X_train.shape[1],)
               )
         )
model.add(Dense(2,activation=act_func,
                kernel_initializer='glorot_uniform'))
model.add(Dense(10,activation=act_func,
                kernel_initializer='glorot_uniform'))
model.add(Dense(X_train.shape[1],
                kernel_initializer='glorot_uniform'))
model.compile(loss='mse',optimizer='adam')
print(model.summary())

# Train model for 100 epochs, batch size of 10:
NUM_EPOCHS=100
BATCH_SIZE=10
history=model.fit(np.array(X_train),np.array(X_train),
                  batch_size=BATCH_SIZE,
                  epochs=NUM_EPOCHS,
                  validation_split=0.05,
                  verbose = 1)

plt.plot(history.history['loss'],
         'b',
         label='Training loss')
plt.plot(history.history['val_loss'],
         'r',
         label='Validation loss')
plt.legend(loc='upper right')
plt.xlabel('Epochs')
plt.ylabel('Loss, [mse]')
plt.ylim([0,.1])
plt.show()

# 查看训练集还原的误差分布如何,以便制定正常的误差分布范围
X_pred = model.predict(np.array(X_train))
X_pred = pd.DataFrame(X_pred,
                      columns=X_train.columns)
X_pred.index = X_train.index

scored = pd.DataFrame(index=X_train.index)
scored['Loss_mae'] = np.mean(np.abs(X_pred-X_train), axis = 1)
plt.figure()
sns.distplot(scored['Loss_mae'],
             bins = 10,
             kde= True,
            color = 'blue')
plt.xlim([0.0,.5])

# 误差阈值比对,找出异常值
X_pred = model.predict(np.array(X_test))
X_pred = pd.DataFrame(X_pred,
                      columns=X_test.columns)
X_pred.index = X_test.index
threshod = 0.3
scored = pd.DataFrame(index=X_test.index)
scored['Loss_mae'] = np.mean(np.abs(X_pred-X_test), axis = 1)
scored['Threshold'] = threshod
scored['Anomaly'] = scored['Loss_mae'] > scored['Threshold']
scored.head()
七、基于分类的方法
1. One-Class SVM
[15] Python机器学习笔记:One Class SVM - zoukankan,博文:http://t.zoukankan.com/wj-1314-p-10701708.html [16] 单类SVM: SVDD - 张义策,知乎:https://zhuanlan.zhihu.com/p/65617987
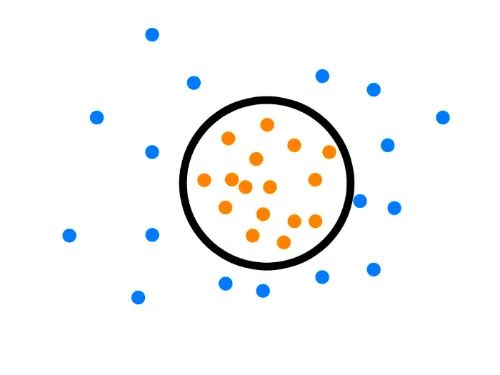
假设产生的超球体参数为中心 o 和对应的超球体半径r>0,超球体体积V(r)被最小化,中心o是支持行了的线性组合;跟传统SVM方法相似,可以要求所有训练数据点xi到中心的距离严格小于r。但是同时构造一个惩罚系数为C的松弛变量 ζi,优化问题入下所示:
C是调节松弛变量的影响大小,说的通俗一点就是,给那些需要松弛的数据点多少松弛空间,如果C比较小,会给离群点较大的弹性,使得它们可以不被包含进超球体。详细推导过程参考资料[15] [16]。
from sklearn import svm
# fit the model
clf = svm.OneClassSVM(nu=0.1, kernel='rbf', gamma=0.1)
clf.fit(X)
y_pred = clf.predict(X)
n_error_outlier = y_pred[y_pred == -1].size
八、基于预测的方法
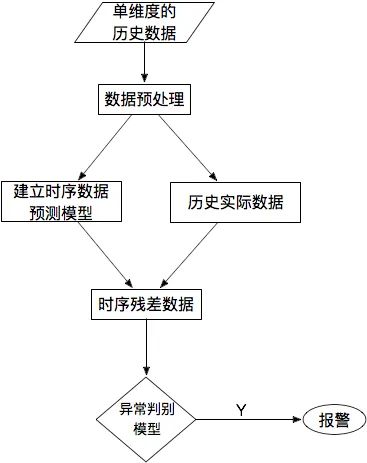
[17] 【TS技术课堂】时间序列异常检测 - 时序人,文章:https://mp.weixin.qq.com/s/9TimTB_ccPsme2MNPuy6uA
九、总结

向下滑动查看
来源:宅码


