matplotlib箭袋画风速风向
作者:大雯子拖油瓶
来源:SegmentFault 思否社区
颤抖几个参数的理解
颤抖([X,Y],U,V,[C],** kw),其中kw可以选择的参数有:
units:默认值是width, width/heigth:箭头的宽度是x或者y轴的总长,没错,是总长; dots/inches:箭头的宽度是设置的dpi或者设置的英寸大小,这个影响了width参数,比如说画布大小设为plt.figure(figsize=(144, 72), dpi=10),这个画布占1440*720px,如果quiver设置units="dots",width=5,代表以10像素为基础单位,5倍的宽度也就是画一个箭头它的宽度占50px,那么数据就需要抽样画了,不然会糊在一起;
x/y/xy:以x,y,或者xy的平方根为基础的宽度,如果x轴或者y轴坐标设置步长为1,和画布像素大小一致,这样一个像素对应一个x的整数坐标值,那么就可以控制箭头杆的宽度了,箭头杆的基础长度就是根号2px;
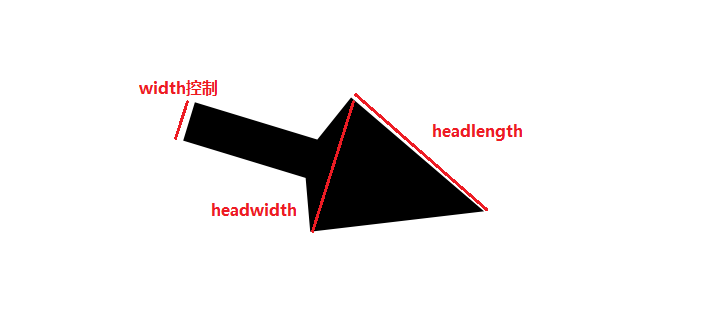
width:float型,用来控制箭头杆的宽度,我只清楚units=dots时宽度的理解,但是对于units=x/y/xy时宽度到底指的是我暂时是按照上面的理解;
angle:uv/xy,uv箭头的纵横比(axis aspect ratio)为1,所以若U==V,则绘图上箭头的方向与水平轴逆时针呈45度(正向右);xy箭头从(x,y)指向(x + u,y + v),例如,使用它来绘制渐变场(gradient field)
headwidth:float型,默认3,用来控制箭头三角形底边的半宽,值指的是杆宽的倍数;
headlength:float型,默认5,用来控制箭头斜边的长度,值指的是杆宽的倍数,比如4.5指的是杆宽的4.5倍;
scale:float型,默认为None,用来控制杆身的长度,值越小,杆身越长,如果为None,则使用matplotlib自动缩放算法,箭头长度单scale_units参数指定
scale_units:如果该值设置为width/heigth,则scale应该设为0.000x的范围差不多才是想要的结果,如果设置为inches,则和你的dpi以及scale相关,对于plt.figure(figsize=(144, 72),dpi=10) scale=1,scale_units="inches"和scale=0.1,scale_units="x/xy/不写"的画出来的结果是一样的;
pivot:tail/mid/middle/tip,默认tail,指的是箭头中心,其实就是从哪里画
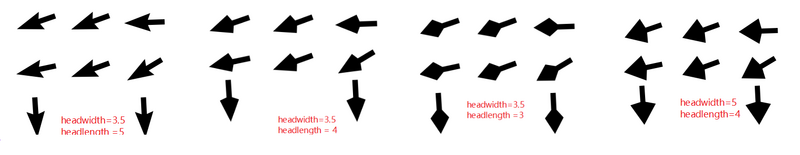
样例图

全部代码参考
# _*_coding:utf-8_*_import matplotlib.pyplot as pltfrom PIL import Imageimport numpy as npimport osimport sysimport jsonimport h5pyFILLVALUE = -32767def assigncolor(tardataset, mask, colorbar):if tardataset[mask].size > 0:if len(colorbar) >= 4:tardataset[mask] = colorbarelse:tardataset[mask] = [colorbar[0], colorbar[1], colorbar[2], 255]return tardataset[mask]def single_drawer(dataset, colorbar, tardataset):#特殊值的处理nullmask = np.isnan(dataset[:]) | np.isinf(dataset)tardataset[nullmask] = [255, 255, 255, 0]for index in range(0, len(colorbar)):# 获取需要进行判断的值valuemask = tardataset[:, :] == [-1, -1, -1, -1]# 三维转二维,方便与dataset的mask合并valuemask = valuemask[:, :, 0]mask = dataset == colorbar[index][0]tardataset[valuemask & mask] = assigncolor(tardataset, valuemask & mask, colorbar[index][1])return tardatasetdef gradient_drawer(dataset, colorbar, tardataset):# 特殊值的处理nullmask = np.isnan(dataset[:]) | np.isinf(dataset)tardataset[nullmask] = [255, 255, 255, 0]# 小于最小值valuemask = tardataset[:, :] == [-1, -1, -1, -1]valuemask = valuemask[:, :, 0]mask = dataset <= colorbar[0][0]tardataset[valuemask & mask] = assigncolor(tardataset, valuemask & mask, colorbar[0][1])for index in range(0, len(colorbar) - 1):# 获取需要进行判断的值valuemask = tardataset[:, :] == [-1, -1, -1, -1]if index == 18:print(valuemask.shape)valuemask = valuemask[:, :, 0]mask = (dataset > colorbar[index][0]) & (dataset <= colorbar[index + 1][0])tempmask = valuemask & maskif tempmask[tempmask == True].size > 0:ratio = (1.0 * (dataset[valuemask & mask] - colorbar[index][0]) / (colorbar[index + 1][0] - colorbar[index][0])).reshape(-1, 1)colorrange = (np.array(colorbar[index + 1][1] - np.array(colorbar[index][1]))).reshape(1, -1)temp = np.dot(ratio, colorrange) + np.array(colorbar[index][1])if len(colorbar[index][1]) < 4:alphaband = np.ones((temp.shape[0], 1))alphaband[::] = 255temp = np.column_stack((temp, alphaband))tardataset[valuemask & mask] = temp# 大于最大值valuemask = tardataset[:, :] == [-1, -1, -1, -1]valuemask = valuemask[:, :, 0]mask = dataset > colorbar[-1][0]tardataset[valuemask & mask] = assigncolor(tardataset, valuemask & mask, colorbar[-1][1])return tardatasetdef drawWindDir(in_file, u_ds, v_ds, dir_file, cb_file):# 读取调色板gradient_cb = []single_cb = []with open(cb_file, "r") as cb_json:cb_data = json.load(cb_json)gradient_cb = cb_data["gradient"]single_cb = cb_data["single"]# 读取风速h5py_obj = h5py.File(in_file, 'r')u_data = np.array(h5py_obj[u_ds])v_data = np.array(h5py_obj[v_ds])sws_data = np.array(h5py_obj["SWS"])# 获取宽高uh, uw = np.shape(u_data)vh, vw = np.shape(v_data)# 上下翻转数据u = np.flip(u_data, 0)v = np.flip(v_data, 0)# 读取风速有效值范围sws_valid = h5py_obj["SWS"].attrs['valid range']# 用风速有效值控制无效值区域提取valid_mask = (sws_data >= sws_valid[0]) & (sws_data <= sws_valid[1])# 用u,v向量计算风速wp = np.empty((uh, uw), dtype=np.float)wp[:, :] = FILLVALUEwp[valid_mask] = np.sqrt(np.power(u[valid_mask] / 100.0, 2) + np.power(v[valid_mask] / 100.0, 2))# 初始化输出数据集tardataset = np.ones((uh, uw, 4), dtype=np.int)tardataset[::] = -1# 去掉single调色板的值tardataset = single_drawer(sws_data, single_cb, tardataset)# 根据gradient调色板重新赋值result_data = gradient_drawer(sws_data, gradient_cb, tardataset)# 输出风速的底图new_image = Image.fromarray(result_data.astype(np.uint8)).convert('RGBA')new_image.save(in_file.replace(".HDF", ".png"), 'png')# 风向的xy坐标,uv向量,1440,720,去除无效值u_valid = valid_maskX, Y = np.meshgrid(np.arange(0, uw, 1), np.flipud(np.arange(0, uh, 1)))U = u.astype(np.int64)V = v.astype(np.int64)newU = np.zeros((uh, uw))newV = np.zeros((uh, uw))newU[u_valid] = U[u_valid] / np.sqrt(np.power(U[u_valid], 2) + np.power(V[u_valid], 2))newV[u_valid] = V[u_valid] / np.sqrt(np.power(U[u_valid], 2) + np.power(V[u_valid], 2))# 无效值为nannewU[newU == 0] = np.nannewV[newV == 0] = np.nan# 创建画布fig1 = plt.figure(figsize=(uw, uh), dpi=1)ax1 = fig1.add_subplot(111)# 去掉坐标轴,去掉两边空白,控制输出的xy轴范围plt.axis('off')plt.subplots_adjust(top=1, bottom=0, left=0, right=1, hspace=0, wspace=0)plt.ylim(0, uh)plt.xlim(0, uw)# 栅格抽样i = 10Q = ax1.quiver(X[::i, ::i], Y[::i, ::i], newU[::i, ::i], newV[::i, ::i], scale=0.1, width=1, units="xy", angles='uv', headwidth=3.5, headlength=4, pivot="mid")ax1.scatter(X[::i, ::i], Y[::i, ::i], color='r', s=30)plt.show()fig1.savefig(dir_file, transparent=True)plt.close()def mergeDirSpd(spd_img, dir_img, out_img):backimage = Image.open(spd_img)frontimage = Image.open(dir_img)# 暂时没有考虑分辨率不一致情况outimage = Image.alpha_composite(backimage, frontimage)outimage.save(out_img)if __name__ == "__main__":in_path = sys.argv[1]ds = sys.argv[2]cb_file = sys.argv[3]if os.path.isdir(in_path):for w_root, w_dirs, dir_files in os.walk(in_path):for one_file in dir_files:if '.HDF' in one_file and "SWS" in one_file:in_file = os.path.join(w_root, one_file)spd_img = in_file.replace(".HDF", ".png")dir_img = in_file.replace(".HDF", "_dir.png")out_img = in_file.replace(".HDF", "_dp.png")u_ds = "wind_vel_u"v_ds = "wind_vel_v"drawWindDir(in_file, u_ds, v_ds, dir_img, cb_file)mergeDirSpd(spd_img, dir_img, out_img)elif os.path.isfile(in_path):in_file = in_pathspd_img = in_file.replace(".HDF", ".png")dir_img = in_file.replace(".HDF", "_dir.png")out_img = in_file.replace(".HDF", "_dp.png")u_ds = "dwind_vel_u"v_ds = "wind_vel_v"drawWindDir(in_file, u_ds, v_ds, dir_img, cb_file)mergeDirSpd(spd_img, dir_img, out_img)