猫眼Top100简单爬虫并做可视化分析

效果展示
工具准备
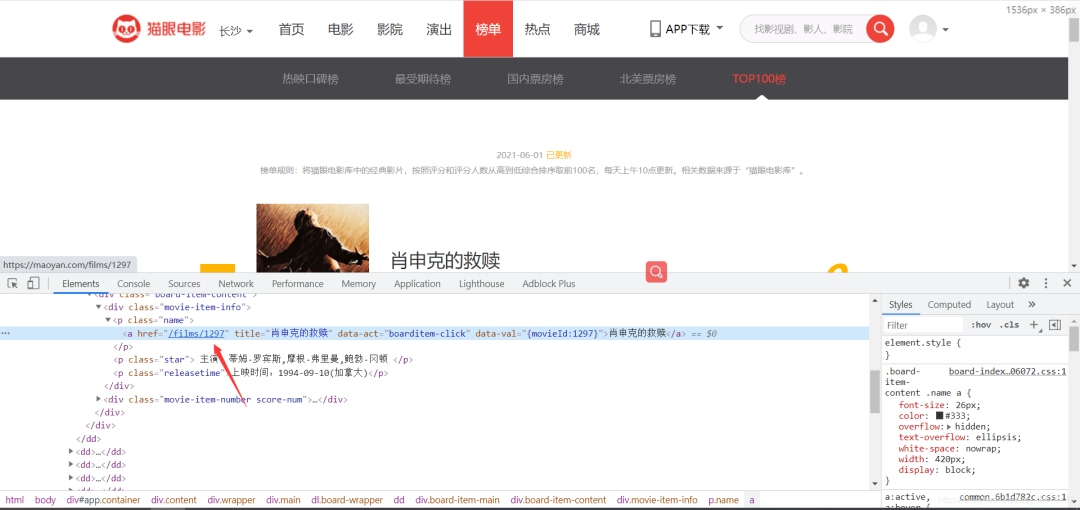
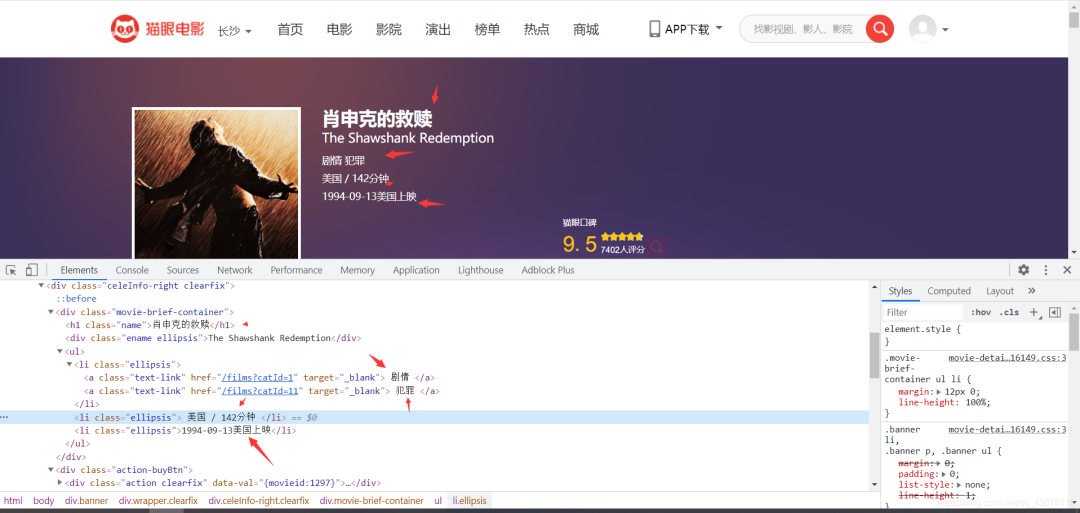
项目思路解析
数据可视化需要用到的工具
import pandas as pd
import numpy as np
import jieba
from wordcloud import WordCloud
import matplotlib.pyplot as plt
# get_ipython().run_line_magic('matplotlib', 'inline')
效果图展示
源码展示
爬虫代码
#!/usr/bin/env python
# -*- coding: utf-8 -*-
# @Time    : 2021年06月05日
# @File    : demo4.py

import requests
from fake_useragent import UserAgent
from lxml import etree
import time

# 随机请求头
ua = UserAgent()

# 构建请求 需要自己去网页上面换一下  请求不到了就 去网页刷新 把验证码弄了
headers = {
    'Accept': 'text/html,application/xhtml+xml,application/xml;q=0.9,image/webp,image/apng,*/*;q=0.8,application/signed-exchange;v=b3;q=0.9',
    'Cookie': '__mta=244176442.1622872454168.1622876903037.1622877097390.7; uuid_n_v=v1; uuid=6FFF6D30C5C211EB8D61CF53B1EFE83FE91D3C40EE5240DCBA0A422050B1E8C0; _csrf=bff9b813020b795594ff3b2ea3c1be6295b7453d19ecd72f8beb9700c679dfb4; Hm_lvt_703e94591e87be68cc8da0da7cbd0be2=1622872443; _lxsdk_cuid=1770e9ed136c8-048c356e76a22b-7d677965-1fa400-1770e9ed136c8; _lxsdk=6FFF6D30C5C211EB8D61CF53B1EFE83FE91D3C40EE5240DCBA0A422050B1E8C0; ci=59; recentCis=59; __mta=51142166.1622872443578.1622872443578.1622876719906.2; Hm_lpvt_703e94591e87be68cc8da0da7cbd0be2=1622877097; _lxsdk_s=179dafd56bf-06d-403-d81%7C%7C12',
    'User-Agent': str(ua.random)
}


def RequestsTools(url):
    '''
    爬虫请求工具函数
    :param url: 请求地址
    :return: HTML对象 用于xpath提取
    '''
    response = requests.get(url, headers=headers).content.decode('utf-8')
    html = etree.HTML(response)
    return html


def Index(page):
    '''
    首页函数
    :param page: 页数
    :return:
    '''
    url = 'https://maoyan.com/board/4?offset={}'.format(page)
    html = RequestsTools(url)
    # 详情页地址后缀
    urls_text = html.xpath('//a[@class="image-link"]/@href')
    # 评分
    pingfen1 = html.xpath('//i[@class="integer"]/text()')
    pingfen2 = html.xpath('//i[@class="fraction"]/text()')

    for i, p1, p2 in zip(urls_text, pingfen1, pingfen2):
        pingfen = p1 + p2
        urs = 'https://maoyan.com' + i
        # 反正请求太过于频繁
        time.sleep(2)
        Details(urs, pingfen)


def Details(url, pingfen):
    html = RequestsTools(url)
    dianyan = html.xpath('//h1[@class="name"]/text()') # 电影名称
    leixing = html.xpath('//li[@class="ellipsis"]/a/text()') # 类型
    diqu = html.xpath('/html/body/div[3]/div/div[2]/div[1]/ul/li[2]/text()') # 读取总和
    timedata = html.xpath('/html/body/div[3]/div/div[2]/div[1]/ul/li[3]/text()') # 时间
    for d, l, b, t in zip(dianyan, leixing, diqu, timedata):
        countyr = b.replace('\n', '').split('/')[0] # 地区
        shichang = b.replace('\n', '').split('/')[1] # 时长
        f = open('猫眼.csv', 'a')
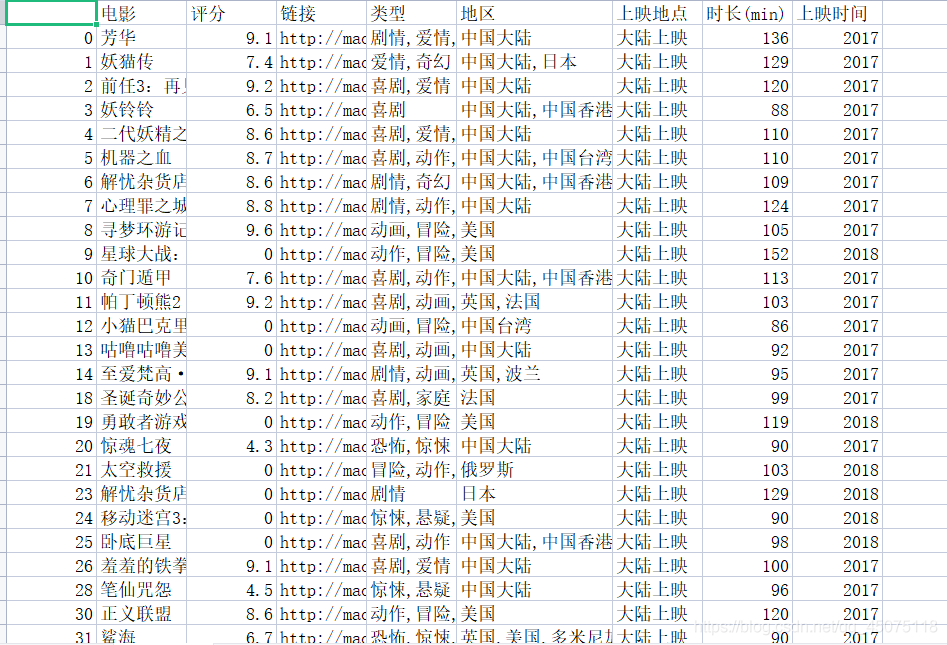
        f.write('{}, {}, {}, {}, {}, {}, {}\n'.format(d, pingfen, url, l, countyr, shichang, t))
        print(d, pingfen, url, l, countyr, shichang, t )


for page in range(0, 11):
    page *= 10
    Index(page)
可视化
#!/usr/bin/env python
# coding: utf-8

# 加载数据分析常用库
import pandas as pd
import numpy as np
import jieba
from wordcloud import WordCloud
import matplotlib.pyplot as plt
# get_ipython().run_line_magic('matplotlib', 'inline')


# In[3]:

path='./maoyan.csv'
df=pd.read_csv(path,sep=',',encoding='utf-8',index_col=False)
df.drop(df.columns[0],axis=1,inplace=True)
df.dropna(inplace=True)
df.drop_duplicates(inplace=True)
df.head(10)

#查看数据的结构
df.info()
print(df.columns)


# In[11]:

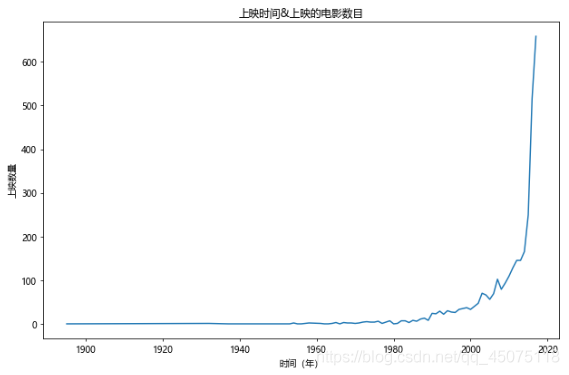
#年份&上映电影的数目  2018及以后的上映数目只是目前猫眼上公布的,具有不确定性,就先把2018及之后的剔除
fig,ax=plt.subplots(figsize=(9,6),dpi=70)
df[df[u'上映时间']<2018][u'上映时间'].value_counts().sort_index().plot(kind='line',ax=ax)
ax.set_xlabel(u'时间(年)')
ax.set_ylabel(u'上映数量')
ax.set_title(u'上映时间&上映的电影数目')

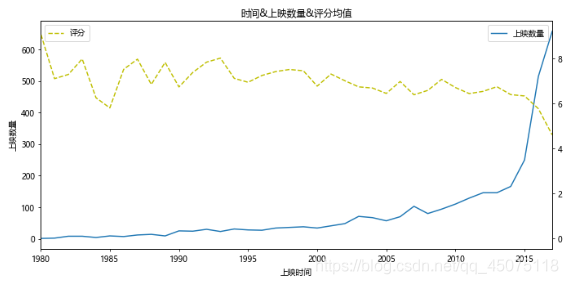
#基于上图,再弄一个上映时间&上映数量&评分的关系图
#但是由于1980年以前的数据量较少,评分不准确,将主要的分析区域集中在1980-2017
x=df[df[u'上映时间']<2018][u'上映时间'].value_counts().sort_index().index
y=df[df[u'上映时间']<2018][u'上映时间'].value_counts().sort_index().values
y2=df[df[u'上映时间']<2018].sort_values(by=u'上映时间').groupby(u'上映时间').mean()[u'评分'].values

fig,ax=plt.subplots(figsize=(10,5),dpi=70)
ax.plot(x,y,label=u'上映数量')
ax.set_xlim(1980,2017)
ax.set_xlabel(u'上映时间')
ax.set_ylabel(u'上映数量')
ax.set_title(u'时间&上映数量&评分均值')
ax2=ax.twinx()
ax2.plot(x,y2,c='y',ls='--',label=u'评分')
ax.legend(loc=1)
ax2.legend(loc=2)

# 解决中文乱码,坐标轴显示不出负值的问题
plt.rcParams['font.sans-serif'] =['Microsoft YaHei']
plt.rcParams['axes.unicode_minus'] = False


# In[12]:

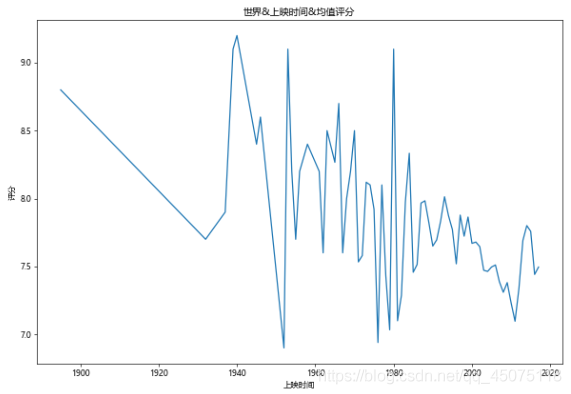
#世界&上映时间&均值评分
fig,ax=plt.subplots(figsize=(10,7),dpi=60)
df[df[u'评分']>0].groupby(u'上映时间').mean()[u'评分'].plot(kind='line',ax=ax)
ax.set_ylabel(u'评分')
ax.set_title(u'世界&上映时间&均值评分')


# In[13]:

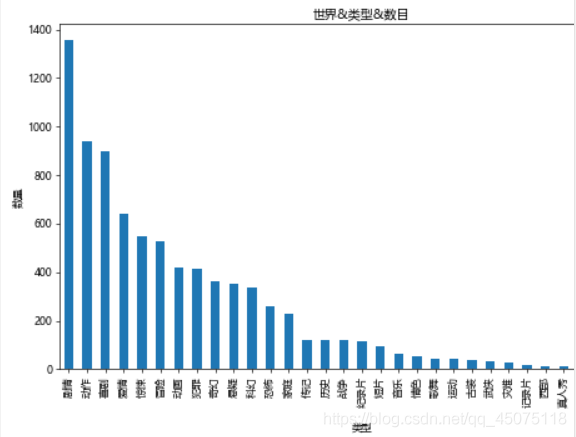
#世界各类型影片所占的数目
#对类型进行切割成最小单位,然后统计
types=[]
for tp in df[u'类型']:
    ls=tp.split(',')
    for x in ls:
        types.append(x)

tp_df=pd.DataFrame({u'类型':types})
fig,ax=plt.subplots(figsize=(9,6),dpi=60)
tp_df[u'类型'].value_counts().plot(kind='bar',ax=ax)
ax.set_xlabel(u'类型')
ax.set_ylabel(u'数量')
ax.set_title(u'世界&类型&数目')


# In[14]:

#影片时长与评分的分布
#有个问题:其实有一些影片未进行评分,在这里要将这些给取缔
x=df[df[u'评分']>0].sort_values(by=u'时长(min)')[u'时长(min)'].values
y=df[df[u'评分']>0].sort_values(by=u'时长(min)')[u'评分'].values
fig,ax=plt.subplots(figsize=(9,6),dpi=70)
ax.scatter(x,y,alpha=0.6,marker='o')
ax.set_xlabel(u'时长(min)')
ax.set_ylabel(u'数量')
ax.set_title(u'影片时长&评分分布图')
#可以看出评分

i=0
c0=[]
c1=[]
c2=[]
c3=[]
c4=[]
c5=[]
c6=[]
c7=[]

for x in df[u'地区']:
    if u'中国大陆' in x:
        c0.append(df.iat[i, 0])
        c1.append(df.iat[i, 1])
        c2.append(df.iat[i, 2])
        c3.append(df.iat[i, 3])
        c4.append(df.iat[i, 4])
        c5.append(df.iat[i, 5])
        c6.append(df.iat[i, 6])
        c7.append(df.iat[i, 7])
    i=i+1

china_df=pd.DataFrame({u'电影':c0, u'评分':c1,u'链接':c2, u'类型':c3,u'地区':c4, u'上映地点':c5,u'时长(min)':c6,u'上映时间':c7})

# In[16]:

#中国&世界均值评分比较 时间范围在1980-2017
x1 = df[df[u'评分']>0].groupby(u'上映时间').mean()[u'评分'].index
y1 = df[df[u'评分']>0].groupby(u'上映时间').mean()[u'评分'].values

x2 = china_df[china_df[u'评分']>0].groupby(u'上映时间').mean()[u'评分'].index
y2 = china_df[china_df[u'评分']>0].groupby(u'上映时间').mean()[u'评分'].values
fig,ax=plt.subplots(figsize=(12,9),dpi=60)
ax.plot(x1,y1,ls='-',c='DarkTurquoise',label=u'世界')
ax.plot(x2,y2,ls='--',c='Gold',label=u'中国')
ax.set_title(u'中国&世界均值评分')
ax.set_xlabel(u'时间')
ax.set_xlim(1980,2017)
ax.set_ylabel(u'评分')
ax.legend()


# In[17]:

#类型上映数目  中国&世界对比
#因为类型是混合的,为了方便统计 先写一个函数用来对类型进行分割

# In[18]:

#写分割的函数  传入一个Sreies 类型对象 返回一个类型分割的DataFrame
#这里传入的是一个 类型的Series

def Cuttig_type(typeS):
    types=[]
    types1=[]

    for x in typeS:
        if len(x)<4:
            # print x
            types1.append(x)
        ls=x.split(',')
        for i in ls:
            types.append(i)

    types.extend(types1)
    df=pd.DataFrame({u'类型':types})
    return pd.DataFrame(df[u'类型'].value_counts().sort_values(ascending=False))

# In[19]:

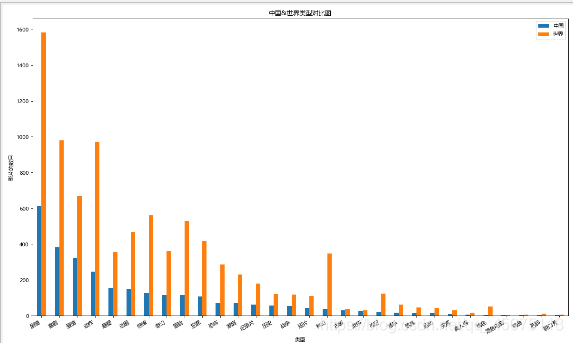
#中国&世界影片类型比较
df1=Cuttig_type(china_df[u'类型'])
df2=Cuttig_type(df[u'类型'])
trans=pd.concat([df1,df2],axis=1)
trans.dropna(inplace=True)
trans.columns=[u'中国',u'世界']
fig,ax=plt.subplots(figsize=(15,9),dpi=80)
trans.plot(kind='bar',ax=ax)
fig.autofmt_xdate(rotation=30)
ax.set_title(u'中国&世界类型对比图')
ax.set_xlabel(u'类型')
ax.set_ylabel(u'影片的数目')


# In[20]:

#然后就是散点分布了,中国&世界&时长&评分分布
y = df[df[u'评分'] > 0].sort_values(by=u'时长(min)')[u'评分'].values
x = df[df[u'评分'] > 0].sort_values(by=u'时长(min)')[u'时长(min)'].values
y2 = china_df[china_df[u'评分'] > 0].sort_values(by=u'时长(min)')[u'评分'].values
x2 = china_df[china_df[u'评分'] > 0].sort_values(by=u'时长(min)')[u'时长(min)'].values

fig, ax = plt.subplots(figsize=(10,7), dpi=80)
ax.scatter(x, y, c='DeepSkyBlue', alpha=0.6, label=u'世界')
ax.scatter(x2, y2, c='Salmon', alpha=0.7, label=u'中国')
ax.set_title(u'中国&世界评分分布情况')
ax.set_xlabel(u'时长(min)')
ax.set_ylabel(u'评分')
ax.legend(loc=4)


# In[25]:

dfs=df[(df[u'上映时间']>1980)&(df[u'上映时间']<2019)]

# for x in range(0,len(dfs)):
#     print(dfs.iat[x,0],dfs.iat[x,-1])

df666 = dfs['电影'][:15]

wl = ",".join(df666.values)
# 把分词后的txt写入文本文件
# fenciTxt  = open("fenciHou.txt","w+")
# fenciTxt.writelines(wl)
# fenciTxt.close()

# 设置词云l
wc = WordCloud(background_color="white",  #设置背景颜色
               # mask=imread('shen.jpg'),   #设置背景图片
#                    max_words=2000,  #设置最大显示的字数
                   font_path="C:\\Windows\\Fonts\\simkai.ttf", # 设置为楷体 常规
    #设置中文字体,使得词云可以显示(词云默认字体是“DroidSansMono.ttf字体库”,不支持中文)
               max_font_size=60, #设置字体最大值
               random_state=30,  #设置有多少种随机生成状态,即有多少种配色方案
               )
myword = wc.generate(wl)  #生成词云
wc.to_file('result.jpg')

# 展示词云图
plt.imshow(myword)
plt.axis("off")
plt.show()
原文链接:blog.csdn.net/lland5201314/article/details/117606268
文章转载:Python编程学习圈
(版权归原作者所有,侵删)

点击下方“阅读原文”查看更多
评论


