
手把手教你使用Numpy、Matplotlib、Scipy等5个Python库
导读:用Python设计控制系统,你会用到接下来要介绍的几个模块:Numpy、Matplotlib、Scipy、Sympy和Python-Control。

import numpy as npA = np.array([ [1, 2], [-3, 4]])
print(A)
[[ 1  2]
 [-3  4]]
print(A.T)
[[ 1 -3]
 [ 2  4]]
B = np.linalg.inv(A)
print(B)
[[ 0.4 -0.2]
 [ 0.3  0.1]]
np.linalg.det(A) #行列式
10.000000000000002
np.linalg.matrix_rank(A) #秩
2
w, v = np.linalg.eig(A) #特征值和特征向量
print('eigenvalue=',w)
print('eigenvector=\n',v)
eigenvalue= [2.5+1.93649167j 2.5-1.93649167j]
eigenvector=
 [[0.38729833-0.5j 0.38729833+0.5j]
 [0.77459667+0.j  0.77459667-0.j ]]
x = np.array([1, 2])
print(x)
np.linalg.norm(x)
2.23606797749979
Td = np.arange(0, 10, 1)
print(Td)
[0 1 2 3 4 5 6 7 8 9]
import matplotlib.pyplot as plt
代码段2.1 绘图
import numpy as np
import matplotlib.pyplot as plt
x = np.arange(0, 4 * np.pi, 0.1)
y = np.sin(x)
plt.plot(x, y) #横轴使用x,纵轴使用y绘图
plt.xlabel('x') #设定x轴的标签
plt.ylabel('y') #设定y轴的标签
plt.grid() #显示网格
plt.show()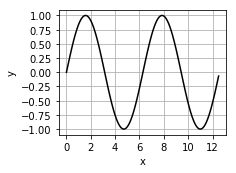
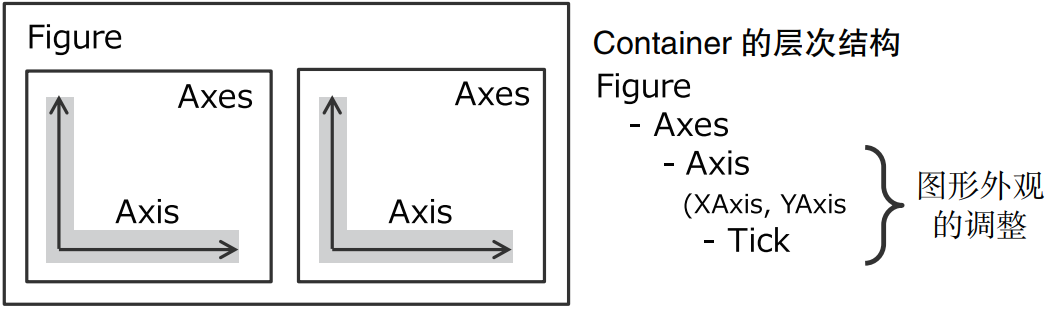
代码段2.2 面向对象的绘图
fig, ax = plt.subplots() #生成Figure和Axes对象
ax.plot(x, y) #在Axes对象中生成图形
ax.set_xlabel('x')
ax.set_ylabel('y')
ax.grid()
plt.show()
代码段2.3 生成图2.11的代码
fig, ax = plt.subplots(2,1) #设置2行1列的子图形

x = np.arange(0, 4 * np.pi, 0.1)
y = np.sin(x)
z = np.cos(x)
w = y + z

#生成第一个图形
ax[0].plot(x, y, ls='-', label='sin', c='k')
ax[0].plot(x, z, ls='-.', label='cos', c='k')
ax[0].set_xlabel('x')
ax[0].set_ylabel('y, z')
ax[0].set_xlim(0, 4*np.pi)
ax[0].grid()
ax[0].legend()

#生成第二个图形
ax[1].plot(x, w, color='k', marker='.')
ax[1].set_xlabel('x')
ax[1].set_ylabel('w')
ax[1].set_xlim(0, 4*np.pi)
ax[1].grid(ls=':')

fig.tight_layout()
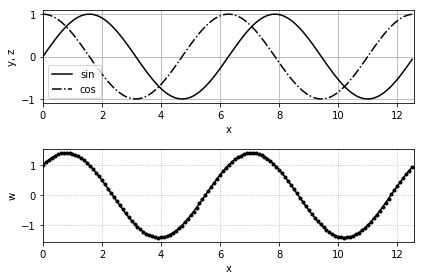
-:实线 -.:点画线 --:虚线 ..:点线
b:蓝 g:绿 r:红 c:青 m:品红 y:黄 k:黑 w:白
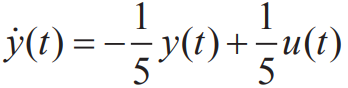
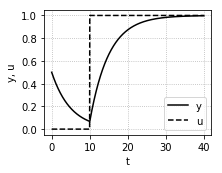
代码段2.4 微分方程的数值积分
from scipy.integrate import odeint
import numpy as np
import matplotlib.pyplot as plt
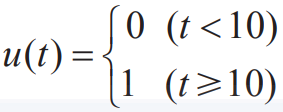
#定义微分方程
def system(y, t):
if t < 10.0:
u = 0.0
else:
u = 1.0
dydt = (-y + u)/5.0
return dydt
#通过设定初始值和时间求解微分方程
y0 = 0.5
t = np.arange(0, 40, 0.04)
y = odeint(system, y0, t)
#绘图
fig, ax = plt.subplots()
ax.plot(t, y, label='y', c='k')
ax.plot(t, 1 * (t>=10), ls='--', label='u')
ax.set_xlabel('t')
ax.set_ylabel('y, u')
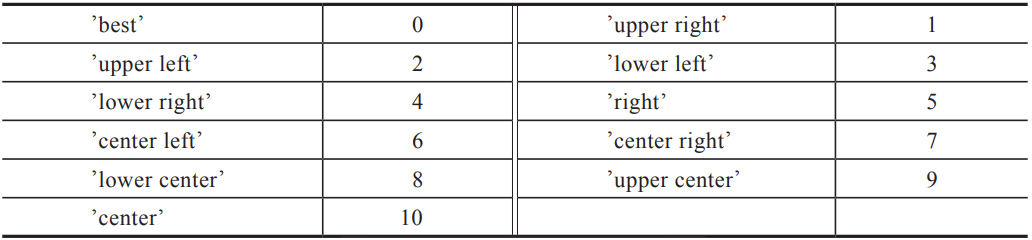
ax.legend(loc='best')
ax.grid(ls=':')
import sympy as sp
sp.init_printing()
s = sp.Symbol('s')
root = sp.solve(2 * s**2 +5*s+3, s)
print(root)
[-3/2, -1]
f = sp.expand( (s+1)*(s+2)**2, s)
print(f)
s**3 + 5*s**2 + 8*s + 4
g = sp.factor(f, s)
print(g)
(s + 1)*(s + 2)**2
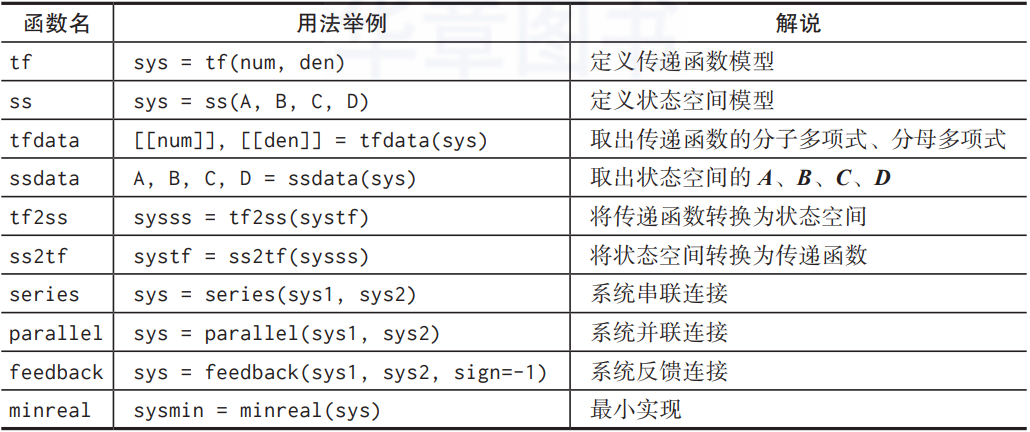
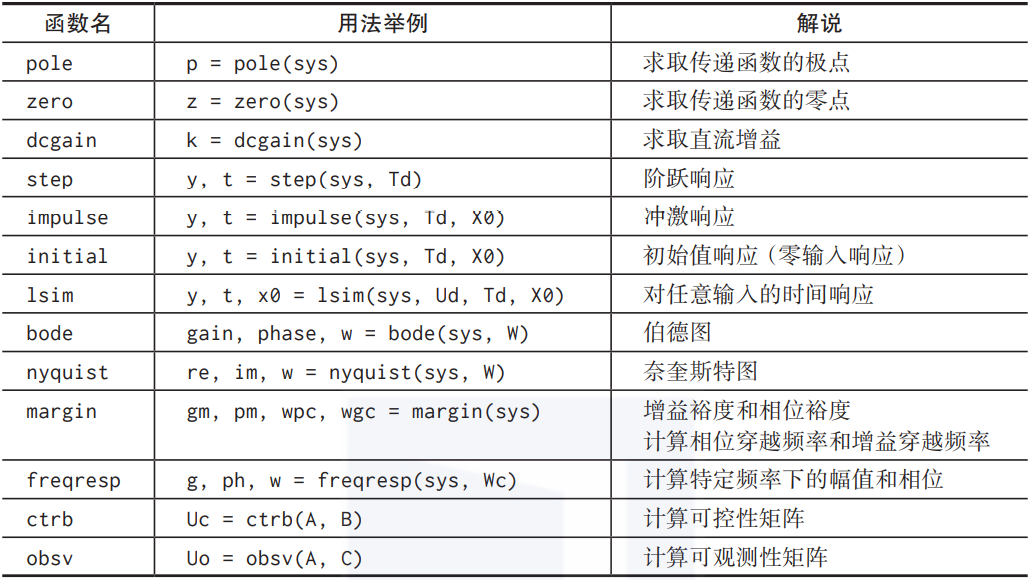
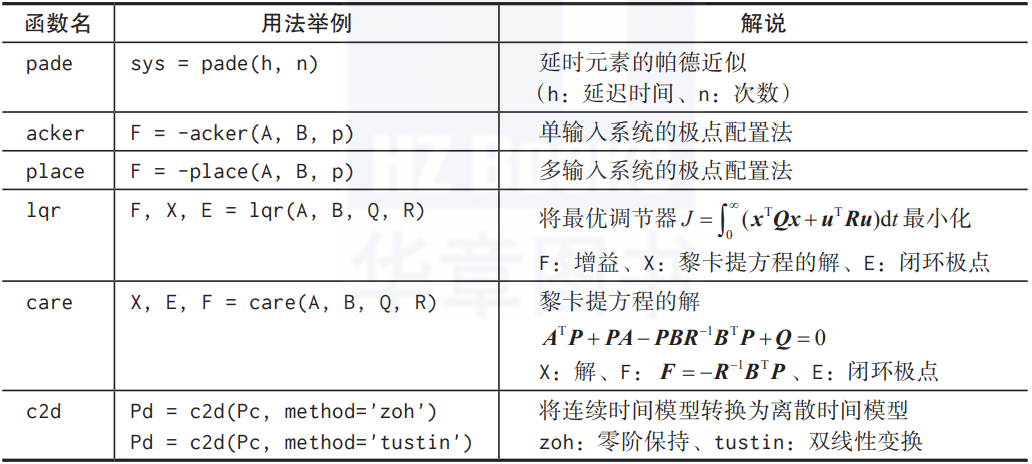
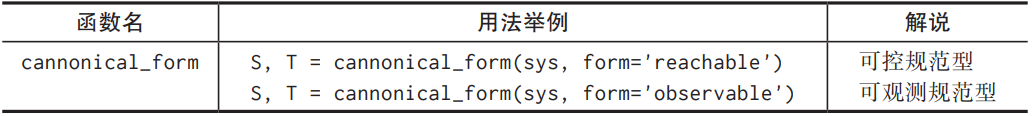
import control
from control.matlab import *


刷刷视频👇
干货直达👇
评论