手把手教你使用Python实现常用的假设检验 !
开门见山。
这篇文章,教大家用Python实现常用的假设检验!

服从什么分布,就用什么区间估计方式,也就就用什么检验!
比如:两个样本方差比服从F分布,区间估计就采用F分布计算临界值(从而得出置信区间),最终采用F检验。

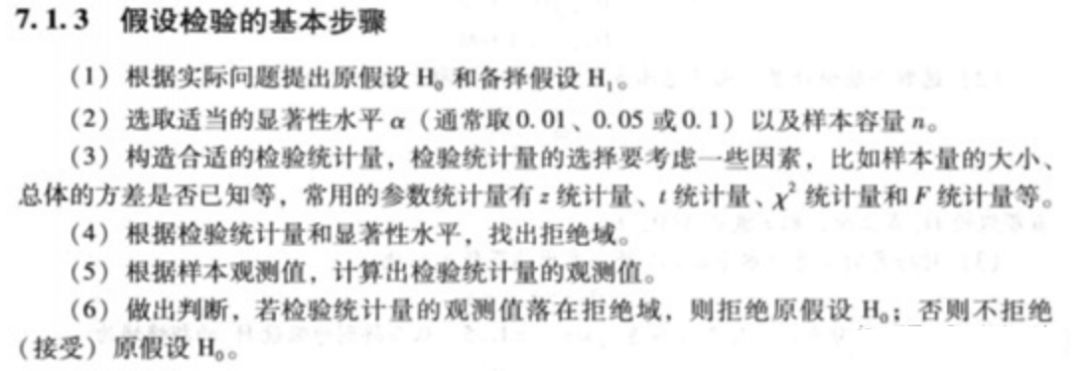
建设检验的基本步骤:

前言
假设检验用到的Python工具包
- Statsmodels是Python中,用于实现统计建模和计量经济学的工具包,主要包括描述统计、统计模型估计和统计推断
- Scipy是一个数学、科学和工程计算Python工具包,主要包括统计,优化,整合,线性代数等等与科学计算有关的包
导入数据
from sklearn.datasets import load_irisimport numpy as np#导入IRIS数据集iris = load_iris()iris=pd.DataFrame(iris.data,columns=['sepal_length','sepal_width','petal_legth','petal_width'])print(iris)
一个总体均值的z检验
np.mean(iris['petal_legth'])'''原假设:鸢尾花花瓣平均长度是4.2备择假设:鸢尾花花瓣平均长度不是4.2'''import statsmodels.stats.weightstatsz, pval = statsmodels.stats.weightstats.ztest(iris['petal_legth'], value=4.2)print(z,pval)'''P=0.002 <5%, 拒绝原假设,接受备则假设。'''
一个总体均值的t检验
import scipy.statst, pval = scipy.stats.ttest_1samp(iris['petal_legth'], popmean=4.0)print(t, pval)'''P=0.0959 > 5%, 接受原假设,即花瓣长度为4.0。'''
模拟双样本t检验
#取两个样本iris_1 = iris[iris.petal_legth >= 2]iris_2 = iris[iris.petal_legth < 2]print(np.mean(iris_1['petal_legth']))print(np.mean(iris_2['petal_legth']))'''H0: 两种鸢尾花花瓣长度一样H1: 两种鸢尾花花瓣长度不一样'''import scipy.statst, pval = scipy.stats.ttest_ind(iris_1['petal_legth'],iris_2['petal_legth'])print(t,pval)'''p<0.05,拒绝H0,认为两种鸢尾花花瓣长度不一样'''
练习
- gender:性别,1为男性,2为女性
- Temperature:体温
- HeartRate:心率
- 共130行,3列
- 用到的数据链接:pan.baidu.com/s/1t4SKF6
本周需要解决的几个小问题:
1. 人体体温的总体均值是否为98.6华氏度?
2. 人体的温度是否服从正态分布?
3. 人体体温中存在的异常数据是哪些?
4. 男女体温是否存在明显差异?
5. 体温与心率间的相关性(强?弱?中等?)
1.1 探索数据
import numpy as npimport pandas as pdfrom scipy import statsdata = pd.read_csv("C:\\Users\\baihua\\Desktop\\test.csv")print(data.head())sample_size = data.size #130*3out:Temperature Gender HeartRate0 96.3 1 701 96.7 1 712 96.9 1 743 97.0 1 804 97.1 1 73print(data.describe())out:Temperature Gender HeartRatecount 130.000000 130.000000 130.000000mean 98.249231 1.500000 73.761538std 0.733183 0.501934 7.062077min 96.300000 1.000000 57.00000097.800000 1.000000 69.00000098.300000 1.500000 74.00000098.700000 2.000000 79.000000max 100.800000 2.000000 89.000000人体体温均值是98.249231
1.2 人体的温度是否服从正态分布?
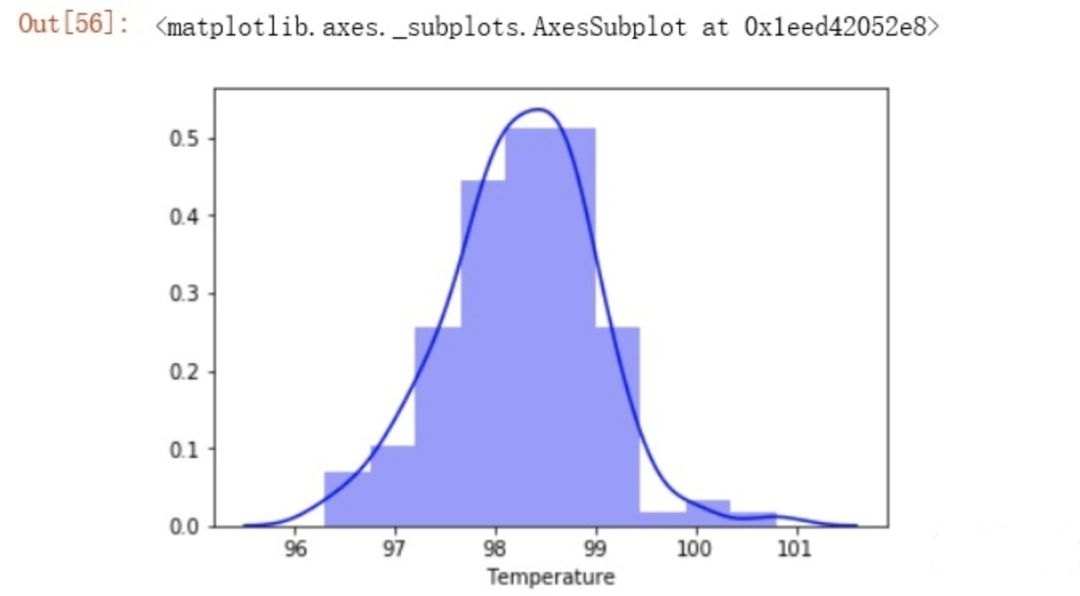
'''人体的温度是否服从正态分布?先画出分布的直方图,然后使用scipy.stat.kstest函数进行判断。'''%matplotlib inlineimport seaborn as snssns.distplot(data['Temperature'], color='b', bins=10, kde=True)

stats.kstest(data['Temperature'], 'norm')out:KstestResult(statistic=1.0, pvalue=0.0)'''p<0.05,不符合正态分布'''
判断是否服从t分布
'''判断是否服从t分布:'''np.random.seed(1)ks = stats.t.fit(data['Temperature'])df = ks[0]loc = ks[1]scale = ks[2]t_estm = stats.t.rvs(df=df, loc=loc, scale=scale, size=sample_size)stats.ks_2samp(data['Temperature'], t_estm)'''pvalue=0.4321464176976891 <0.05,认为体温服从t分布'''
判断是否服从卡方分布
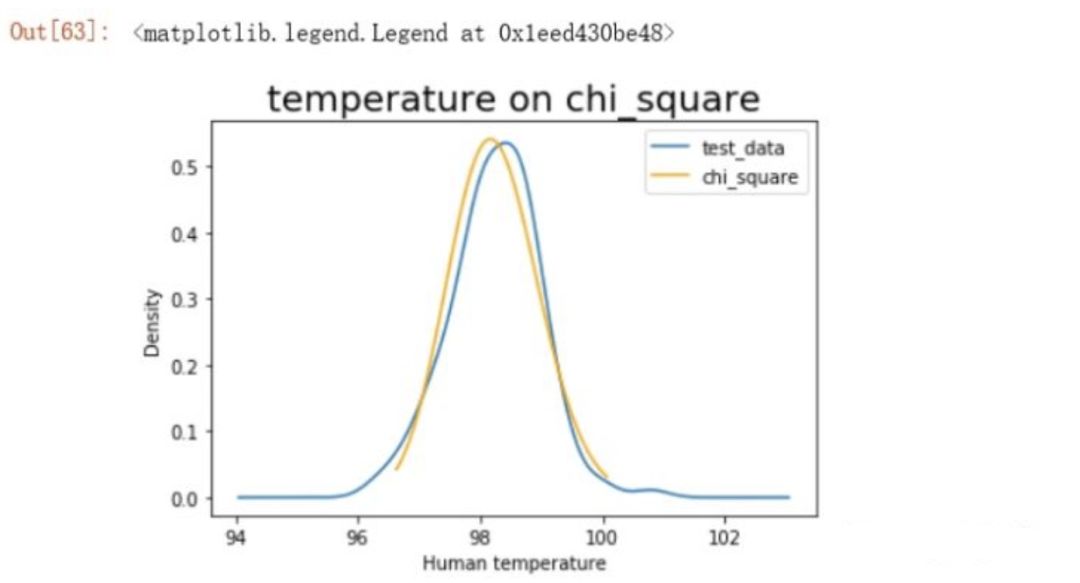
'''判断是否服从卡方分布:'''np.random.seed(1)chi_square = stats.chi2.fit(data['Temperature'])df = chi_square[0]loc = chi_square[1]scale = chi_square[2]chi_estm = stats.chi2.rvs(df=df, loc=loc, scale=scale, size=sample_size)stats.ks_2samp(data['Temperature'], chi_estm)'''pvalue=0.3956146564478842>0.05,认为体温服从卡方分布'''
绘制卡方分布直方图
'''绘制卡方分布图'''from matplotlib import pyplot as pltplt.figure()data['Temperature'].plot(kind = 'kde')chi2_distribution = stats.chi2(chi_square[0], chi_square[1],chi_square[2])x = np.linspace(chi2_distribution.ppf(0.01), chi2_distribution.ppf(0.99), 100)plt.plot(x, chi2_distribution.pdf(x), c='orange')plt.xlabel('Human temperature')plt.title('temperature on chi_square', size=20)plt.legend(['test_data', 'chi_square'])

1.3 人体体温中存在的异常数据是哪些?
'''=0.025和P=0.925时(该函数使用单侧概率值)的分布值,在分布值两侧的数据属于小概率,认为是异常值。'''lower1=chi2_distribution.ppf(0.025)lower2=chi2_distribution.ppf(0.925)t=data['Temperature']print(t[t>lower2])out:0 96.31 96.765 96.466 96.767 96.8Name: Temperature, dtype: float6463 99.464 99.5126 99.4127 99.9128 100.0129 100.8Name: Temperature, dtype: float64
1.4 男女体温差异是否显著
'''此题是一道两个总体均值之差的假设检验问题,因为是否存在差别并不涉及方向,所以是双侧检验。建立原假设和备择假设如下:H0:u1-u2 =0 没有显著差H1:u1-u2 != 0 有显著差别'''data.groupby(['Gender']).size() #样本量65male_df = data.loc[data['Gender'] == 1]female_df = data.loc[data['Gender'] == 2]'''使用Python自带的函数,P用的双侧累计概率'''import scipy.statst, pval = scipy.stats.ttest_ind(male_df['Temperature'],female_df['Temperature'])print(t,pval)if pval > 0.05:print('不能拒绝原假设,男女体温无明显差异。')else:print('拒绝原假设,男女体温存在明显差异。')out:-2.2854345381654984 0.02393188312240236拒绝原假设,男女体温存在明显差异。
1.5 体温与心率间的相关性(强?弱?中等?)
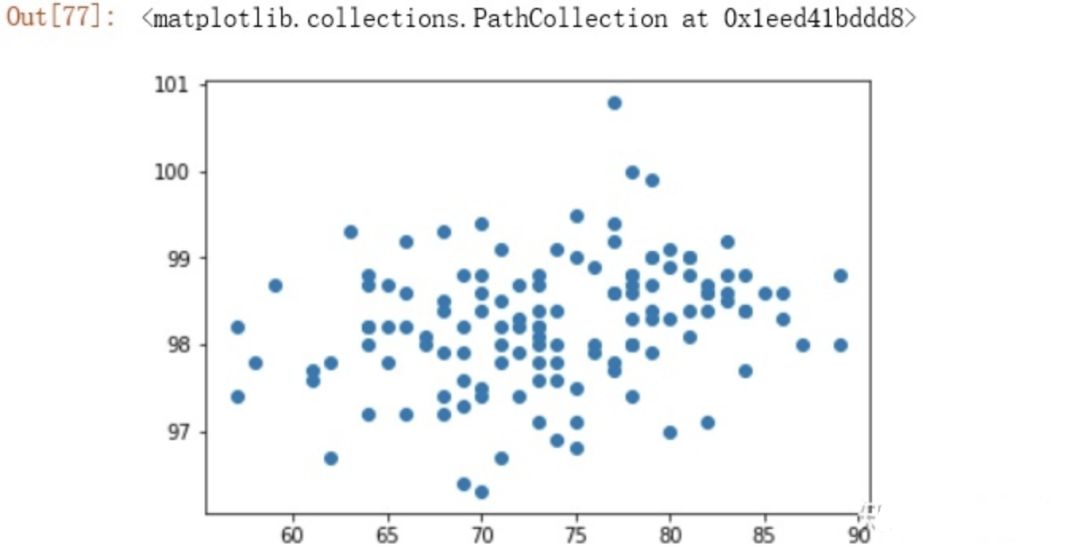
'''体温与心率间的相关性(强?弱?中等?)'''heartrate_s = data['HeartRate']temperature_s = data['Temperature']from matplotlib import pyplot as pltplt.scatter(heartrate_s, temperature_s)

stat, p = stats.pearsonr(heartrate_s, temperature_s)print('stat=%.3f, p=%.3f' % (stat, p))print(stats.pearsonr(heartrate_s, temperature_s))'''相关系数为0.004,可以认为二者之间没有相关性'''
来源:知乎
扫一扫下面的二维码领取Python学习资料~

“扫一扫,领取Python学习资料”
评论
