LazyProphet:使用 LightGBM 进行时间序列预测

来源:Deephub Imba 本文约2800字,建议阅读5分钟 LazyProphet还是一个时间序列建模的很好选择。

特征

代码
pip install LazyProphet安装后,开始编码:import matplotlib.pyplot as pltimport numpy as npfrom tqdm import tqdmimport pandas as pdfrom LazyProphet import LazyProphet as lptrain_df = pd.read_csv(r'm4-weekly-train.csv')test_df = pd.read_csv(r'm4-weekly-test.csv')train_df.index = train_df['V1']train_df = train_df.drop('V1', axis = 1)test_df.index = test_df['V1']test_df = test_df.drop('V1', axis = 1)
def smape(A, F):return 100/len(A) * np.sum(2 * np.abs(F - A) / (np.abs(A) + np.abs(F)))
smapes = []naive_smape = []j = tqdm(range(len(train_df)))for row in j:y = train_df.iloc[row, :].dropna()y_test = test_df.iloc[row, :].dropna()j.set_description(f'{np.mean(smapes)}, {np.mean(naive_smape)}')lp_model = LazyProphet(scale=True,seasonal_period=52,n_basis=10,fourier_order=10,ar=list(range(1, 53)),decay=.99,linear_trend=None,decay_average=False)fitted = lp_model.fit(y)predictions = lp_model.predict(len(y_test)).reshape(-1)smapes.append(smape(y_test.values, pd.Series(predictions).clip(lower=0)))naive_smape.append(smape(y_test.values, np.tile(y.iloc[-1], len(y_test))))print(np.mean(smapes))print(np.mean(naive_smape))
scale:这个很简单,只是是否对数据进行缩放。默认值为 True 。 seasonal_period:此参数控制季节性的傅立叶基函数,因为这是我们使用 52 的每周频率。 n_basis:此参数控制加权分段线性基函数。这只是要使用的函数数量的整数。 Fourier_order:用于季节性的正弦和余弦对的数量。 ar:要使用的滞后目标变量值。可以获取多个列表 1-52 。 decay:衰减因子用于惩罚我们的基函数的“右侧”。设置为 0.99 表示斜率乘以 (1- 0.99) 或 0.01。 linear_trend:树的一个主要缺点是它们无法推断出后续数据的范围。为了克服这个问题,有一些针对多项式趋势的现成测试将拟合线性回归以消除趋势。None 表示有测试,通过 True 表示总是去趋势,通过 False 表示不测试并且不使用线性趋势。 decay_average:在使用衰减率时不是一个有用的参数。这是一个trick但不要使用它。传递 True 只是平均基函数的所有未来值。这在与 elasticnet 程序拟合时很有用,但在测试中对 LightGBM 的用处不大。
train_df = pd.read_csv(r'm4-hourly-train.csv')test_df = pd.read_csv(r'm4-hourly-test.csv')train_df.index = train_df['V1']train_df = train_df.drop('V1', axis = 1)test_df.index = test_df['V1']test_df = test_df.drop('V1', axis = 1)smapes = []naive_smape = []j = tqdm(range(len(train_df)))for row in j:y = train_df.iloc[row, :].dropna()y_test = test_df.iloc[row, :].dropna()j.set_description(f'{np.mean(smapes)}, {np.mean(naive_smape)}')lp_model = LazyProphet(seasonal_period=[24,168],n_basis=10,fourier_order=10,ar=list(range(1, 25)),decay=.99)fitted = lp_model.fit(y)predictions = lp_model.predict(len(y_test)).reshape(-1)smapes.append(smape(y_test.values, pd.Series(predictions).clip(lower=0)))naive_smape.append(smape(y_test.values, np.tile(y.iloc[-1], len(y_test))))print(np.mean(smapes))print(np.mean(naive_smape))
结果

boosting_params = {"objective": "regression","metric": "rmse","verbosity": -1,"boosting_type": "gbdt","seed": 42,'linear_tree': False,'learning_rate': .15,'min_child_samples': 5,'num_leaves': 31,'num_iterations': 50}
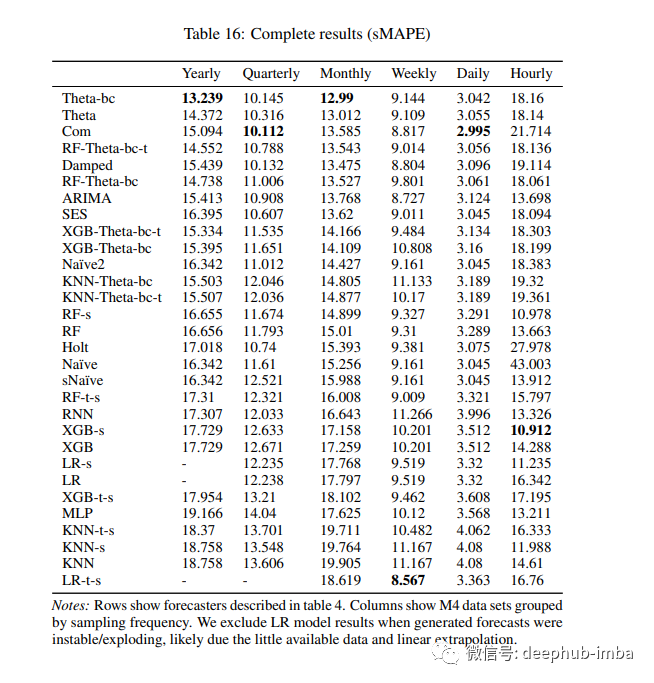
进行了零参数优化(针对不同的季节性稍作修改) 分别拟合每个时间序列 在我的本地机器上在一分钟内“懒惰地”生成了预测。 在基准测试中击败了所有其他树方法
引用:
[1] Markus Löning, Franz Király: “Forecasting with sktime: Designing sktime’s New Forecasting API and Applying It to Replicate and Extend the M4 Study”, 2020; arXiv:2005.08067
编辑:王菁
评论
