小费数据集项目分析案例
新手可以用这个基础案例,练习一些可视化的内容。
小费数据集项目分析目的:
小费金额与消费总额是否存在相关性?
性别、是否吸烟、星期几、中/晚餐、聚餐人数和小费金额是否有一定的关联?
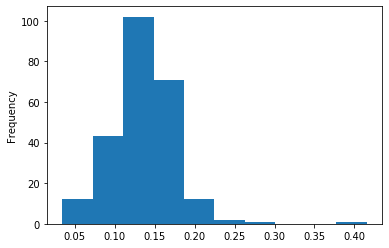
小费金额占消费总金额的百分比是否服从正态分布?
# 导入包
import seaborn as sns
from pandas import Series,DataFrame
import pandas as pd
import matplotlib.pyplot as plt
%matplotlib inline
# 拿到小费数据集
tips = sns.load_dataset('tips')

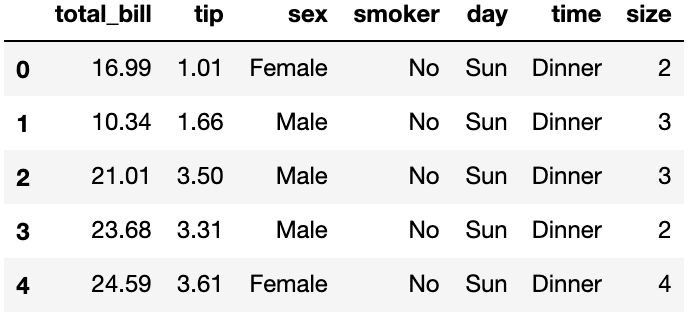
# 数据介绍:total_bill列为消费总金额;tip列为小费金额;sex列为顾客性别;smoker列为顾客是否抽烟;day列为消费的星期;time列为聚餐的时间段;size列为聚餐人数

# 查看前5行数据
tips.head()
# 开始检查数据,数据量、数据缺失、数据是否异常等
tips.shape
(244, 7)
# 数值型数据描述性查看
tips.describe()
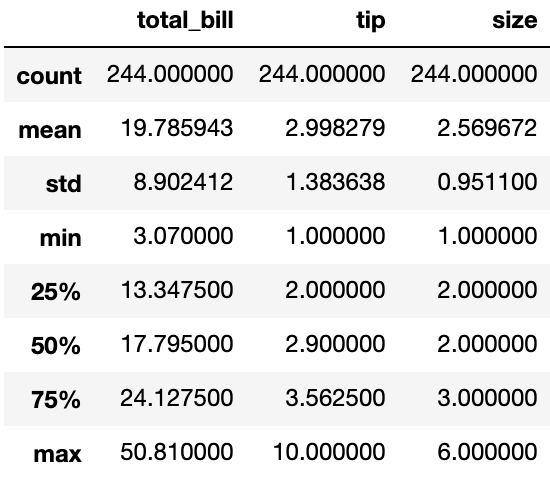
# 查看数据类型正常,并且没有缺失值
tips.info()
'pandas.core.frame.DataFrame'>
RangeIndex: 244 entries, 0 to 243
Data columns (total 7 columns):
total_bill    244 non-null float64
tip           244 non-null float64
sex           244 non-null category
smoker        244 non-null category
day           244 non-null category
time          244 non-null category
size          244 non-null int64
dtypes: category(4), float64(2), int64(1)
memory usage: 7.2 KB
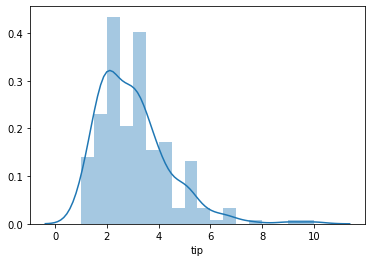
# 查看单个变量tip的分布情况,使用直方图
sns.distplot(tips['tip'])
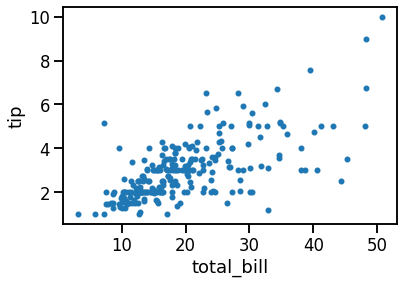
# 散点图查看小费和消费金额是否有相关性。图示表明,存在正线性相关。小费金额越高,小费越高
tips.plot(kind='scatter', x='total_bill', y='tip')
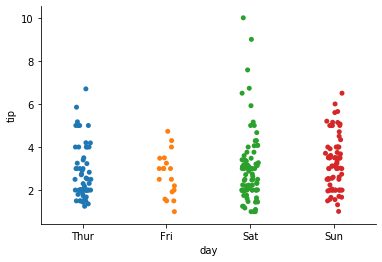
# 分类散点图,用于观察不同分类下,值的数量和高低分布
sns.stripplot(x='day',y='tip',data=tips)
sns.despine()
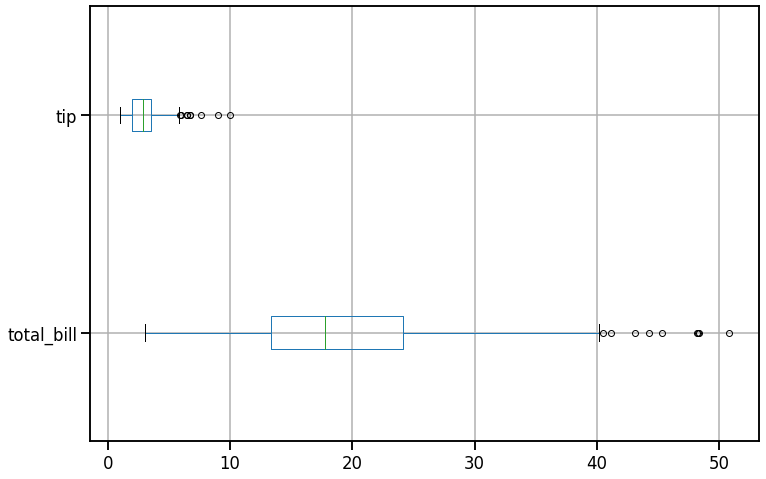
# 查看总金额和小费整体数据情况,图中总体金额呈现右偏,并且有部分异常值;小费呈现左偏

# figure() 设置图形大小
plt.figure(figsize=(12,8))
tips.boxplot(column=['total_bill','tip'],vert=False)
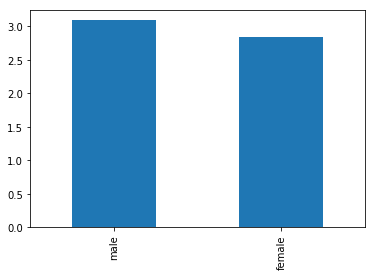
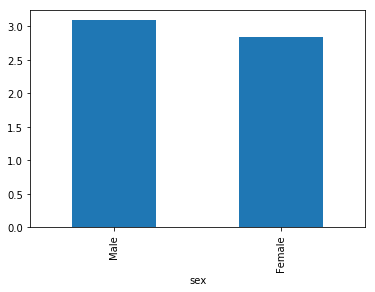
# 关注性别是否影响小费金额,这里使用男女总体平均值作为对比
male_tip = tips[tips['sex'] == ['Male']]['tip'].mean()
male_tip
3.0896178343949043
female_tip = tips[tips['sex'] == ['Female']]['tip'].mean()
female_tip
2.8334482758620685
s = Series(
    [male_tip, female_tip],
    index=['male','female']
)
s
male      3.089618
female    2.833448
dtype: float64
# 使用柱状图查看男女分类类别
s.plot(kind='bar')
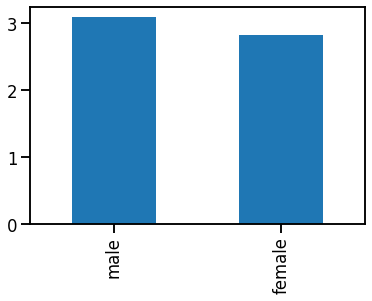
# Seaborn预设了四种比例,根据大小依次为 paper notebook talk poster 默认是 notebook,也就是上述的样式
sns.set_context('talk')
s.plot(kind='bar')
# 上述算平均值较为繁琐,这里可以使用groupby,比较快捷
sex_group = tips.groupby('sex')['tip'].mean()
sex_group.plot(kind='bar')
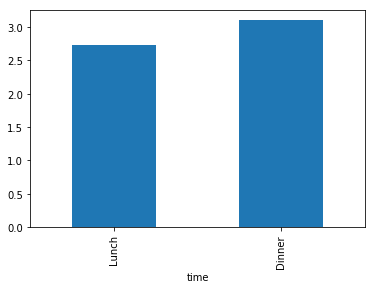
# 使用同样方式查看每一天什么时刻小费较高
time_tip = tips.groupby('time')['tip'].mean()
time_tip.plot(kind='bar')
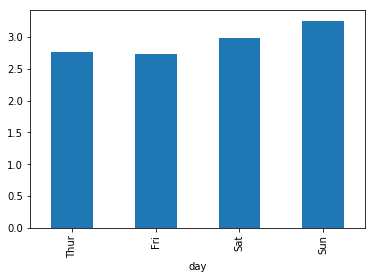
# 使用同样方式查看每周哪一天小费较高
day_tip = tips.groupby('day')['tip'].mean()
day_tip.plot(kind='bar')
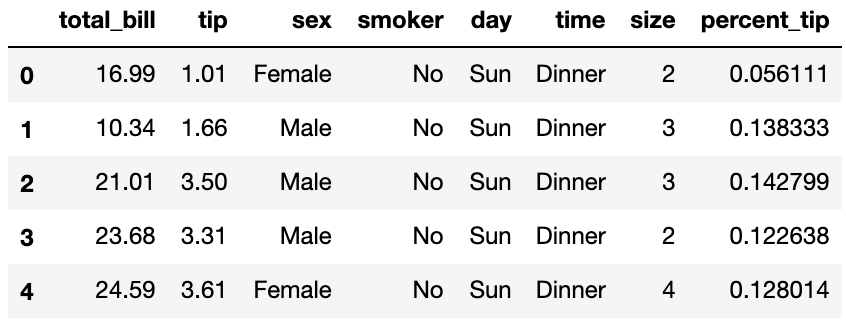
# 查看小费占总金额的分布情况
tips['percent_tip'] = tips['tip']/(tips['tip'] + tips['total_bill'])
tips.head()
# 使用直方图查看小费占比分布,从图中可以看出,小费占比分布基本符合正态分布,有个别异常点,以及左偏
tips['percent_tip'].plot(kind='hist')
评论
