使用Python分析姿态估计数据集COCO的教程
点击上方“小白学视觉”,选择加"星标"或“置顶”
重磅干货,第一时间送达
本文转自:AI算法与图像处理
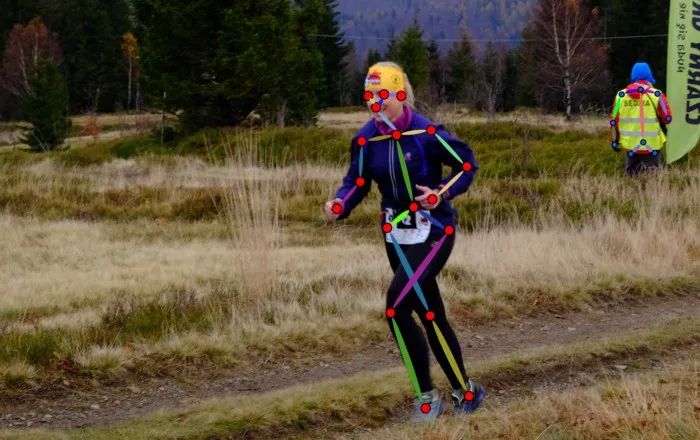
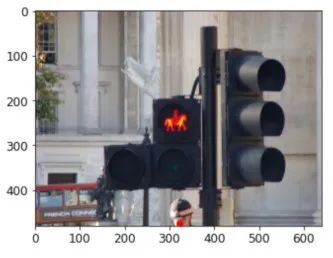
dataset_coco
   |---annotations
         |---person_keypoints_train2017.json
         |---person_keypoints_val2017.json
   |---train2017
         |---*.jpg
   |---val2017
         |---*.jpg
from pycocotools.coco import COCO
...

train_annot_path = 'dataset_coco/annotations  /person_keypoints_train2017.json'
val_annot_path = 'dataset_coco/annotations/person_keypoints_val2017.json'
train_coco = COCO(train_annot_path) # 加载训练集的注释
val_coco = COCO(val_annot_path) # 加载验证集的注释
...
# 函数遍历一个人的所有数据库并逐行返回相关数据
def get_meta(coco):
    ids = list(coco.imgs.keys())
    for i, img_id in enumerate(ids):
        img_meta = coco.imgs[img_id]
        ann_ids = coco.getAnnIds(imgIds=img_id)
        # 图像的基本参数
        img_file_name = img_meta['file_name']
        w = img_meta['width']
        h = img_meta['height']
        # 检索当前图像中所有人的元数据
        anns = coco.loadAnns(ann_ids)

        yield [img_id, img_file_name, w, h, anns]

...

# 迭代图像
for img_id, img_fname, w, h, meta in get_meta(train_coco):
    ...
    # 遍历图像的所有注释
    for m in meta:
        # m是字典
        keypoints = m['keypoints']
        ...
...
让我们将COCO元数据转换为pandas数据帧,我们使用如matplotlib、sklearn 和pandas。
def convert_to_df(coco):
    images_data = []
    persons_data = []

    # 遍历所有图像
    for img_id, img_fname, w, h, meta in get_meta(coco):
        images_data.append({
            'image_id': int(img_id),
            'path': img_fname,
            'width': int(w),
            'height': int(h)
        })

        # 遍历所有元数据
        for m in meta:
            persons_data.append({
                'image_id': m['image_id'],
                'is_crowd': m['iscrowd'],
                'bbox': m['bbox'],
                'area': m['area'],
                'num_keypoints': m['num_keypoints'],
                'keypoints': m['keypoints'],
            })

    # 创建带有图像路径的数据帧
    images_df = pd.DataFrame(images_data)
    images_df.set_index('image_id', inplace=True)

    # 创建与人相关的数据帧
    persons_df = pd.DataFrame(persons_data)
    persons_df.set_index('image_id', inplace=True)
    return images_df, persons_df
images_df, persons_df = convert_to_df(train_coco)
train_coco_df = pd.merge(images_df, persons_df, right_index=True, left_index=True)
train_coco_df['source'] = 0

images_df, persons_df = convert_to_df(val_coco)
val_coco_df = pd.merge(images_df, persons_df, right_index=True, left_index=True)
val_coco_df['source'] = 1

coco_df = pd.concat([train_coco_df, val_coco_df], ignore_index=True)
# 计数

annotated_persons_df = coco_df[coco_df['is_crowd'] == 0]
crowd_df = coco_df[coco_df['is_crowd'] == 1]

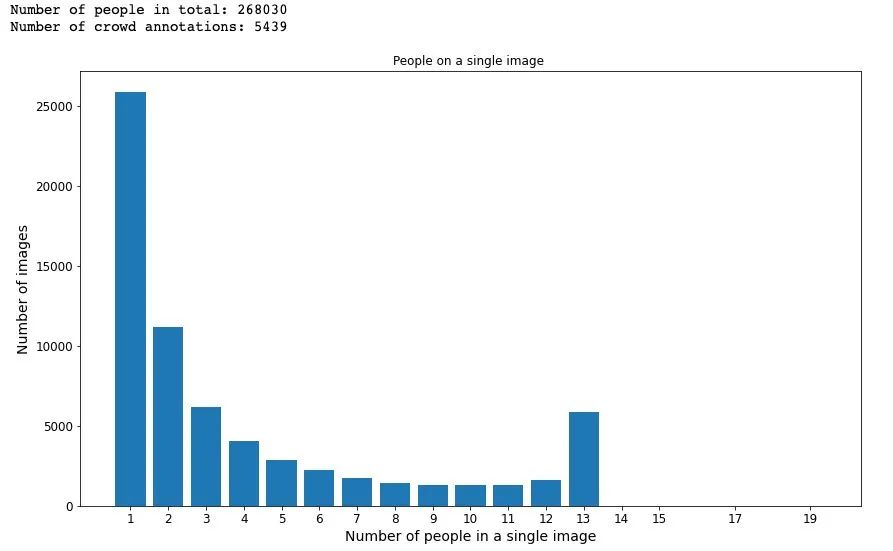
print("Number of people in total: " + str(len(annotated_persons_df)))
print("Number of crowd annotations: " + str(len(crowd_df)))

persons_in_img_df = pd.DataFrame({
    'cnt': annotated_persons_df['path'].value_counts()
})
persons_in_img_df.reset_index(level=0, inplace=True)
persons_in_img_df.rename(columns = {'index':'path'}, inplace = True)

# 按cnt分组,这样我们就可以在一张图片中得到带有注释人数的数据帧

persons_in_img_df = persons_in_img_df.groupby(['cnt']).count()

# 提取数组

x_occurences = persons_in_img_df.index.values
y_images = persons_in_img_df['path'].values

# 绘图

plt.bar(x_occurences, y_images)
plt.title('People on a single image ')
plt.xticks(x_occurences, x_occurences)
plt.xlabel('Number of people in a single image')
plt.ylabel('Number of images')
plt.show()
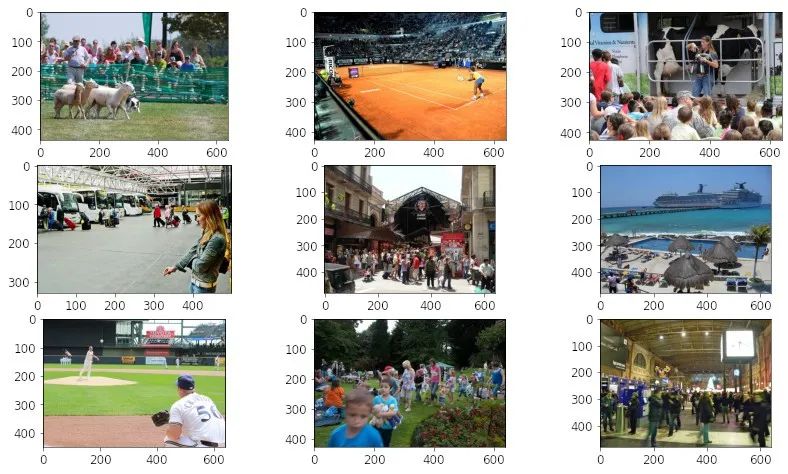
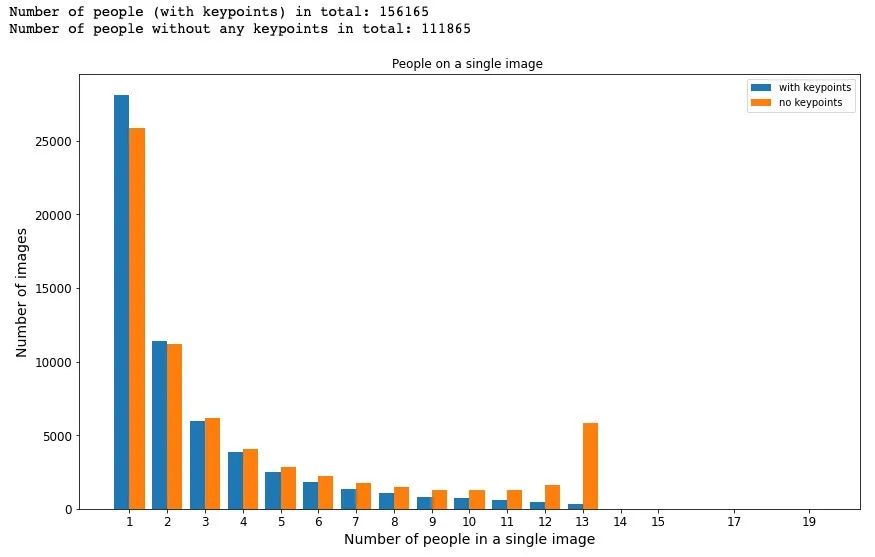
annotated_persons_nokp_df = coco_df[(coco_df['is_crowd'] == 0) & (coco_df['num_keypoints'] == 0)]
annotated_persons_kp_df = coco_df[(coco_df['is_crowd'] == 0) & (coco_df['num_keypoints'] > 0)]

print("Number of people (with keypoints) in total: " +
        str(len(annotated_persons_kp_df)))
print("Number of people without any keypoints in total: " +
        str(len(annotated_persons_nokp_df)))

persons_in_img_kp_df = pd.DataFrame({
    'cnt': annotated_persons_kp_df[['path','source']].value_counts()
})
persons_in_img_kp_df.reset_index(level=[0,1], inplace=True)
persons_in_img_cnt_df = persons_in_img_kp_df.groupby(['cnt']).count()
x_occurences_kp = persons_in_img_cnt_df.index.values
y_images_kp = persons_in_img_cnt_df['path'].values

f = plt.figure(figsize=(14, 8))
width = 0.4
plt.bar(x_occurences_kp, y_images_kp, width=width, label='with keypoints')
plt.bar(x_occurences + width, y_images, width=width, label='no keypoints')

plt.title('People on a single image ')
plt.xticks(x_occurences + width/2, x_occurences)
plt.xlabel('Number of people in a single image')
plt.ylabel('Number of images')
plt.legend(loc = 'best')
plt.show()
from sklearn.base import BaseEstimator, TransformerMixin

class AttributesAdder(BaseEstimator, TransformerMixin):
    def __init__(self, num_keypoints, w_ix, h_ix, bbox_ix, kp_ix):
        """
        :param num_keypoints: 关键点的数量
        :param w_ix: 包含图像宽度的列索引
        :param h_ix: 包含图像高度的列索引
        :param bbox_ix: 包含边框数据的列索引
        :param kp_ix: 包含关键点数据的列索引
        """
        self.num_keypoints = num_keypoints
        self.w_ix = w_ix
        self.h_ix = h_ix
        self.bbox_ix = bbox_ix
        self.kp_ix = kp_ix

    def fit(self, X, y=None):
        return self

    def transform(self, X):

        # 检索特定列

        w = X[:, self.w_ix]
        h = X[:, self.h_ix]
        bbox = np.array(X[:, self.bbox_ix].tolist())  # to matrix
        keypoints = np.array(X[:, self.kp_ix].tolist()) # to matrix

        # 计算边框的比例因子

        scale_x = bbox[:,2] / w
        scale_y = bbox[:,3] / h
        aspect_ratio = w / h

        # 计算规模类别

        scale_cat = pd.cut(scale_y,
            bins=[0., 0.4, 0.6, 0.8, np.inf],
            labels=['S', 'M', 'L', 'XL'])

        return np.c_[X, scale_x, scale_y, scale_cat, aspect_ratio, keypoints]


# 用于添加新列的transformer对象

attr_adder = AttributesAdder(num_keypoints=17, ...)
coco_extra_attribs = attr_adder.transform(coco_df.values)

# 创建列发新列表

keypoints_cols = [['x'+str(idx), 'y'+str(idx), 'v'+str(idx)]
                        for idx, k in enumerate(range(num_keypoints))]
keypoints_cols = np.concatenate(keypoints_cols).tolist()

# 创建新的更丰富的数据z帧

coco_extra_attribs_df = pd.DataFrame(
    coco_extra_attribs,
    columns=list(coco_df.columns) +
        ["scale_x", "scale_y", "scale_cat", "aspect_ratio"] +
        keypoints_cols,
    index=coco_df.index)
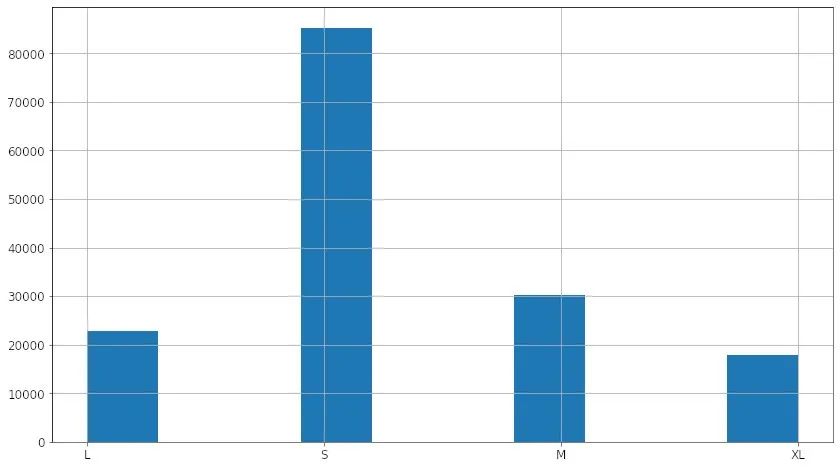
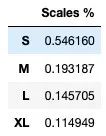
如果scale_y在[0–0.4)范围内,则类别为S 如果scale_y在[0.4–0.6)范围内,则类别为M 如果scale_y在[0.6–0.8)范围内,则类别为L 如果scale_y在[0.8–1.0)范围内,则类别为XL
# 对水平图像进行关键点坐标标准化

horiz_imgs_df = coco_extra_attribs_df[coco_extra_attribs_df['aspect_ratio'] >= 1.]

# 获取平均宽度和高度-用于缩放关键点坐标

avg_w = int(horiz_imgs_df['width'].mean())
avg_h = int(horiz_imgs_df['height'].mean())

class NoseAttributesAdder(BaseEstimator, TransformerMixin):
    def __init__(self, avg_w, avg_h, w_ix, h_ix, x1_ix, y1_ix, v1_ix):
        self.avg_w = avg_w
        self.avg_h = avg_h
        self.w_ix = w_ix
        self.h_ix = h_ix
        self.x1_ix = x1_ix
        self.y1_ix = y1_ix
        self.v1_ix = v1_ix

        def fit(self, X, y=None):
        return self

      def transform(self, X):
        w = X[:, self.w_ix]
        h = X[:, self.h_ix]
        x1 = X[:, self.x1_ix]
        y1 = X[:, self.y1_ix]

        # 标准化鼻子坐标,提供平均宽度和高度

        scale_x = self.avg_w / w
        scale_y = self.avg_h / h
        nose_x = x1 * scale_x
        nose_y = y1 * scale_y

        return np.c_[X, nose_x, nose_y]

      # 用于标准化鼻子坐标列的transformer对象

w_ix = horiz_imgs_df.columns.get_loc('width')
h_ix = horiz_imgs_df.columns.get_loc('height')
x1_ix = horiz_imgs_df.columns.get_loc('x0')  # 鼻子的x坐标在'x0'列中
y1_ix = horiz_imgs_df.columns.get_loc('y0')  # 鼻子的y坐标在'y0'列中
v1_ix = horiz_imgs_df.columns.get_loc('v0')  # 鼻头的可见性

attr_adder = NoseAttributesAdder(avg_w, avg_h, w_ix, h_ix, x1_ix, y1_ix, v1_ix)
coco_noses = attr_adder.transform(horiz_imgs_df.values)

# 使用标准化的数据创建新数据帧

coco_noses_df = pd.DataFrame(
    coco_noses,
    columns=list(horiz_imgs_df.columns) + ["normalized_nose_x", "normalized_nose_y"],
    index=horiz_imgs_df.index)

# 过滤-只有可见的鼻子

coco_noses_df = coco_noses_df[coco_noses_df["v0"] == 2]

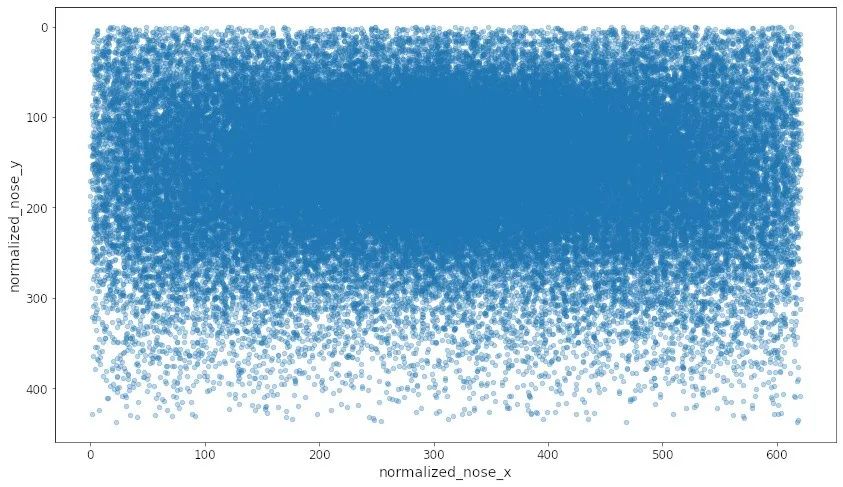
coco_noses_df.plot(kind="scatter", x="normalized_nose_x",
                   y="normalized_nose_y", alpha=0.3).invert_yaxis()
low_noses_df = coco_noses_df[coco_noses_df['normalized_nose_y'] > 430 ]
low_noses_df

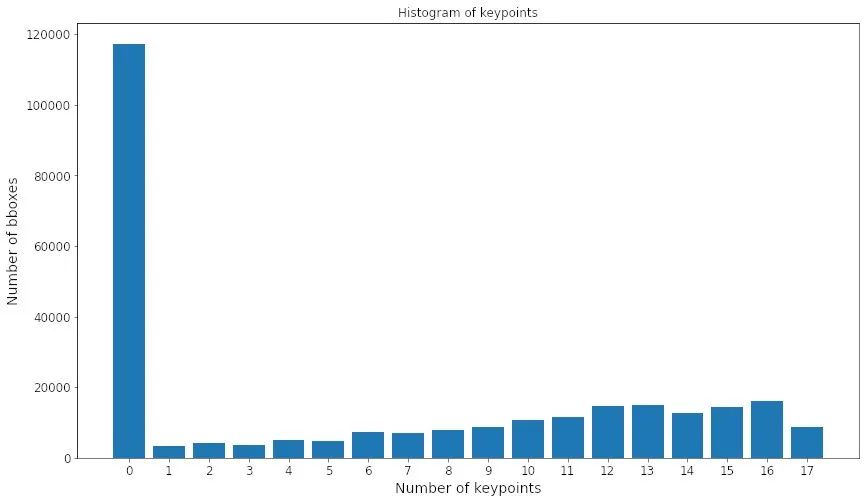
y_images = coco_extra_attribs_df['num_keypoints'].value_counts()
x_keypoints = y_images.index.values

# 绘图

plt.figsize=(10,5)
plt.bar(x_keypoints, y_images)
plt.title('Histogram of keypoints')
plt.xticks(x_keypoints)
plt.xlabel('Number of keypoints')
plt.ylabel('Number of bboxes')
plt.show()

# 带有若干关键点(行)的bboxes(列)百分比

kp_df = pd.DataFrame({
    "Num keypoints %": coco_extra_attribs_df[
                           "num_keypoints"].value_counts() / len(coco_extra_attribs_df)
}).sort_index()

persons_df = coco_extra_attribs_df[coco_extra_attribs_df['num_keypoints'] > 0]
persons_df['scale_cat'].hist()
scales_props_df = pd.DataFrame({
    "Scales": persons_df["scale_cat"].value_counts() / len(persons_df)
})
scales_props_df
persons_df = coco_extra_attribs_df[coco_extra_attribs_df['num_keypoints'] > 0]
train_df = persons_df[persons_df['source'] == 0]
val_df = persons_df[persons_df['source'] == 1]

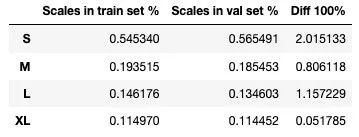
scales_props_df = pd.DataFrame({
    "Scales in train set %": train_df["scale_cat"].value_counts() / len(train_df),
    "Scales in val set %": val_df["scale_cat"].value_counts() / len(val_df)
})
scales_props_df["Diff 100%"] = 100 * \
    np.absolute(scales_props_df["Scales in train set %"] -
                scales_props_df["Scales in val set %"])
train_df = coco_extra_attribs_df[coco_extra_attribs_df['source'] == 0]
val_df = coco_extra_attribs_df[coco_extra_attribs_df['source'] == 1]

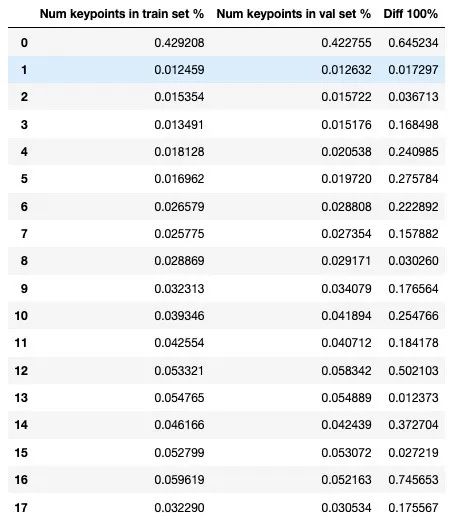
kp_props_df = pd.DataFrame({
    "Num keypoints in train set %": train_df["num_keypoints"].value_counts() /
    len(train_df),
    "Num keypoints in val set %": val_df["num_keypoints"].value_counts() /
    len(val_df)
}).sort_index()

kp_props_df["Diff 100%"] = 100 * \
    np.absolute(kp_props_df["Num keypoints in train set %"] -
                kp_props_df["Num keypoints in val set %"])
总结
交流群
欢迎加入公众号读者群一起和同行交流,目前有SLAM、三维视觉、传感器、自动驾驶、计算摄影、检测、分割、识别、医学影像、GAN、算法竞赛等微信群(以后会逐渐细分),请扫描下面微信号加群,备注:”昵称+学校/公司+研究方向“,例如:”张三 + 上海交大 + 视觉SLAM“。请按照格式备注,否则不予通过。添加成功后会根据研究方向邀请进入相关微信群。请勿在群内发送广告,否则会请出群,谢谢理解~
评论

