
如何使用 Go进行日志分析,并生成excel报表?
该使用什么工具去分析呢。最后还要生成excel表格。哇,给我愁坏了。
所以我开始并没有直接去做需求,而是去查资料、问同事、朋友,怎么做日志分析。
确实搜到了一些日志分析的方法:awk、python。无疑是用脚本来做。但是我对这些不太熟悉呀,而且只有一下午的时间去做。最后我选择了使用golang来做。相比于其他,我对golang更熟悉。
确定了语言,我就开始分析日志了,下面我就来详细介绍一下我是怎么使用go完成的日志分析,并成功生成excel表格。
# 1. 前期准备
因为公司的log不能在这里直接展示,所以本次教程我自己生成了几个测试log。
{"httpRequest":{"request":"method:post,path:/api/user/login"},"params":{"query":"username=asong&password=123456"},"timings":{"evalTotalTime":0.420787431}}
{"httpRequest":{"request":"method:post,path:/api/user/login"},"params":{"query":"username=asong&password=123456"},"timings":{"evalTotalTime":0.420787431}}
{"httpRequest":{"request":"method:post,path:/api/user/login"},"params":{"query":"username=asong&password=123456"},"timings":{"evalTotalTime":0.420787431}}
{"httpRequest":{"request":"method:post,path:/api/user/login"},"params":{"query":"username=asong&password=123456"},"timings":{"evalTotalTime":0.420787431}}
{"httpRequest":{"request":"method:post,path:/api/user/login"},"params":{"query":"username=asong&password=123456"},"timings":{"evalTotalTime":0.420787431}}
{"httpRequest":{"request":"method:post,path:/api/user/login"},"params":{"query":"username=asong&password=123456"},"timings":{"evalTotalTime":0.420787431}}
{"httpRequest":{"request":"method:post,path:/api/user/login"},"params":{"query":"username=asong&password=123456"},"timings":{"evalTotalTime":0.420787431}}
{"httpRequest":{"request":"method:post,path:/api/user/login"},"params":{"query":"username=asong&password=123456"},"timings":{"evalTotalTime":0.420787431}}
{"httpRequest":{"request":"method:post,path:/api/user/login"},"params":{"query":"username=asong&password=123456"},"timings":{"evalTotalTime":0.420787431}}
{"httpRequest":{"request":"method:post,path:/api/user/login"},"params":{"query":"username=asong&password=123456"},"timings":{"evalTotalTime":0.420787431}}
这些log正常都在一行的,因为markdown显示问题,显示了多行。
# 2. 日志分析
分析之前,先看一下我们的需求:分析每个请求的次数,查询参数,平均时间。
确定了需求,下面我们开始对日志进行分析。每一行代表一个完整的日志请求。每一行日志都是一个json字符串,这样看起来确实不方便,我们格式化一下来看一下。
{
    "httpRequest":{
        "request":"method:post,path:/api/user/login"
    },
    "params":{
        "query":"username=asong&password=123456"
    },
    "timings":{
        "evalTotalTime":0.420787431
    }
}
这样看起来就很方便了,层次结构一眼就能看出来。我们要统计请求的次数,可以通过requrst这个字段判断是否是同一个请求。query这个字段代表的是查询参数,evalTotalTime这个字段需要求和,然后求出平均数。日志分析好了,下面就是实现部分了。
# 3. 代码实现
代码实现日志分析
这里我使用一个map来存放不同的请求,以请求作为key,请求次数、时间等作为value,不过这里存的时间所有请求的时间和,统计好所有请求次数与时间和后再计算平均时间。这样所有分析好的数据就都在map里了,最后可针对这个map进行excel导出,是不是很完美,哈哈。
定义map,需要统计的字段用struct封装。
var (
 result map[string]*requestBody
 analysis map[string]*requestBody
)

type requestBody struct {
 count int32
 query string
 time float64
}
因为日志文件中一行代表一个完整的日志,所以我们可以按行读取日志,然后分析处理。
func openFile() *os.File {
 file,err := os.Open("./request.log")
 if err != nil{
  log.Println("open log err: ",err)
 }
 return file
}

func logDeal(file *os.File)  {
 // 按行读取
 br := bufio.NewReader(file)
 for{
  line,_,err := br.ReadLine()
  // file read complete
  if err == io.EOF{
   log.Println("file read complete")
   return
  }
  //json deal
  var data interface{}
  err = json.Unmarshal(line,&data)
  if err != nil{
   fmt.Errorf("json marshal error")
  }
  deal(data)
 }
}
按行读取好数据后,开始对每一条日志进行分析,提取字段。可以使用golang的
json.Unmarshal,配合类型断言,分析出每一个字段做处理。
func deal(data interface{})  {
 var request string
 var query string
 var time float64
 value,ok := data.(map[string]interface{})
 if ok{
  for k,v := range value{
   if k == "httpRequest"{
    switch v1 := v.(type) {
    case map[string]interface{}:
     for k1,v11 := range v1{
      if k1 == "request"{
       switch val := v11.(type) {
       case string:
        request = val
        //fmt.Println(request)
       }
      }
     }
    }
   }
   if k == "params"{
    switch v1 := v.(type) {
    case map[string]interface{}:
     for k1,v11 := range v1{
      if k1 == "query"{
       switch val := v11.(type) {
       case string:
        query = val
        //fmt.Println(query)
       }
      }
     }
    }
   }
   if k == "timings"{
    switch v1 := v.(type) {
    case map[string]interface{}:
     for k1,v11 := range v1{
      if k1 == "evalTotalTime"{
       switch val := v11.(type) {
       case float64:
        time = val
       // fmt.Println(time)
       }
      }
     }
    }
   }
  }
  b := &requestBody{
   query: query,
   time: time,
  }
  if _,o := result[request];o{
   b.count = result[request].count + 1
   b.time = b.time + result[request].time
   result[request] = b
  }else {
   b.count = 1
   result[request] = b
  }
 }
}
统计好所有的请求次数与请求时间和后,我们还需要进一步处理,得到每次请求的平均时间。
//analysis data
func analysisBody()  {
 for k,v := range result{
  req := &requestBody{}
  req.time = v.time / float64(v.count)
  req.count = v.count
  req.query = v.query
  analysis[k] = req
 }
}
分析好了日志后,下面我们开始导出excel。
倒出excel文件
这里使用的是excelize库。首先进行安装:
go get github.com/360EntSecGroup-Skylar/excelize
excelize 详细的文档请点击:https://xuri.me/excelize/zh-hans/。这里就不讲解具体的使用方法了,直接上代码了。可以推荐一个博客,我也是在这上面学习的。传送门。这个库还可以合并单元格,更多玩法,欢迎解锁。
导出代码示例如下:
type cellValue struct {
 sheet string
 cell string
 value string
}
//export excel
func exportExcel()  {
 file := excelize.NewFile()
 //insert title
 cellValues := make([]*cellValue,0)
 cellValues = append(cellValues,&cellValue{
  sheet: "sheet1",
  cell: "A1",
  value: "request",
 },&cellValue{
  sheet: "sheet1",
  cell: "B1",
  value: "count",
 },&cellValue{
  sheet: "sheet1",
  cell: "C1",
  value: "query",
 },&cellValue{
  sheet: "sheet1",
  cell: "D1",
  value: "avgTime",
 })
 index := file.NewSheet("Sheet1")
 // 设置工作簿的默认工作表
 file.SetActiveSheet(index)
 for _, cellValue := range cellValues {
  file.SetCellValue(cellValue.sheet, cellValue.cell, cellValue.value)
 }
 //insert data
 cnt := 1
 for k,v := range analysis{
  cnt = cnt + 1
  for k1,v1 := range cellValues{
   switch k1 {
   case 0:
    v1.cell = fmt.Sprintf("A%d",cnt)
    v1.value = k
   case 1:
    v1.cell = fmt.Sprintf("B%d",cnt)
    v1.value = fmt.Sprintf("%d",v.count)
   case 2:
    v1.cell = fmt.Sprintf("C%d",cnt)
    v1.value = v.query
   case 3:
    v1.cell = fmt.Sprintf("D%d",cnt)
    v1.value = strconv.FormatFloat(v.time,'f',-1,64)
   }
  }
  for _,vc := range cellValues{
   file.SetCellValue(vc.sheet,vc.cell,vc.value)
  }
 }

 //generate file
 err := file.SaveAs("./log.xlsx")
 if err != nil{
  fmt.Errorf("generate excel error")
 }
}
# 4. 结果展示
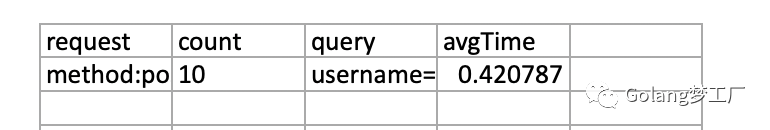
怎么样,还可以吧,我们可以看到请求次数与平均时间,一目了然。
我也是第一次使用go进行日志分析。总体来说还是挺方便的。最主要是导出excel真的很方便。你学会了吗?

⬇⬇⬇