用pyecharts绘制带动画效果的“时间轮播图”
本文说明
大家好,欢迎来到 Crossin的编程教室 !
今天我们要分享的是一个数据可视化的案例。
在讲述本文之前,为了满足大家的好奇心,我们先来看看最终做出来的效果呈现。
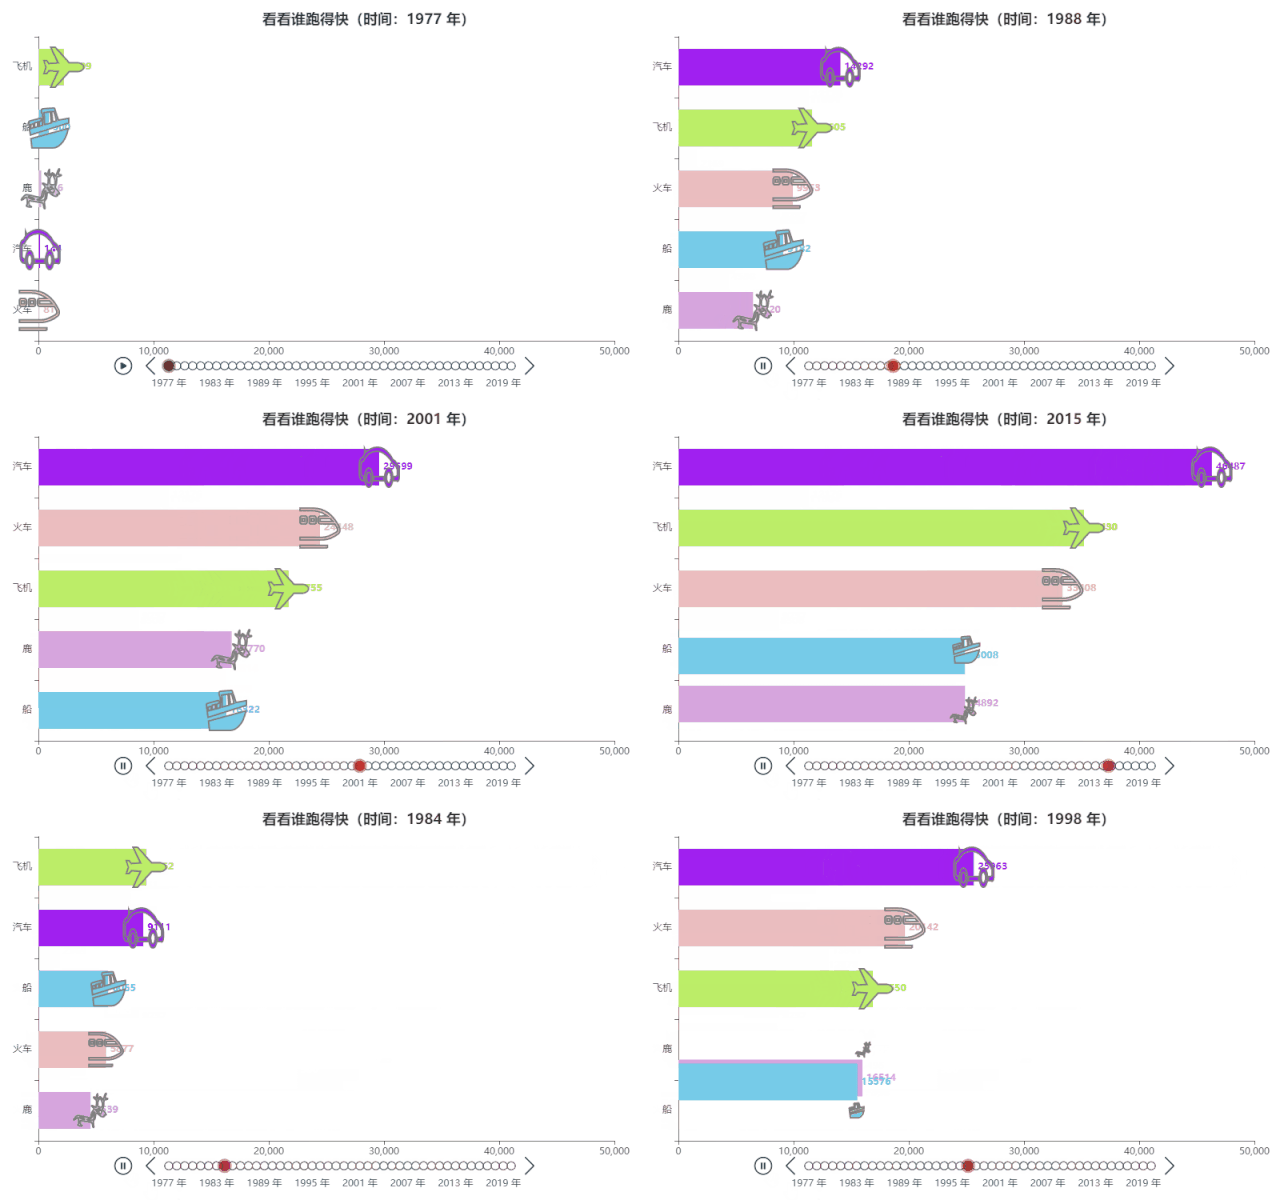
不管学习什么技术,官网是最好的老师。对于pyecharts绘图库,知道了他的绘图原理后,不管绘制任何图形难度并不是很大,唯一难住我们的就是pyecharts的参数太多,我们并不会用,因此就必须学会使用官网,查阅各种方法的详细参数。
下图是官方提供的绘制时间轮播图的一个案例,本文就是借助这个案例的代码,完成今天这个文章的操作。
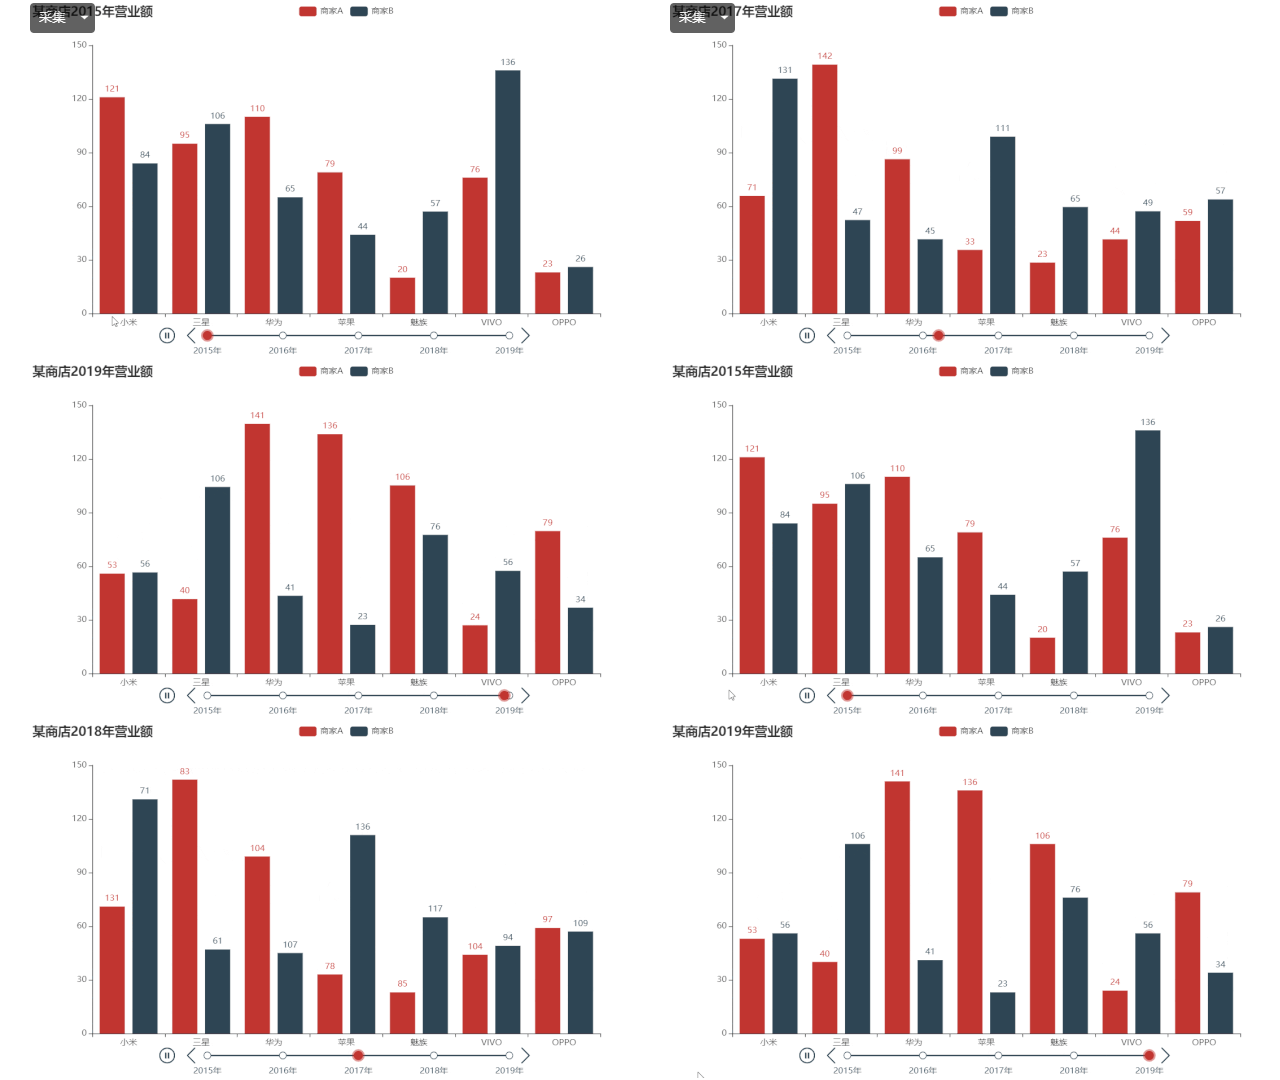
接下来,我们一步步为大家讲解。
1. 构造数据
1)导入相关库
import random
import pandas as pd
import math
2)构造数据
cats0 = ["鹿", "飞机", "火车", "船", "汽车"]
color0 = ["#D6A5DD", "#BCEE68", "#EBBDBF", "#76CBE8", "#A020F0"]
year0 = list(range(1977, 2021))
year = []
for i in year0:
    for j in range(len(cats0)):
        year.append(i)
print(year[:20])
-------------------------------------------------------------
cats = cats0 * len(year0)
print("cats的值为:", cats[:20])

color = color0 * len(year0)
print("color的值为:", color[:20])
-------------------------------------------------------------
value = []
for i in year:
    value.append(math.pow(random.randint(0,50), 2))
print(value[:20])
-------------------------------------------------------------
df = pd.DataFrame()
df["year"] = year
df["value"] = value
df["cats"] = cats
df["color"] = color
df["csum"] = df.groupby(["cats"])["value"].cumsum()
df.head(10)
结果如下:
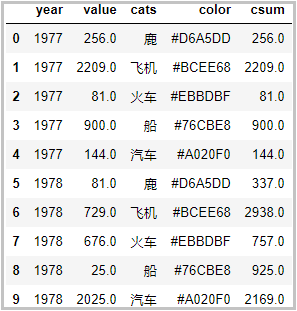
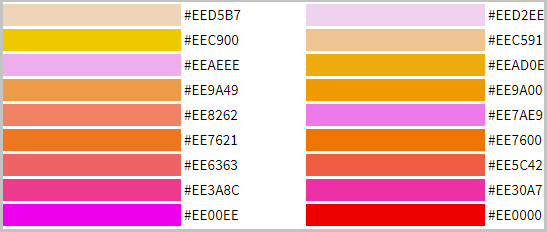
关于数据构造这一块儿的代码,应该很容易,这里就不一一赘述了,但是有一点我需要说明:关于颜色的调整。这里我提供一个网址给大家,如何配色好看取决于你们自己。
颜色选择:http://suo.im/6luxuy
这里插入一句:我这里pyecharts的官网老是打不开,不知道是怎么回事。因此关于图中一些参数的说明,我就不一一介绍了。
那么你应该怎么学呢?其实很容易。打开官网,用到了什么参数,就把这个参数粘贴到官网中,进行查询。由于pyecharts的官网是中文,相信大家不会有什么难度。
pyecharts的官网:http://suo.im/5CmOrt2. 使用官网代码绘制时间轮播图
from pyecharts import options as opts
from pyecharts.charts import Bar, Timeline

tl = Timeline()
for i in range(1977,2021):
    df_sub = df[df["year"]==i].sort_values(by="csum")
    cats_list = list(df_sub["cats"])
    csum_list = list(df_sub["csum"])
    color_list = list(df_sub["color"])
    y = []

    bar = (
        Bar(init_opts=opts.InitOpts(width='720px', height='320px'))
        .add_xaxis(xaxis_data=cats_list)
        .add_yaxis(series_name='', yaxis_data=csum_list, label_opts = opts.LabelOpts(position="right",font_weight="bold"),category_gap=30)
        .reversal_axis()
        .set_global_opts(
            title_opts = opts.TitleOpts("看看谁跑得快(时间:{} 年)".format(i),pos_left=350,padding=[30,20]),
            xaxis_opts = opts.AxisOpts(max_=50000)
        )
    )
    tl.add(bar, "{} 年".format(i))
    tl.add_schema(play_interval=300, is_loop_play=False)
tl.render("a.html")
结果如下:
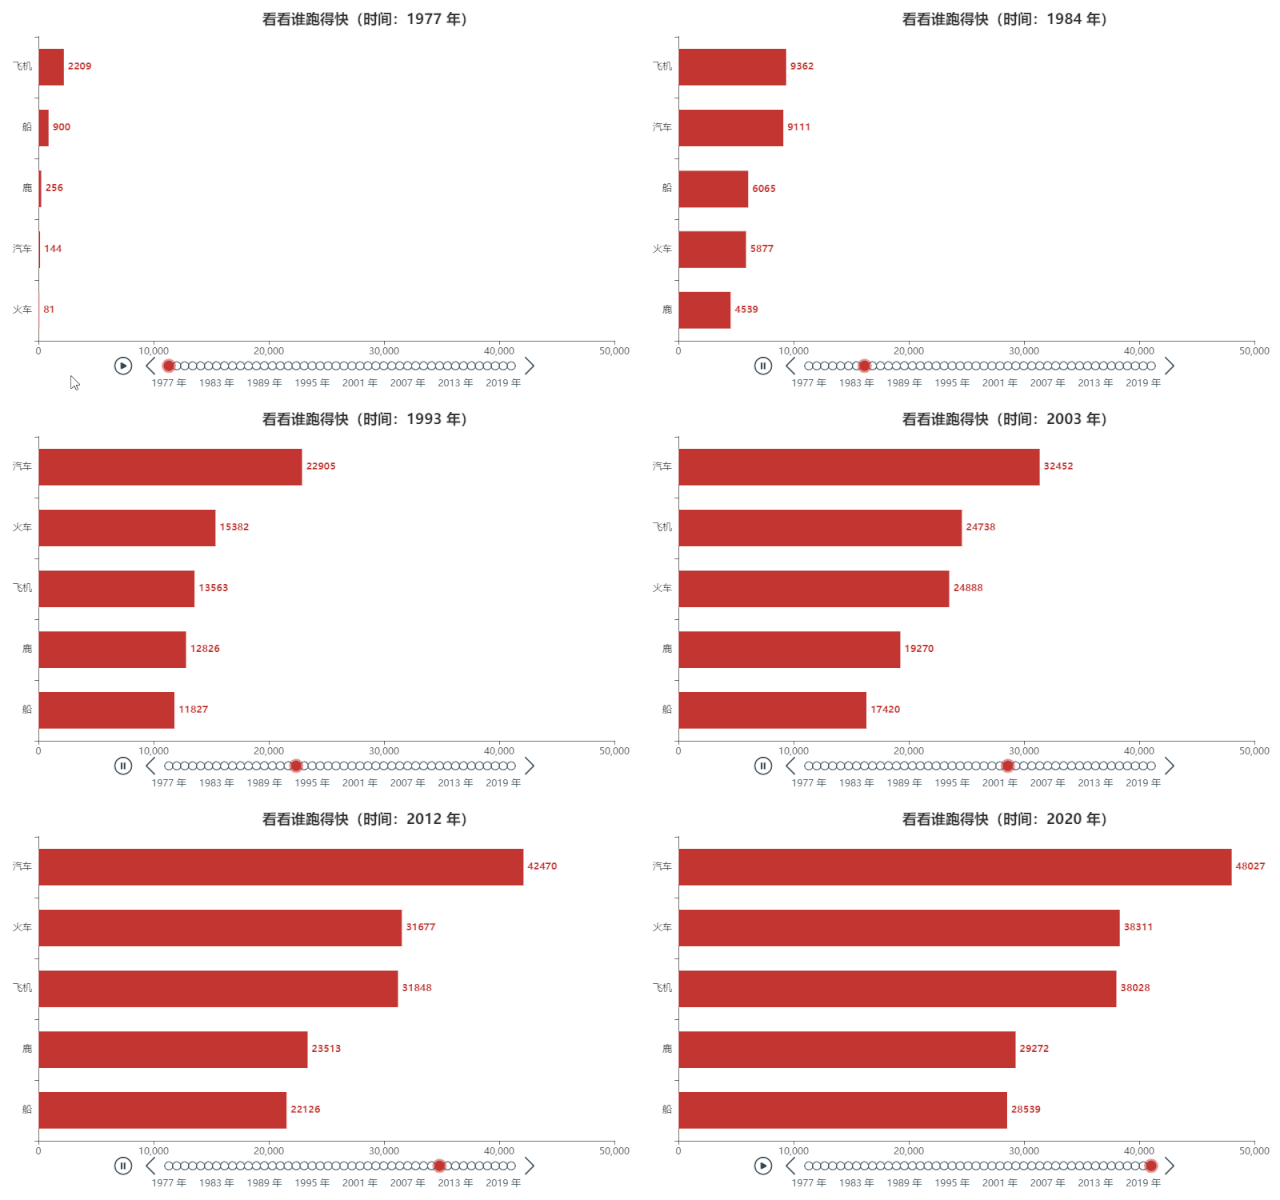
观察上图可以发现:效果看起来还不错,有一点不太好的就是颜色太单调。
3. 不同的柱形条,显示不同的颜色
from pyecharts import options as opts
from pyecharts.charts import Bar, Timeline

tl = Timeline()
for i in range(1977,2021):
    df_sub = df[df["year"]==i].sort_values(by="csum")
    cats_list = list(df_sub["cats"])
    csum_list = list(df_sub["csum"])
    color_list = list(df_sub["color"])
    y = []
    for j in range(5):
        y.append(
            opts.BarItem(
                name = cats_list[j],
                value = csum_list[j],
                itemstyle_opts = opts.ItemStyleOpts(color=color_list[j])
            )
        )

    bar = (
        Bar(init_opts=opts.InitOpts(width='720px', height='320px'))
        .add_xaxis(xaxis_data=cats_list)
        .add_yaxis(series_name='', yaxis_data=y, label_opts = opts.LabelOpts(position="right",font_weight="bold"),category_gap=30)
        .reversal_axis()
        .set_global_opts(
            title_opts = opts.TitleOpts("看看谁跑得快(时间:{} 年)".format(i),pos_left=350,padding=[30,20]),
            xaxis_opts = opts.AxisOpts(max_=50000)
        )
    )
    tl.add(bar, "{} 年".format(i))
    tl.add_schema(play_interval=300, is_loop_play=False)
tl.render("b.html")
结果如下:
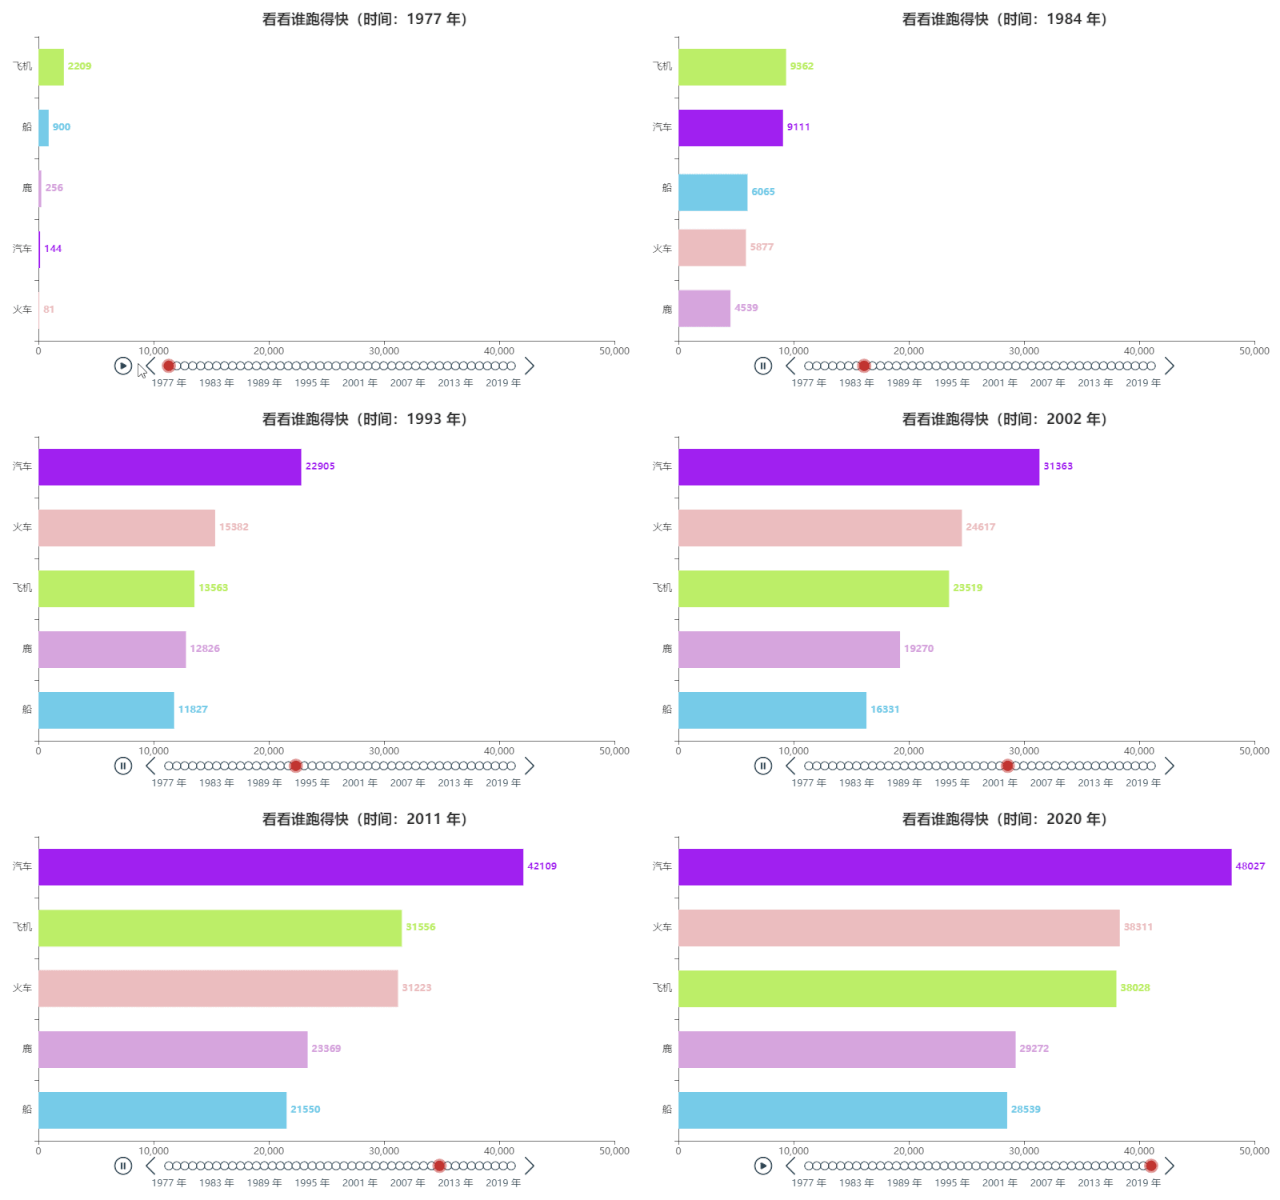
观察上图可以发现:此时我们已经为不同的柱形条,加上了不同的颜色,但是如果能为每个柱形条,加上“图形标志”就完美了。4. 给不同柱形条加上特殊标志
from pyecharts import options as opts
from pyecharts.charts import Bar, Timeline

symbols = {
    '鹿':'path://M807.911811 243.502362c-4.837795 10.48189-12.900787 33.058268-18.544882 50.796851-5.644094 17.738583-14.513386 42.733858-20.15748 56.440944-9.675591 24.188976-9.675591 24.188976-24.188977-5.644094-7.256693-16.932283-16.932283-28.220472-20.963779-25.801575-12.094488 7.256693-6.450394 50.79685 9.67559 77.404725 18.544882 30.63937 22.576378 108.044094 6.450394 129.814173-8.869291 11.288189-16.125984 12.094488-48.377953 4.837795-38.702362-8.869291-38.702362-8.869291-37.896063-66.116535 0-42.733858 4.837795-64.503937 15.319685-82.24252 49.990551-78.211024 52.409449-104.818898 6.450394-55.634646-30.63937 31.445669-46.765354 33.864567-31.445669 4.837796 4.837795-9.675591 8.869291-36.283465 8.869291-59.666142-0.806299-38.702362-1.612598-41.12126-12.094488-27.414173-6.450394 8.062992-13.707087 30.63937-16.932283 49.990551-5.644094 37.896063-11.288189 42.733858-27.414174 23.382677-5.644094-6.450394-15.319685-12.094488-20.963779-12.094488-21.770079 0-11.288189 23.382677 23.382677 52.409449 33.864567 28.220472 33.864567 28.220472 26.607874 103.206299-4.031496 40.314961-8.062992 75.792126-9.675591 77.404724-1.612598 1.612598-17.738583-6.450394-35.477165-18.544882-53.215748-34.670866-78.211024-24.188976-32.251968 13.707087 32.251969 27.414173 31.445669 55.634646-0.8063 84.661417-21.770079 19.351181-25.801575 29.833071-33.058267 88.692914-10.48189 82.24252-0.806299 80.629921-167.710237 33.864567-29.026772-8.062992-69.341732-16.932283-91.111811-19.351182-32.251969-4.031496-40.314961-2.418898-52.409448 12.900788-7.256693 8.869291-23.382677 28.220472-35.477166 42.733858-12.900787 14.513386-22.576378 32.251969-22.576378 40.314961 0 12.900787 1.612598 12.900787 22.576378 0 12.094488-8.062992 30.63937-23.382677 41.12126-33.864567 27.414173-27.414173 36.283465-13.707087 41.12126 62.891338 3.225197 50.79685 1.612598 66.922835-7.256693 71.76063-20.96378 11.288189-2.418898 30.63937 34.670866 36.283465 50.79685 8.062992 62.891339 1.612598 31.445669-16.932284-24.995276-14.513386-26.607874-18.544882-26.607874-58.859842 0-42.733858 0-42.733858 25.801575-37.896063 14.513386 2.418898 70.148031 11.288189 123.36378 19.351181 96.755906 14.513386 96.755906 14.513386 106.431496 45.959055 4.837795 17.738583 9.675591 41.927559 9.67559 54.022047 0.806299 20.15748 13.707087 37.089764 21.770079 28.220473 2.418898-2.418898 0-33.864567-4.837795-70.148032-8.869291-62.891339-8.062992-67.729134 8.062992-84.661417 19.351181-20.96378 32.251969-60.472441 32.251968-102.4 0-63.697638 24.188976-72.566929 70.954331-24.188976 33.864567 34.670866 84.661417 54.022047 108.044095 41.12126 15.319685-8.062992 20.15748-23.382677 6.450393-23.382678-4.031496 0-8.062992-4.031496-8.062992-8.062992 0-4.837795 11.288189-8.062992 24.188977-8.062992 13.707087 0 24.188976-1.612598 24.188976-4.031496 0-9.675591-26.607874-57.247244-39.508661-69.341732-38.702362-39.508661-51.60315-66.922835-33.058268-73.373229 8.869291-2.418898 23.382677-96.755906 24.188976-149.165354 0-33.058268 0-33.058268 40.314961-42.733858 25.801575-6.450394 40.314961-13.707087 40.31496-21.770079 0-7.256693-7.256693-11.288189-17.738582-10.48189-10.48189 0.806299-22.576378 1.612598-26.607874 0.8063-10.48189-0.806299-5.644094-63.697638 4.837795-70.148032 8.869291-5.644094 9.675591-43.540157 0.806299-43.540157-4.031496 0-11.288189 8.062992-16.125984 17.738582zM689.385827 569.247244c10.48189 4.031496 11.288189 6.450394 2.418897 12.094488-16.125984 10.48189-30.63937 8.869291-30.63937-4.837795 0-12.900787 7.256693-15.319685 28.220473-7.256693zM637.782677 604.724409c10.48189 29.026772 33.864567 32.251969 60.472441 7.256693 17.738583-16.932283 17.738583-16.932283 29.833071 2.418898 7.256693 10.48189 10.48189 27.414173 8.062992 40.314961-4.031496 19.351181-8.062992 22.576378-33.864567 22.576378-24.188976 0-34.670866-5.644094-62.891338-37.896063-36.283465-39.508661-43.540157-58.859843-21.770079-58.859843 6.450394 0 16.125984 10.48189 20.15748 24.188976z m-53.215748 66.116536c-3.225197 14.513386-7.256693 49.990551-9.67559 78.211024-4.031496 56.440945-9.675591 66.116535-47.571654 79.017322-26.607874 9.675591-99.981102-0.806299-99.981102-13.707086 0-3.225197 16.932283-8.062992 37.896063-10.48189 58.053543-6.450394 75.792126-30.63937 87.080315-120.944882 4.031496-31.445669 8.062992-37.896063 21.770078-37.896063 14.513386 0 15.319685 3.225197 10.48189 25.801575zM717.606299 693.417323c0 4.031496-4.031496 8.062992-8.869291 8.062992-4.031496 0-5.644094-4.031496-3.225197-8.062992 2.418898-4.837795 6.450394-8.062992 8.869291-8.062992 1.612598 0 3.225197 3.225197 3.225197 8.062992z m-415.244094 72.566929c2.418898 4.031496 12.900787 8.062992 22.576378 8.062992 20.15748 0 54.022047 20.96378 54.022047 33.058268 0 19.351181-103.206299-16.932283-111.269291-39.508662-3.225197-11.288189 27.414173-12.900787 34.670866-1.612598z',
    '飞机':'path://M181.881905 610.06019l206.116571 12.580572-196.510476 387.413333h119.466667l365.421714-380.440381h229.961143c60.757333 0 152.478476-47.981714 152.478476-107.178666 0-59.14819-91.721143-107.178667-152.478476-107.178667h-229.863619L310.905905 34.816h-119.466667l196.510476 381.025524-223.085714 15.555047c-5.36381 0-10.48381 0.633905-15.652571 1.170286l-64.365715-69.241905H13.994667l54.223238 159.98781 0.877714 2.584381-55.100952 153.112381H84.845714l66.316191-71.387429 30.72 2.438095z',
    '火车':'path://M477.491 204.8a68.267 68.267 0 0 1 68.267 68.267v68.266A68.267 68.267 0 0 1 477.49 409.6h-102.4a68.267 68.267 0 0 1-68.266-68.267v-68.266A68.267 68.267 0 0 1 375.09 204.8h102.4z m-102.4 136.533h102.4v-68.266h-102.4v68.266zM785.067 819.2H0v-68.267h750.353c116.736 2.902 274.671-42.325 473.77-135.714a68.267 68.267 0 0 0 26.864-101.069c-31.813-45.226-58.71-80.076-80.657-104.55H682.223a68.267 68.267 0 0 1-68.267-68.267v-68.266a68.267 68.267 0 0 1 68.267-68.267H918.8A1014.443 1014.443 0 0 0 409.395 68.267H0V0h409.293c392.533 0.273 726.46 173.807 925.764 512 9.626 24.644 12.63 48.845 9.148 72.602-3.55 23.722-21.504 48.708-53.897 74.922C1139.132 751.89 970.752 805.103 785.067 819.2z m236.544-546.133H682.12v68.266h421.068a1026.867 1026.867 0 0 0-81.578-68.266zM68.267 204.8h102.4a68.267 68.267 0 0 1 68.266 68.267v68.266a68.267 68.267 0 0 1-68.266 68.267h-102.4A68.267 68.267 0 0 1 0 341.333v-68.266A68.267 68.267 0 0 1 68.267 204.8z m0 136.533h102.4v-68.266h-102.4v68.266zM920.95 1024H0v-68.267h920.883V1024h0.068z',
    '船':'path://M98.1 811.8h510.1c78.1 0 304.4-37.9 382.6-265.1L72.6 685.5l25.5 126.3z m650.4-378.9s-82.4-137.3-89.3-151.5c-6.7-14.2-25.5-12.7-25.5-12.7s-257.3 9.4-280.5 12.7c-20 2.8-25.5 9.2-25.5 25.2 0 27.9 38.2 43.3 38.2 88.4 0 18.5-12.8 110.4-12.8 110.4L276.8 518v-63s28.3-6.4 39.7-9.4c12.8-3.4 11.3-12.7 11.3-12.7v-12.7c0-18.5-25.5-12.7-25.5-12.7s-217 30.8-255.9 38c-32.9 6.1-25 25.8-25 25.8L59.9 635l943.6-164.2v-63.1l-255 25.2zM136.5 534l-63.7 12.7L60 496.2l76.5-12.7V534z m101.9-12.6l-76.5 12.7V471l76.5-12.7v63.1z m165.8-25.3V382.5c0-26.2-12.8-50.5-12.8-50.5l153-12.7c6.7 15 12.8 50.5 12.8 50.5L570 470.9l-165.8 25.2z m204-37.8c-8.4-82-25.9-141.7-25.9-141.7l49.6-3c36.2 46.5 65.5 132 65.5 132l-89.2 12.7z',
    '汽车':'path://M740.288 548.256c-54 0-97.76 44.336-97.76 99.04s43.776 99.04 97.76 99.04 97.76-44.336 97.76-99.04-43.76-99.04-97.76-99.04z m0 154.064c-30 0-54.304-24.64-54.304-55.024s24.32-55.024 54.304-55.024c30 0 54.304 24.64 54.304 55.024 0.016 30.4-24.304 55.024-54.304 55.024z m-358.464-22H620.8v-44.016H381.824v44.016z m456.224-220.096S620.8 249.552 229.744 372.192c0 0-13.088 3.808-31.392 12.208l-33.776-34.224v52.48c-14.864 9.392-30.16 21.136-43.456 35.552 0 0-86.896-6.288-86.896 88.048v66.032s-12.416 91.184 108.624 88.048V636.32h22.368c-0.4 3.616-0.64 7.28-0.64 11.008 0 54.704 43.776 99.04 97.76 99.04s97.76-44.336 97.76-99.04-43.776-99.04-97.76-99.04c-50.32 0-91.712 38.528-97.12 88.032-88.496-2.016-86.928-31.568-86.928-31.568v-75.76c0-60.288 57.216-49.664 57.216-49.664 39.472-38.4 120.4-75.76 120.4-75.76 355.248-99.824 582.128 100.704 582.128 100.704 61.904 1.36 108.624 60.56 108.624 60.56v53.76c-2.816 25.136-86.896 17.744-86.896 17.744v44.016h65.168s62.08 25.152 65.184-44.016v-66.032c0.016-0.032-6.192-72.352-152.064-110.08zM262.336 592.272c30 0 54.304 24.64 54.304 55.024s-24.32 55.024-54.304 55.024c-30 0-54.304-24.64-54.304-55.024s24.32-55.024 54.304-55.024z'
}

tl = Timeline()
for i in range(1977,2021):
    df_sub = df[df["year"]==i].sort_values(by="csum")
    cats_list = list(df_sub["cats"])
    csum_list = list(df_sub["csum"])
    color_list = list(df_sub["color"])
    y = []
    for j in range(5):
        y.append(
            opts.BarItem(
                name = cats_list[j],
                value = csum_list[j],
                itemstyle_opts = opts.ItemStyleOpts(color=color_list[j])
            )
        )

    bar = (
        Bar(init_opts=opts.InitOpts(width='720px', height='320px'))
        .add_xaxis(xaxis_data=cats_list)
        .add_yaxis(series_name='', yaxis_data=y, label_opts = opts.LabelOpts(position="right",font_weight="bold"),category_gap=30,
                   markpoint_opts = opts.MarkPointOpts(
                       data = [
                           opts.MarkPointItem(name="",coord=[csum_list[0],cats_list[0]],symbol=symbols[cats_list[0]],
                                             itemstyle_opts=opts.ItemStyleOpts(color=color_list[0],border_color="grey")),
                           opts.MarkPointItem(name="",coord=[csum_list[1],cats_list[1]],symbol=symbols[cats_list[1]],
                                             itemstyle_opts=opts.ItemStyleOpts(color=color_list[1],border_color="grey")),
                           opts.MarkPointItem(name="",coord=[csum_list[2],cats_list[2]],symbol=symbols[cats_list[2]],
                                             itemstyle_opts=opts.ItemStyleOpts(color=color_list[2],border_color="grey")),
                           opts.MarkPointItem(name="",coord=[csum_list[3],cats_list[3]],symbol=symbols[cats_list[3]],
                                             itemstyle_opts=opts.ItemStyleOpts(color=color_list[3],border_color="grey")),
                           opts.MarkPointItem(name="",coord=[csum_list[4],cats_list[4]],symbol=symbols[cats_list[4]],
                                             itemstyle_opts=opts.ItemStyleOpts(color=color_list[4],border_color="grey")),
                       ]
                   )
                  )
        .reversal_axis()
        .set_global_opts(
            title_opts = opts.TitleOpts("看看谁跑得快(时间:{} 年)".format(i),pos_left=350,padding=[30,20]),
            xaxis_opts = opts.AxisOpts(max_=50000)
        )
    )
    tl.add(bar, "{} 年".format(i))
    tl.add_schema(play_interval=300, is_loop_play=True)
tl.render("c.html")
结果如下:

5. 如何获取图形的矢量化地址
观察上述代码,可以发现有类似于下图这样的代码,这个是什么呢?其实就是这些标志的矢量化代码,那么我们如何获取这些小图形的矢量化代码呢?这里先提供给大家一个网站。
获取图像的矢量化地址:http://suo.im/6dXHdH
那么如何获取图形的矢量化地址呢?我们详细讲解一下他的步骤。
① 打开上述网址

② 搜索你要展示的图形
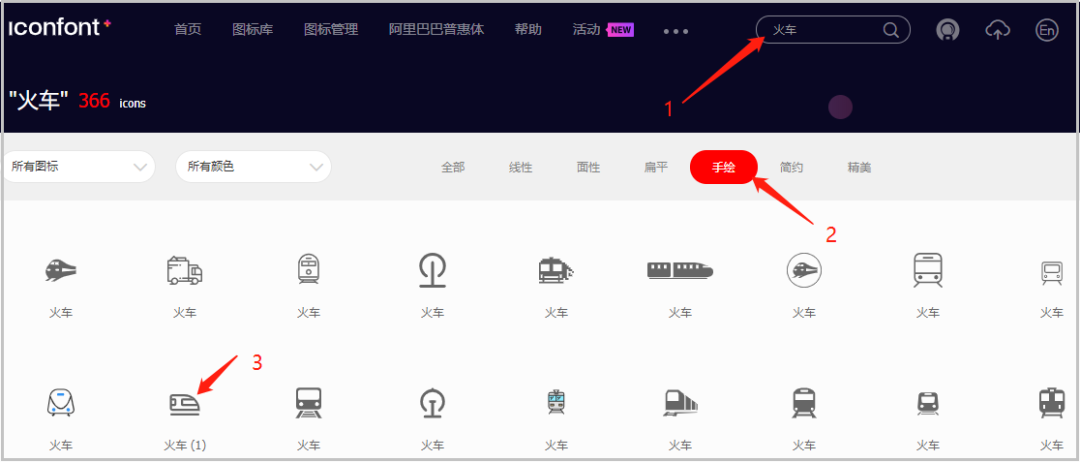
③ 选择一个喜欢的图形,下载其svg格式图形
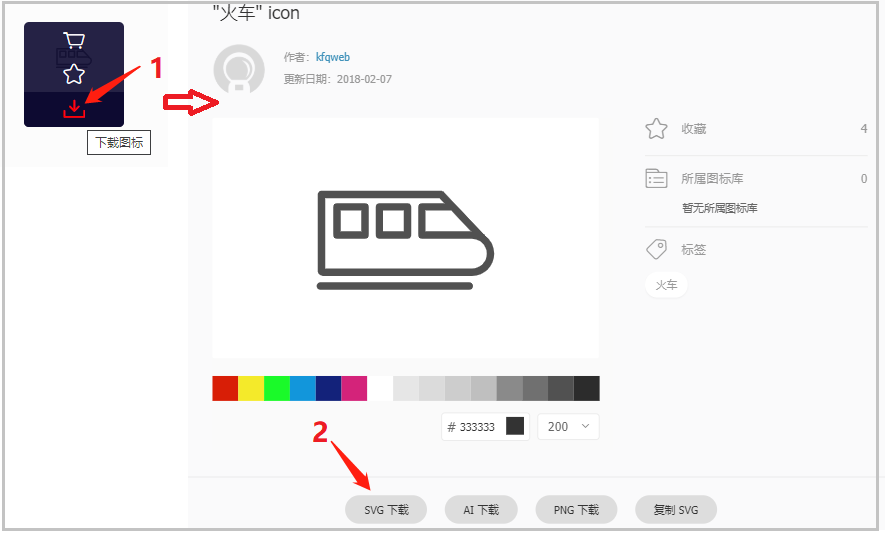
④ 用“记事本”打开这个图片文件

⑤ 复制它的path路径

大功告成!
你可以根据上述方法,在需要做数据展示的时候,也创建这样一个直观的动态轮播图,想必一定会让人眼前一亮。
如果文章对你有帮助,欢迎转发/点赞/收藏~
作者:黄伟呢
_往期文章推荐_
