在一个热图中使用多个颜色主题
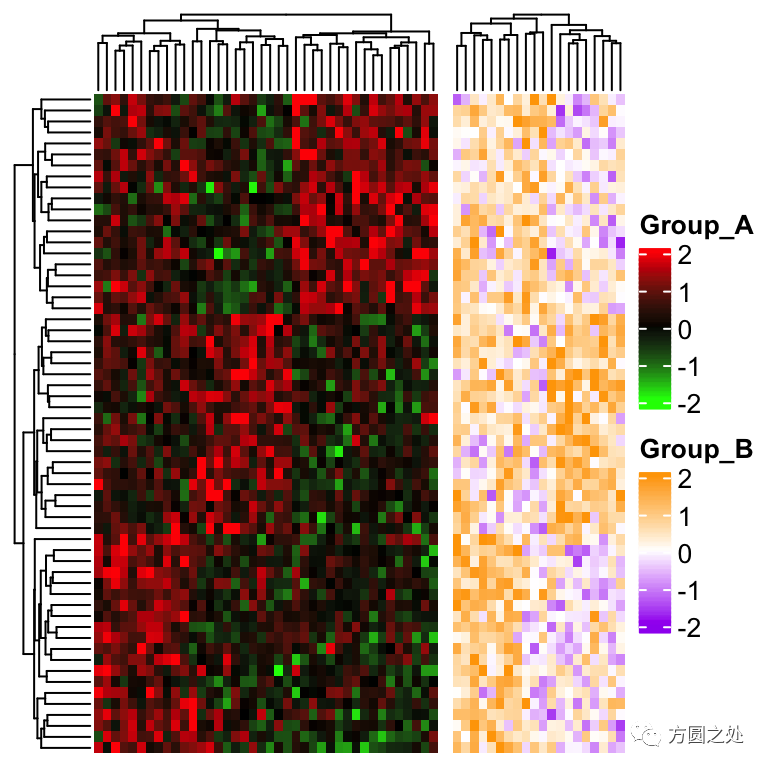
有一些用户希望在一个热图中使用多个颜色主题,可能是为了突出组间的差异。如果组与组(例如不同的列)也在热图上分隔出来(比如使用column split),那么每个组可以创建为单独的热图,然后将这些列表拼接起来。
在下面的例子中,我们假设热图在列上有两组,组A和组B。其中组A使用颜色:绿色-黑色-红色,组B使用紫色-白色-橘色。
set.seed(123)
mat = cbind(rbind(matrix(rnorm(20*20, mean = 1, sd = 0.5), nr = 20),
              matrix(rnorm(20*20, mean = 0, sd = 0.5), nr = 20),
              matrix(rnorm(20*20, mean = 0, sd = 0.5), nr = 20)),
       rbind(matrix(rnorm(20*20, mean = 0, sd = 0.5), nr = 20),
              matrix(rnorm(20*20, mean = 1, sd = 0.5), nr = 20),
              matrix(rnorm(20*20, mean = 0, sd = 0.5), nr = 20)),
       rbind(matrix(rnorm(20*20, mean = 0.5, sd = 0.5), nr = 20),
              matrix(rnorm(20*20, mean = 0.5, sd = 0.5), nr = 20),
              matrix(rnorm(20*20, mean = 1, sd = 0.5), nr = 20))
       ) + matrix(rnorm(60*60, sd = 0.5), nr = 60)
group = rep(c("A", "B"), times = c(40, 20))
group = sample(group, length(group))

library(circlize)
library(ComplexHeatmap)

col1 = colorRamp2(c(-2, 0, 2), c("green", "black", "red"))
col2 = colorRamp2(c(-2, 0, 2), c("purple", "white", "orange"))

ht1 = Heatmap(mat[, group == "A"], col = col1, name = "Group_A")
ht2 = Heatmap(mat[, group == "B"], col = col2, name = "Group_B")
ht1 + ht2

这个方法的问题在于对于行的聚类只是来自于第一个热图,也就是对应于组A的子矩阵。这个问题可以通过如下方法解决:在构建热图之前,使用完整的矩阵进行对列的聚类,然后将聚类结果保存在一个变量中,最后在draw()函数中,将此聚类变量赋予cluser_rows变量。
row_hlust = hclust(dist(mat))
draw(ht1 + ht2, cluster_rows = row_hlust)
好,现在,或许有人会说,不,我不想将原始的矩阵分开,我就是想将其作为一个完整的矩阵。那么此时,热图必须要包含两种不同的颜色主题,那么,一般的绘制热图的方法将不能使用,我们得手动根据当前不同的颜色主题绘制热图的格子。我们将使用cell_fun或layer_fun参数来手动绘制热图。
首次,我们要关闭默认的热图格子绘制,这可以在Heatmap()函数中设置rect_gp = gpar(type = "none"),同时,热图的legend也不用绘制,这可以设置show_heatmap_legend = FALSE。我们会手动生成对应于两个颜色主题的legend。
下面的代码展示了如何通过cell_fun来手动绘制热图格子。其中,当当前格子属于组A时,我们用col1颜色主题,而当当前格子属于组B时,我们用col2颜色主题。
ht = Heatmap(mat, rect_gp = gpar(type = "none"), show_heatmap_legend = FALSE,
    cell_fun = function(j, i, x, y, w, h, fill) {
        if(group[j] == "A") {
            grid.rect(x, y, w, h, gp = gpar(fill = col1(mat[j, i]), col = NA))
        } else {
            grid.rect(x, y, w, h, gp = gpar(fill = col2(mat[j, i]), col = NA))
        }
    })
然后我们根据col1和col2创建两个legend:
draw(ht, heatmap_legend_list = list(
    Legend(title = "Group_A", col_fun = col1),
    Legend(title = "Group_B", col_fun = col2)
))
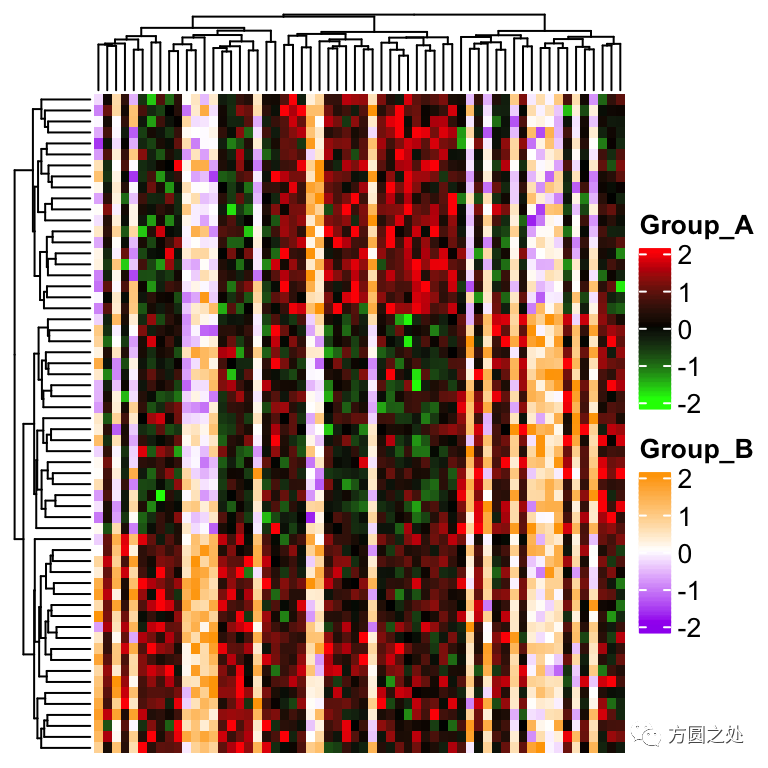
cell_fun是一个格子一个格子画的。如果热图很大时,使用cell_fun可能会变得很慢,那么我们可以使用其向量化(vectorized)的版本:layer_fun,见如下代码。关于layer_fun的具体解释请见ComplexHeatmap book。
ht = Heatmap(mat, rect_gp = gpar(type = "none"), show_heatmap_legend = FALSE,
    layer_fun = function(j, i, x, y, w, h, fill) {
        l = group[j] == "A"
        grid.rect(x[l], y[l], w[l], h[l],
            gp = gpar(fill = col1(pindex(mat, i[l], j[l])), col = NA))
        l = group[j] == "B"
        grid.rect(x[l], y[l], w[l], h[l],
            gp = gpar(fill = col2(pindex(mat, i[l], j[l])), col = NA))
    })
draw(ht, heatmap_legend_list = list(
    Legend(title = "Group_A", col_fun = col1),
    Legend(title = "Group_B", col_fun = col2)
))
这生成和上图一模一样的图。

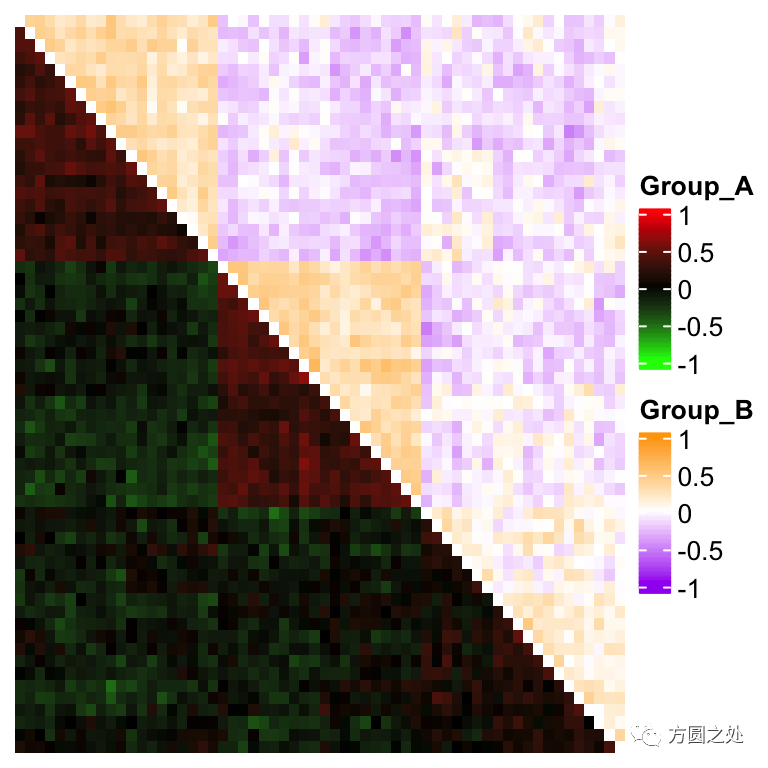
我们可以使用相同的方法对一个对称的矩阵添加两个不同的颜色主题(上三角矩阵和下三角矩阵):
corm = cor(mat)
col1 = colorRamp2(c(-1, 0, 1), c("green", "black", "red"))
col2 = colorRamp2(c(-1, 0, 1), c("purple", "white", "orange"))

# here reordering the symmetric matrix is necessary
od = hclust(dist(corm))$order
corm = corm[od, od]

ht = Heatmap(corm, rect_gp = gpar(type = "none"), show_heatmap_legend = FALSE,
    cluster_rows = FALSE, cluster_columns = FALSE,
    layer_fun = function(j, i, x, y, w, h, fill) {
        l = i > j
        grid.rect(x[l], y[l], w[l], h[l],
            gp = gpar(fill = col1(pindex(corm, i[l], j[l])), col = NA))
        l = i < j
        grid.rect(x[l], y[l], w[l], h[l],
            gp = gpar(fill = col2(pindex(corm, i[l], j[l])), col = NA))
    })
draw(ht, heatmap_legend_list = list(
    Legend(title = "Group_A", col_fun = col1),
    Legend(title = "Group_B", col_fun = col2)
))

点击链接
http://www.ehbio.com/Cloud_Platform/front/#/
在线绘制上面所有图形
往期精品(点击图片直达文字对应教程)
后台回复“生信宝典福利第一波”或点击阅读原文获取教程合集


