
使用 Prometheus 和 Grafana 监控 Rust Web 应用程序
项目不能裸奔,监控必不可少。本文介绍如何对 Rust Web 应用进行监控。
01 概述
在本文中,我将向你展示如何设置 Rust Web 应用程序的监控。该应用程序将公开 Prometheus 指标,这些指标将使用 Grafana 进行可视化。监控的应用是 mongodb-redis demo[1],这里[2]有详细介绍 。最终架构如下:
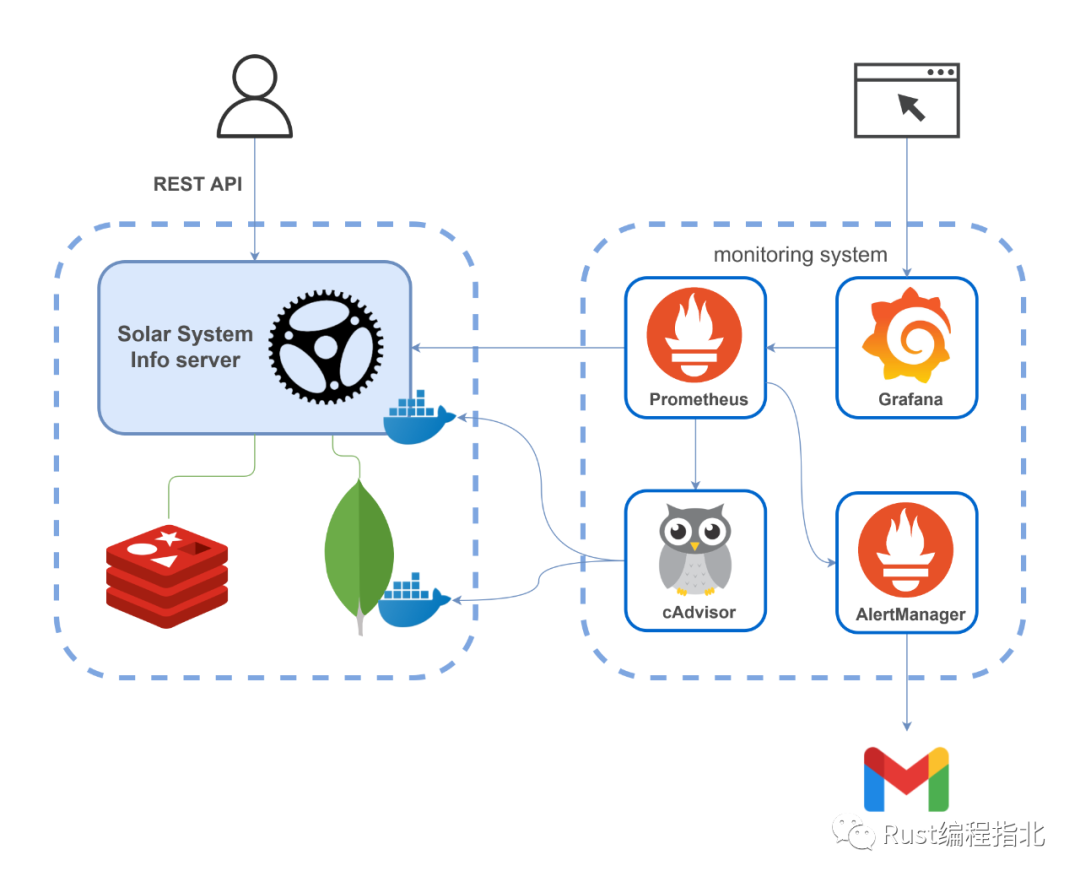
监控系统包括:
Prometheus[3] — 收集实时指标并将其记录在时间序列数据库中的监控平台 Grafana[4] — 可观察性和数据可视化平台 AlertManager[5] — 处理 Prometheus 服务器发送的警报(例如,当你的应用程序出现问题时)并通过电子邮件、Slack、Telegram 或其他渠道通知最终用户的应用程序 cAdvisor[6] — 一个平台,可让容器用户了解其正在运行的容器的资源使用情况和性能特征。(实际上,它收集有关方案中所有 Docker 容器的信息
要一次启动所有工具,你可以使用以下命令:
清单 1. Docker Compose 文件[7]
version: '3.8'
services:

  prometheus:
    image: prom/prometheus:latest
    container_name: prometheus
    restart: always
    ports:
      - '9090:9090'
    volumes:
      - ./monitoring/prometheus:/etc/prometheus
    command:
      - '--config.file=/etc/prometheus/prometheus.yml'
      - '--web.external-url=http://localhost:9090'

  grafana:
    image: grafana/grafana:latest
    container_name: grafana
    restart: always
    ports:
      - '3000:3000'
    volumes:
      - ./monitoring/grafana/data:/var/lib/grafana
      - ./monitoring/grafana/provisioning:/etc/grafana/provisioning
    environment:
      - GF_SECURITY_ADMIN_USER=admin
      - GF_SECURITY_ADMIN_PASSWORD=admin

  alertmanager:
    image: prom/alertmanager:latest
    container_name: alertmanager
    ports:
      - '9093:9093'
    volumes:
      - ./monitoring/alertmanager:/etc/alertmanager
    command:
      - '--config.file=/etc/alertmanager/alertmanager.yml'
      - '--web.external-url=http://localhost:9093'

  cadvisor:
    image: gcr.io/cadvisor/cadvisor:latest
    container_name: cadvisor
    restart: always
    ports:
      - '8080:8080'
    volumes:
      - /:/rootfs:ro
      - /var/run:/var/run:rw
      - /sys:/sys:ro
      - /var/lib/docker/:/var/lib/docker:ro
02 在 Rust 应用程序中公开 Prometheus 指标
指标展示是用prometheus crate[8] 实现的。
Prometheus 指标有四种核心类型[9]:计数器、仪表、直方图和摘要。前三个将在文章中介绍(该 crate 目前不支持[10] 摘要类型)。
指标定义
可以通过以下方式创建和注册指标:
清单 2.指标创建和注册[11]
lazy_static! {
    pub static ref HTTP_REQUESTS_TOTAL: IntCounterVec = register_int_counter_vec!(
        opts!("http_requests_total", "HTTP requests total"),
        &["method", "path"]
    )
    .expect("Can't create a metric");
    pub static ref HTTP_CONNECTED_SSE_CLIENTS: IntGauge =
        register_int_gauge!(opts!("http_connected_sse_clients", "Connected SSE clients"))
            .expect("Can't create a metric");
    pub static ref HTTP_RESPONSE_TIME_SECONDS: HistogramVec = register_histogram_vec!(
        "http_response_time_seconds",
        "HTTP response times",
        &["method", "path"],
        HTTP_RESPONSE_TIME_CUSTOM_BUCKETS.to_vec()
    )
    .expect("Can't create a metric");
}
在上面的代码片段中,自定义指标被添加到默认注册表中;也可以在自定义注册表中注册它们(参见 示例[12])。
此外,将详细描述度量的目的和用途。
计数器
如果我们想统计所有传入的 HTTP 请求,可以使用 IntCounter[13] 类型。但是不仅可以查看请求的总数,还可以查看其他一些维度,例如请求的路径和方法,这会更有用。这可以通过 IntCounterVec[14] 完成;HTTP_REQUESTS_TOTAL该类型用于自定义 Actix 中间件,如下所示:
清单3.使用[15] HTTP_REQUESTS_TOTAL 度量
let request_method = req.method().to_string();
let request_path = req.path();
metrics::HTTP_REQUESTS_TOTAL
    .with_label_values(&[&request_method, request_path])
    .inc();
向 API 发出一些请求后,将产生如下内容:
清单 4. HTTP_REQUESTS_TOTAL 指标的输出
# HELP http_requests_total HTTP requests total
# TYPE http_requests_total counter
http_requests_total{method="GET",path="/"} 1
http_requests_total{method="GET",path="/events"} 1
http_requests_total{method="GET",path="/favicon.ico"} 3
http_requests_total{method="GET",path="/metrics"} 22
http_requests_total{method="GET",path="/planets"} 20634
度量的每个样本都有method和path 标签(度量的属性),因此 Prometheus 可以区分样本。
如上一个片段所示,还观察到对 GET /metrics(Prometheus 服务器从中收集应用程序指标的端点)的请求。
计量器
Gauge 与计数器的不同之处在于它的值可以下降。仪表示例显示了当前使用 SSE 连接的客户端数量。仪表的使用方法如下:
清单5.使用[16] HTTP_CONNECTED_SSE_CLIENTS度量
crate::metrics::HTTP_CONNECTED_SSE_CLIENTS.inc();

crate::metrics::HTTP_CONNECTED_SSE_CLIENTS.set(broadcaster_mutex.clients.len() as i64)
访问 http://localhost:9000,将建立通过 SSE 的连接,并且指标将增加。之后,它的输出将如下所示:
清单 6. HTTP_CONNECTED_SSE_CLIENTS 指标的输出
# HELP http_connected_sse_clients Connected SSE clients
# TYPE http_connected_sse_clients gauge
http_connected_sse_clients 1
广播器
为了实现 SSE 客户端规范,需要重构应用程序的代码并 实现[17] 广播器。它将所有连接的(使用sse function[18])客户端存储在一个向量中,并定期 ping 每个客户端(在remove_stale_clients function 中[19])以确保连接仍然有效,否则从向量中删除断开连接的客户端。广播器只允许打开一个 Redis Pub/Sub 连接[20];来自它的消息被发送(广播)到所有客户端。
直方图
在本指南中,直方图[21]用于收集有关响应时间的数据。与请求计数器的情况一样,跟踪是在 Actix 中间件中完成的;它是使用以下代码实现的:
清单 7.响应时间观察[22]
let request_method = req.method().to_string();
let request_path = req.path();
let histogram_timer = metrics::HTTP_RESPONSE_TIME_SECONDS
    .with_label_values(&[&request_method, request_path])
    .start_timer();

histogram_timer.observe_duration();
我认为这种方法并不精确(问题是这一时间比实际响应时间少多少),但观察数据将有助于作为直方图的示例,并在 Grafana 进一步可视化。
直方图采样观察并在可配置的桶中对它们进行计数(有默认的桶,但很可能你需要定义为你的用例定制的桶);要配置它们,很高兴知道度量值的大致分布。在此应用程序中,响应时间非常小,因此使用以下配置:
清单 8.响应时间段[23]
const HTTP_RESPONSE_TIME_CUSTOM_BUCKETS: &[f64; 14] = &[
    0.0005, 0.0008, 0.00085, 0.0009, 0.00095, 0.001, 0.00105, 0.0011, 0.00115, 0.0012, 0.0015,
    0.002, 0.003, 1.0,
];
输出如下所示(仅显示部分数据以节省空间):
清单 9. HTTP_RESPONSE_TIME_SECONDS 指标的输出
# HELP http_response_time_seconds HTTP response times
# TYPE http_response_time_seconds histogram
http_response_time_seconds_bucket{method="GET",path="/planets",le="0.0005"} 0
http_response_time_seconds_bucket{method="GET",path="/planets",le="0.0008"} 6
http_response_time_seconds_bucket{method="GET",path="/planets",le="0.00085"} 1307
http_response_time_seconds_bucket{method="GET",path="/planets",le="0.0009"} 10848
http_response_time_seconds_bucket{method="GET",path="/planets",le="0.00095"} 22334
http_response_time_seconds_bucket{method="GET",path="/planets",le="0.001"} 31698
http_response_time_seconds_bucket{method="GET",path="/planets",le="0.00105"} 38973
http_response_time_seconds_bucket{method="GET",path="/planets",le="0.0011"} 44619
http_response_time_seconds_bucket{method="GET",path="/planets",le="0.00115"} 48707
http_response_time_seconds_bucket{method="GET",path="/planets",le="0.0012"} 51495
http_response_time_seconds_bucket{method="GET",path="/planets",le="0.0015"} 57066
http_response_time_seconds_bucket{method="GET",path="/planets",le="0.002"} 59542
http_response_time_seconds_bucket{method="GET",path="/planets",le="0.003"} 60532
http_response_time_seconds_bucket{method="GET",path="/planets",le="1"} 60901
http_response_time_seconds_bucket{method="GET",path="/planets",le="+Inf"} 60901
http_response_time_seconds_sum{method="GET",path="/planets"} 66.43133770000004
http_response_time_seconds_count{method="GET",path="/planets"} 60901
数据显示落入特定观察值桶中的观察值数量。输出还提供有关总计数和观测值总和的信息。
系统指标
process功能支持导出进程指标[24],例如 CPU 或内存使用情况。你所需要的只是在Cargo.toml 之后,你会得到这样的东西:
清单 10. process 度量的输出
# HELP process_cpu_seconds_total Total user and system CPU time spent in seconds.
# TYPE process_cpu_seconds_total counter
process_cpu_seconds_total 134.49
# HELP process_max_fds Maximum number of open file descriptors.
# TYPE process_max_fds gauge
process_max_fds 1048576
# HELP process_open_fds Number of open file descriptors.
# TYPE process_open_fds gauge
process_open_fds 37
# HELP process_resident_memory_bytes Resident memory size in bytes.
# TYPE process_resident_memory_bytes gauge
process_resident_memory_bytes 15601664
# HELP process_start_time_seconds Start time of the process since unix epoch in seconds.
# TYPE process_start_time_seconds gauge
process_start_time_seconds 1636309802.38
# HELP process_threads Number of OS threads in the process.
# TYPE process_threads gauge
process_threads 6
# HELP process_virtual_memory_bytes Virtual memory size in bytes.
# TYPE process_virtual_memory_bytes gauge
process_virtual_memory_bytes 439435264
请注意,prometheuscrate 支持导出在 Linux 上运行的应用程序的进程指标(例如在 这样[25] 的 Docker 容器中)。
指标展示的端点
Actix 配置为使用此处理程序处理 GET/metrics 请求:
清单 11.指标处理程序[26]
pub async fn metrics() -> Result {
    let encoder = TextEncoder::new();
    let mut buffer = vec![];
    encoder
        .encode(&prometheus::gather(), &mut buffer)
        .expect("Failed to encode metrics");

    let response = String::from_utf8(buffer.clone()).expect("Failed to convert bytes to string");
    buffer.clear();

    Ok(HttpResponse::Ok()
        .insert_header(header::ContentType(mime::TEXT_PLAIN))
        .body(response))
}
现在,在成功配置应用程序后,你可以通过执行 GET http://localhost:9000/metrics 请求来获取之前描述的所有指标。Prometheus 服务器使用端点来收集应用程序的指标。
指标以简单的基于文本的格式[27]公开。
03 用于指标收集的 Prometheus 设置
Prometheus 使用以下配置收集(抓取)指标:
清单 12.用于度量收集的 Prometheus 配置[28]
scrape_configs:

  - job_name: mongodb_redis_web_app
    scrape_interval: 5s
    static_configs:
      - targets: ['host.docker.internal:9000']

  - job_name: cadvisor
    scrape_interval: 5s
    static_configs:
      - targets: ['cadvisor:8080']
在配置中,指定了两个作业(jobs)。前者收集应用程序之前描述的指标,后者收集运行容器的资源使用和性能指标(将在关于 cAdvisor 的部分详细描述)。scrape_interval 指定抓取目标的频率。metrics_path参数未指定,因此 Prometheus 期望指标可用于路径上的目标/metrics。
表达式浏览器和图形界面
要使用 Prometheus 的内置表达式浏览器,请打开 http://localhost:9090/graph 并尝试查询前面描述的任何指标,例如,http_requests_total。使用 “Graph” 选项卡可视化数据。
PromQL[29] 允许你进行更复杂的查询;让我们考虑几个例子。
返回带有指标
http_requests_total和给定作业的所有时间序列:
http_requests_total{job="mongodb_redis_web_app"}
`job`和`instance`标签[会自动连接](https://prometheus.io/docs/concepts/jobs_instances/ "会自动连接")到由 Prometheus 服务器记下的时间序列。

- 在最近 5 分钟内测量的传入请求的每秒返回率:

```rust
rate(http_requests_total[5m])
你可以在此处[30]找到更多示例。
04 用于度量可视化的 Grafana 设置
在这个项目中,Grafana 配置如下:
数据源(Grafana 将从那里请求数据)
清单 13. Grafana 的数据源配置[31]
apiVersion: 1

datasources:
  - name: Prometheus
    type: prometheus
    access: proxy
    url: prometheus:9090
    isDefault: true
仪表板提供程序(Grafana 将从那里加载仪表板)
清单 14. Grafana 的仪表板配置[32]
apiVersion: 1

providers:
  - name: 'default'
    folder: 'default'
    type: file
    allowUiUpdates: true
    updateIntervalSeconds: 30
    options:
      path: /etc/grafana/provisioning/dashboards
      foldersFromFilesStructure: true
启动 Docker Compose[33] 文件中指定的项目后,打开 http://localhost:3000/,使用admin/admin 凭据登录,然后找到webapp_metrics仪表板。稍后,它看起来像这样:
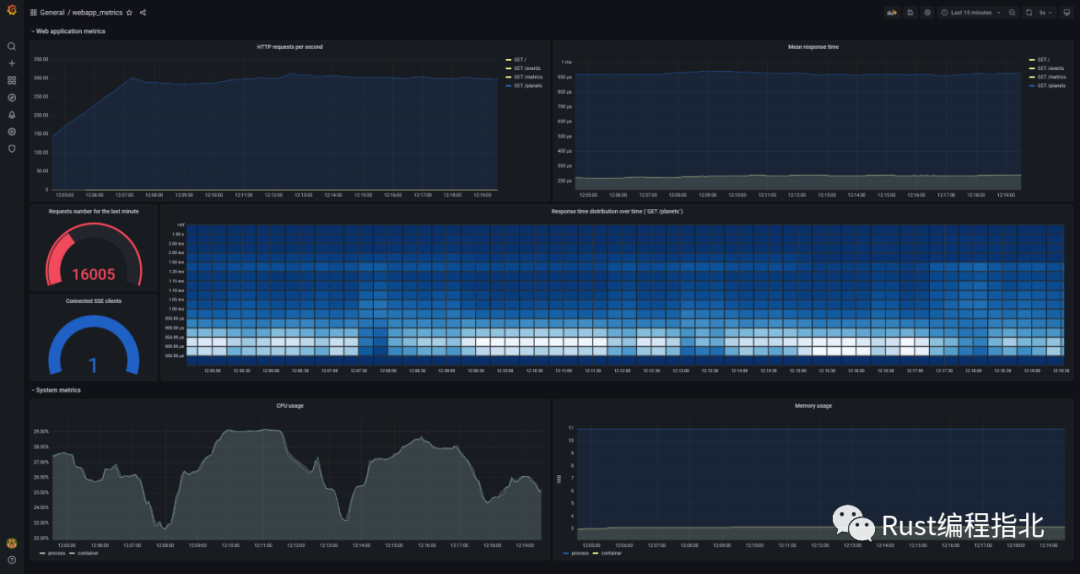
仪表板显示应用程序在简单负载测试下的状态。(如果你启动一些负载测试,为了更好地查看图形(特别是直方图),你需要以某种方式禁用MAX_REQUESTS_PER_MINUTE 限制[34],例如,通过该数字的急剧增加。)
为了可视化数据,仪表板[35] 使用 PromQL 查询,这些查询利用了之前描述的指标,例如:
rate(http_response_time_seconds_sum[5m]) / rate(http_response_time_seconds_count[5m])显示过去五分钟的平均响应时间
sum(increase(http_response_time_seconds_bucket{path="/planets"}[30s])) by (le)用于以热图[36]的形式可视化响应时间分布。热图就像直方图,但随着时间的推移,每个时间片代表自己的直方图
rate(process_cpu_seconds_total{job="mongodb_redis_web_app"}[1m]),sum(rate(container_cpu_usage_seconds_total{name='mongodb-redis'}[1m])) by (name)
显示过去五分钟的 CPU 使用率。请求的数据来自两个不同的来源,分别显示进程和容器的 CPU 使用率。两张图几乎一模一样。(sum使用是因为container_cpu_usage_seconds_total提供了有关每个内核使用情况的信息。
05 使用 cAdvisor 监控应用容器的指标
除了进程的系统指标(如之前所示),还可以导出 Docker 容器的系统指标。这可以使用 cAdvisor 来完成。
cAdvisor 的 Web UI 可通过 http://localhost:8080/。所有正在运行的 Docker 容器都显示在 http://localhost:8080/docker/:
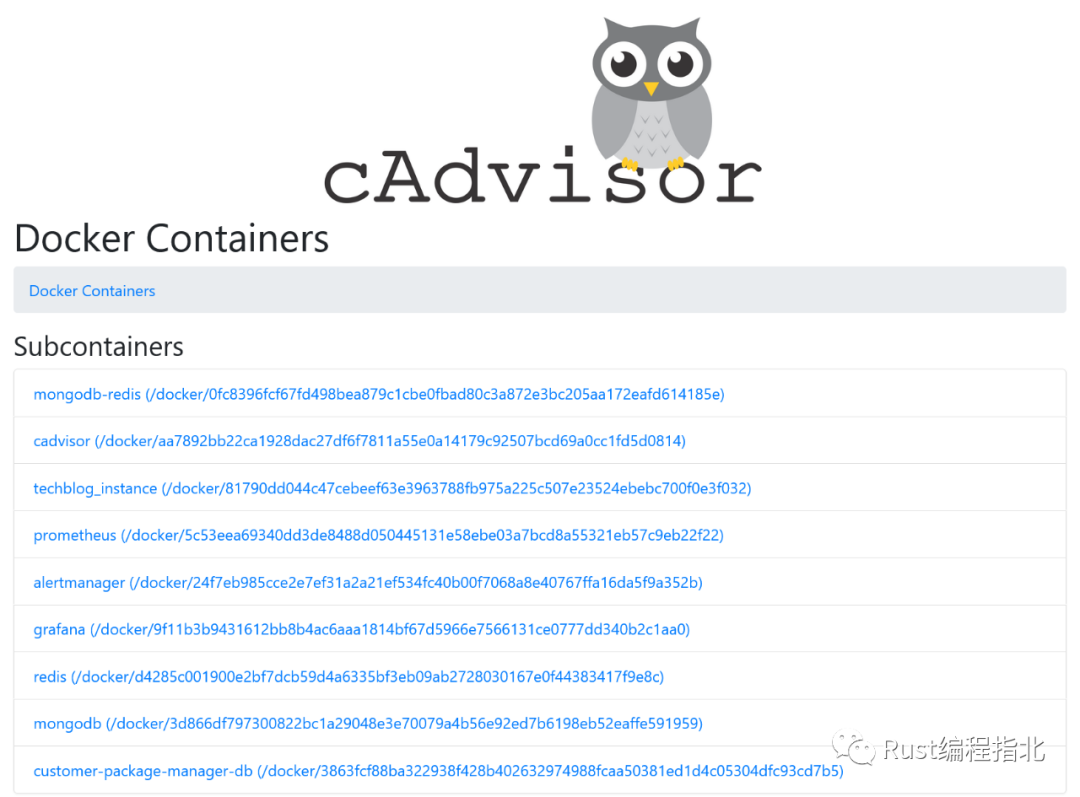
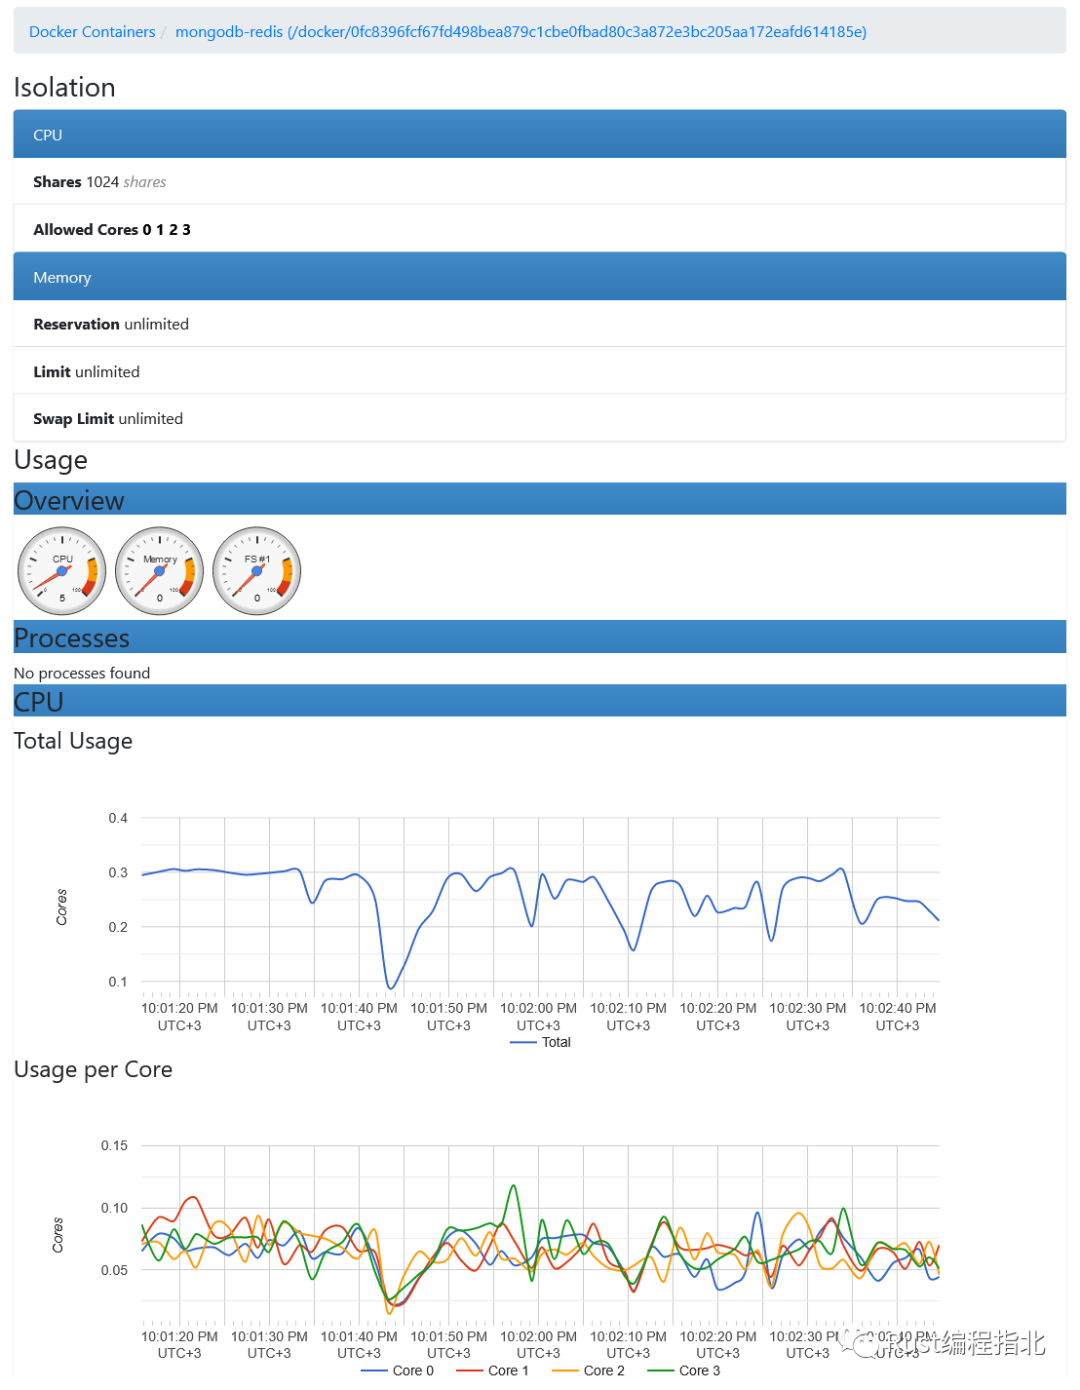
你可以获取有关任何容器的资源使用情况的信息:
Prometheus 服务器从http://localhost:8080/metrics 收集指标。
此处[37]列出了 cAdvisor 导出的指标。
机器的系统指标可以使用 Node exporter[38] 或 Windows exporter[39] 导出。
06 使用规则和 AlertManager 设置警报通知
在这个项目中,Prometheus 配置的以下部分负责警报:
清单 15.用于警报的 Prometheus 配置[40]
rule_files:
  - 'rules.yml'

alerting:
  alertmanagers:
    - static_configs:
        - targets: ['alertmanager:9093']
该alerting部分定义了 Prometheus 服务器与之通信的 AlertManager 实例。
警报规则[41]允许你根据 PromQL 表达式定义一些条件:
清单 16. rules.yml 中的警报规则示例[42]
groups:
- name: default
rules:
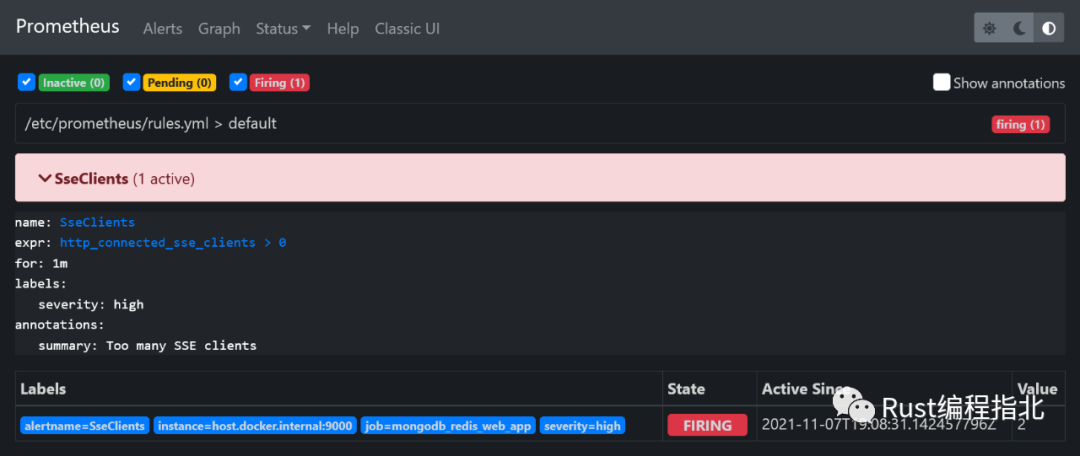
- alert: SseClients
expr: http_connected_sse_clients > 0
for: 1m
labels:
severity: high
annotations:
summary: Too many SSE clients
alert - 警报的名称 expr – Prometheus 表达式形式的实际规则定义 for – 在发出警报之前需要打破规则多长时间。在我们的例子中,如果 SSE 客户端的数量在 1 分钟内保持大于 0,则会发出警报 labels - 可以附加到警报的额外信息,例如严重性 annotations - 可以附加到警报的额外描述,例如摘要
SSE 客户端编号大于 0 的规则不是通常为应用程序设置的规则。它被用作示例,因为我们只要提出一个请求就很容易违反规则。
如果规则被破坏,Prometheus 服务器将向 AlertManager 实例发送警报。它提供了许多功能,例如警报重复数据删除、分组、静音和向最终用户发送通知。我们将只考虑路由能力:警报将发送到电子邮件。
AlertManager 配置如下:
清单 17. AlertManager 配置[43]
route:
  receiver: gmail

receivers:
- name: gmail
  email_configs:
  - to: recipient@gmail.com
    from: email_id@gmail.com
    smarthost: smtp.gmail.com:587
    auth_username: email_id@gmail.com
    auth_identity: email_id@gmail.com
    auth_password: password
在这个项目中,AlertManager 配置了一个 Gmail 帐户。要生成应用密码,你可以使用本指南[44]。
要触发SseClients警报规则,你只需http://localhost:9000。这会将http_connected_sse_clients指标增加 1。你可以在http://localhost:9090/alerts 上跟踪SseClients警报的状态。触发后,警报将转到Pending状态。在rules.yml中定义的for间隔过后(在本例中为1分钟),警报将进入Firing状态。
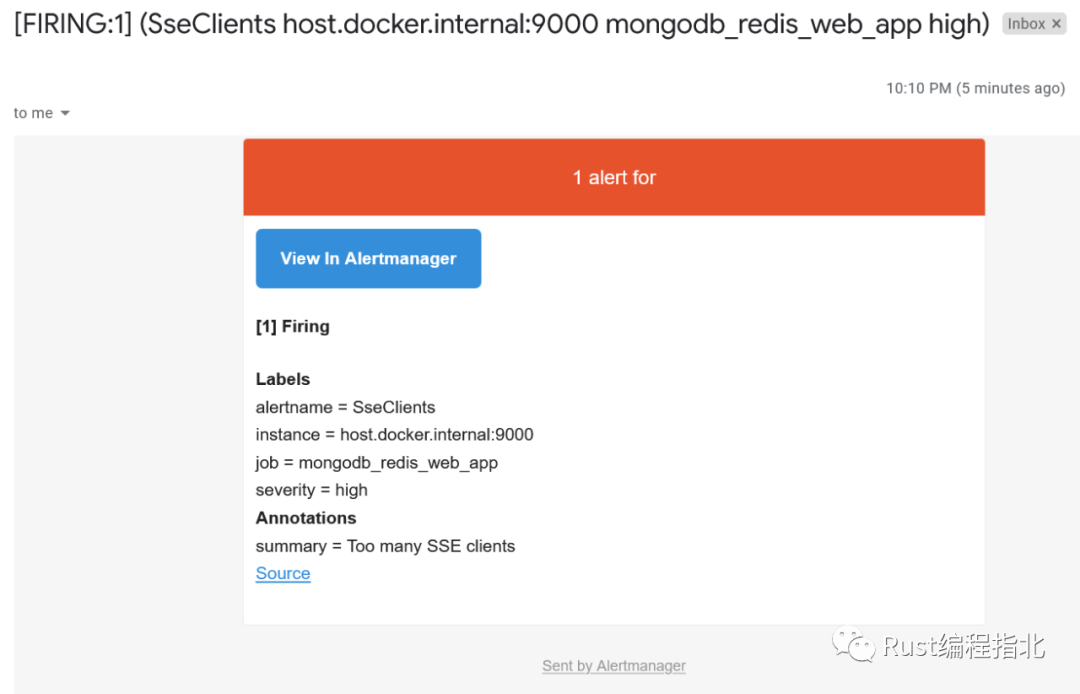
这将导致 Prometheus 服务器向 AlertManager 发送警报。它将决定如何处理警报,在我们的例子中发送电子邮件:
07 使用 Prometheus 导出器监控第三方系统
对于 MongoDB、Redis 等第三方工具,可以使用 Prometheus 导出器[45]设置监控 。
08 启动
docker compose up --build
09 结论
在本文中,我展示了如何在 Rust Web 应用程序中设置指标展示、使用 Prometheus 收集它们以及使用 Grafana 进行数据可视化。此外,还展示了如何开始使用 cAdvisor 收集容器的指标以及使用 AlertManager 发出警报。
原文链接:https://romankudryashov.com/blog/2021/11/monitoring-rust-web-application/
参考资料
mongodb-redis demo: https://github.com/rkudryashov/exploring-rust-ecosystem/tree/master/mongodb-redis
[2]这里: https://romankudryashov.com/blog/2021/06/mongodb-redis-rust/
[3]Prometheus: https://prometheus.io/
[4]Grafana: https://grafana.com/
[5]AlertManager: https://prometheus.io/docs/alerting/latest/alertmanager/
[6]cAdvisor: https://github.com/google/cadvisor
[7]Docker Compose 文件: https://github.com/rkudryashov/exploring-rust-ecosystem/blob/master/mongodb-redis/docker-compose.override.yml
[8]crate: https://github.com/tikv/rust-prometheus
[9]四种核心类型: https://prometheus.io/docs/concepts/metric_types/
[10]不支持: https://github.com/tikv/rust-prometheus/issues/5
[11]指标创建和注册: https://github.com/rkudryashov/exploring-rust-ecosystem/blob/master/mongodb-redis/src/metrics.rs
[12]示例: https://github.com/tikv/rust-prometheus/blob/master/examples/example_custom_registry.rs
[13]IntCounter: https://docs.rs/prometheus/latest/prometheus/type.IntCounter.html
[14]IntCounterVec: https://docs.rs/prometheus/latest/prometheus/type.IntCounterVec.html
[15]使用: https://github.com/rkudryashov/exploring-rust-ecosystem/blob/master/mongodb-redis/src/main.rs
[16]使用: https://github.com/rkudryashov/exploring-rust-ecosystem/blob/master/mongodb-redis/src/broadcaster.rs
[17]实现: https://github.com/rkudryashov/exploring-rust-ecosystem/blob/master/mongodb-redis/src/broadcaster.rs
[18]function: https://github.com/rkudryashov/exploring-rust-ecosystem/blob/master/mongodb-redis/src/handlers.rs
[19]function 中: https://github.com/rkudryashov/exploring-rust-ecosystem/blob/master/mongodb-redis/src/broadcaster.rs
[20]连接: https://github.com/rkudryashov/exploring-rust-ecosystem/blob/master/mongodb-redis/src/redis.rs
[21]直方图: https://prometheus.io/docs/practices/histograms/
[22]响应时间观察: https://github.com/rkudryashov/exploring-rust-ecosystem/blob/master/mongodb-redis/src/main.rs
[23]响应时间段: https://github.com/rkudryashov/exploring-rust-ecosystem/blob/master/mongodb-redis/src/metrics.rs
[24]进程指标: https://prometheus.io/docs/instrumenting/writing_clientlibs/#process-metrics
[25]这样: https://github.com/rkudryashov/exploring-rust-ecosystem/blob/master/mongodb-redis/Dockerfile
[26]指标处理程序: https://github.com/rkudryashov/exploring-rust-ecosystem/blob/master/mongodb-redis/src/handlers.rs
[27]格式: https://github.com/prometheus/docs/blob/main/content/docs/instrumenting/exposition_formats.md
[28]配置: https://github.com/rkudryashov/exploring-rust-ecosystem/blob/master/mongodb-redis/monitoring/prometheus/prometheus.yml
[29]PromQL: https://prometheus.io/docs/prometheus/latest/querying/basics/
[30]在此处: https://prometheus.io/docs/prometheus/latest/querying/examples/
[31]数据源配置: https://github.com/rkudryashov/exploring-rust-ecosystem/blob/master/mongodb-redis/monitoring/grafana/provisioning/datasources/datasources.yml
[32]仪表板配置: https://github.com/rkudryashov/exploring-rust-ecosystem/blob/master/mongodb-redis/monitoring/grafana/provisioning/dashboards/providers.yml
[33]Docker Compose: https://github.com/rkudryashov/exploring-rust-ecosystem/blob/master/mongodb-redis/docker-compose.override.yml
[34]限制: https://github.com/rkudryashov/exploring-rust-ecosystem/blob/master/mongodb-redis/src/services.rs
[35]仪表板: https://github.com/rkudryashov/exploring-rust-ecosystem/blob/master/mongodb-redis/monitoring/grafana/provisioning/dashboards/webapp_metrics.json
[36]热图: https://grafana.com/docs/grafana/latest/basics/intro-histograms/
[37]此处: https://github.com/google/cadvisor/blob/master/docs/storage/prometheus.md
[38]Node exporter: https://github.com/prometheus/node_exporter
[39]Windows exporter: https://github.com/prometheus-community/windows_exporter
[40]配置: https://github.com/rkudryashov/exploring-rust-ecosystem/blob/master/mongodb-redis/monitoring/prometheus/prometheus.yml
[41]警报规则: https://prometheus.io/docs/prometheus/latest/configuration/alerting_rules/
[42]示例: https://github.com/rkudryashov/exploring-rust-ecosystem/blob/master/mongodb-redis/monitoring/prometheus/rules.yml
[43]AlertManager 配置: https://github.com/rkudryashov/exploring-rust-ecosystem/blob/master/mongodb-redis/monitoring/alertmanager/alertmanager.yml
[44]本指南: https://support.google.com/accounts/answer/185833?hl=en
[45]导出器: https://prometheus.io/docs/instrumenting/exporters/
推荐阅读
我是 polarisxu,北大硕士毕业,曾在 360 等知名互联网公司工作,10多年技术研发与架构经验!2012 年接触 Go 语言并创建了 Go 语言中文网!著有《Go语言编程之旅》、开源图书《Go语言标准库》等。
坚持输出技术(包括 Go、Rust 等技术)、职场心得和创业感悟!欢迎关注「polarisxu」一起成长!也欢迎加我微信好友交流:gopherstudio