
6 种在 Python 中创建相关系数矩阵的方法

         来源:数据STUDIO


        本文约1000字,建议阅读6分钟


        本文为你总结相关系数矩阵的多种Python计算方法。
相关系数矩阵(Correlation matrix)是数据分析的基本工具。它们让我们了解不同的变量是如何相互关联的。在Python中,有很多个方法可以计算相关系数矩阵,今天我们来对这些方法进行一个总结。
Pandas
Pandas的DataFrame对象可以使用corr方法直接创建相关矩阵。由于数据科学领域的大多数人都在使用Pandas来获取数据,因此这通常是检查数据相关性的最快、最简单的方法之一。
import pandas as pdimport seaborn as snsdata = sns.load_dataset('mpg')correlation_matrix = data.corr(numeric_only=True)correlation_matrix

如果你是统计和分析相关工作的,你可能会问" p值在哪里?",在最后我们会有介绍。
Numpy
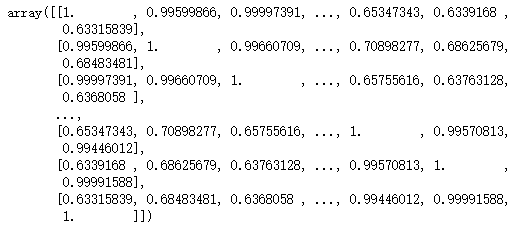
Numpy也包含了相关系数矩阵的计算函数,我们可以直接调用,但是因为返回的是ndarray,所以看起来没有pandas那么清晰。
import numpy as npfrom sklearn.datasets import load_irisiris = load_iris()np.corrcoef(iris["data"])
为了更好的可视化,我们可以直接将其传递给sns.heatmap()函数。
import seaborn as snsdata = sns.load_dataset('mpg')correlation_matrix = data.corr()sns.heatmap(data.corr(),annot=True,cmap='coolwarm')
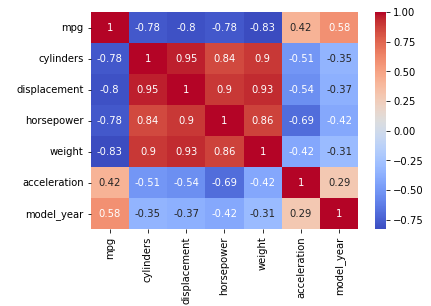
annot=True这个参数可以输出一些额外的有用信息。一个常见hack是使用sns.set_context('talk')来获得额外的可读输出。
这个设置是为了生成幻灯片演示的图像,它能帮助我们更好地阅读(更大的字体)。
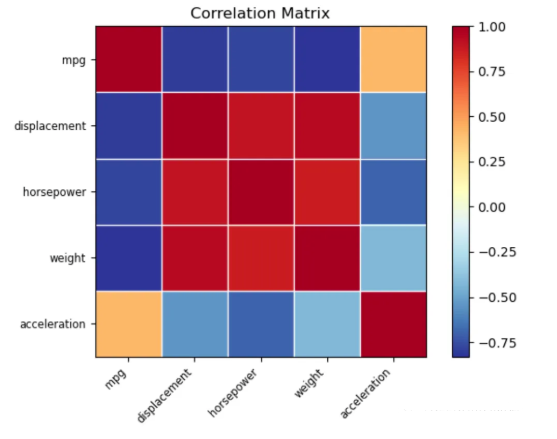
Statsmodels
Statsmodels这个统计分析库也是肯定可以的:
import statsmodels.api as smcorrelation_matrix = sm.graphics.plot_corr(data.corr(),xnames=data.columns.tolist())
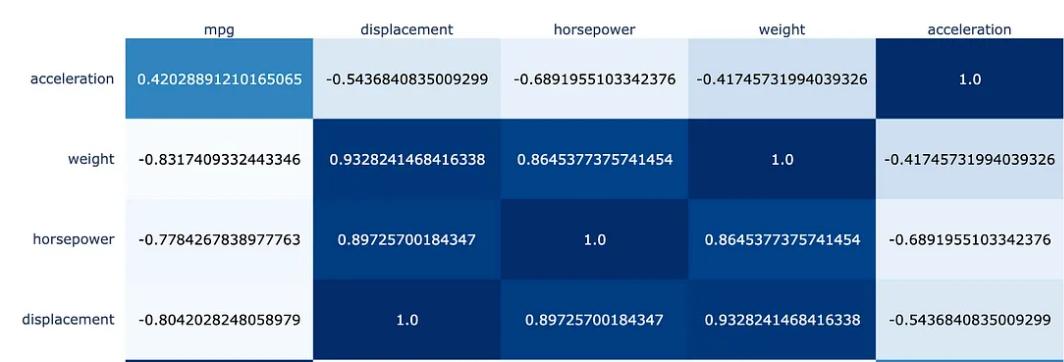
plotly
默认情况下plotly这个结果是如何从左下到右上运行对角线1.0的。这种行为与大多数其他工具相反,所以如果你使用plotly需要特别注意。
import plotly.offline as pyopyo.init_notebook_mode(connected=True)import plotly.figure_factory as ffcorrelation_matrix = data.corr()fig = ff.create_annotated_heatmap(z=correlation_matrix.values,x=list(correlation_matrix.columns),y=list(correlation_matrix.index),colorscale='Blues')fig.show()
Pandas + Matplotlib更好的可视化
这个结果也可以直接使用用sns.pairplot(data),两种方法产生的图差不多,但是seaborn只需要一句话:
sns.pairplot(df[['mpg','weight','horsepower','acceleration']])
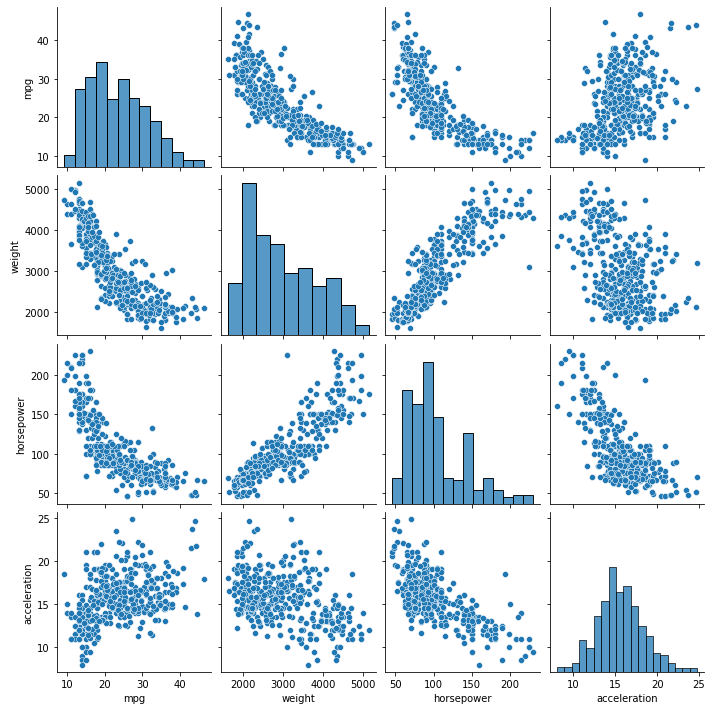
所以我们这里介绍如何使用Matplotlib来实现:
import matplotlib.pyplot as pltpd.plotting.scatter_matrix(data, alpha=0.2,figsize=(6, 6),diagonal='hist')plt.show()

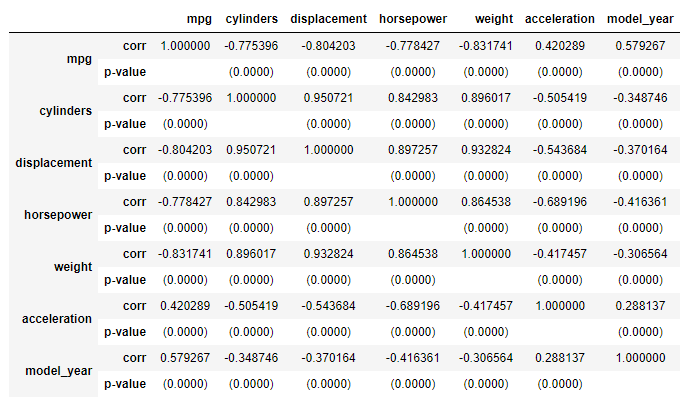
相关性的p值
如果你正在寻找一个简单的矩阵(带有p值),这是许多其他工具(SPSS, Stata, R, SAS等)默认做的,那如何在Python中获得呢?
这里就要借助科学计算的scipy库了,以下是实现的函数:
from scipy.stats import pearsonrimport pandas as pdimport seaborn as snsdef corr_full(df, numeric_only=True, rows=['corr', 'p-value', 'obs']):"""Generates a correlation matrix with correlation coefficients,p-values, and observation count.Args:- df: Input dataframe- numeric_only (bool): Whether to consider only numeric columns forcorrelation. Default is True.- rows: Determines the information to show.Default is ['corr', 'p-value', 'obs'].Returns:- formatted_table: The correlation matrix with the specified rows."""# Calculate Pearson correlation coefficientscorr_matrix = df.corr(numeric_only=numeric_only)# Calculate the p-values using scipy's pearsonrpvalue_matrix = df.corr(numeric_only=numeric_only,method=lambda x, y: pearsonr(x, y)[1])# Calculate the non-null observation count for each columnobs_count = df.apply(lambda x: x.notnull().sum())# Calculate observation count for each pair of columnsobs_matrix = pd.DataFrame(index=corr_matrix.columns, columns=corr_matrix.columns)for col1 in obs_count.index:for col2 in obs_count.index:obs_matrix.loc[col1, col2] = min(obs_count[col1], obs_count[col2])# Create a multi-index dataframe to store the formatted correlationsformatted_table = pd.DataFrame(index=pd.MultiIndex.from_product([corr_matrix.columns, rows]),columns=corr_matrix.columns)# Assign values to the appropriate cells in the formatted tablefor col1 in corr_matrix.columns:for col2 in corr_matrix.columns:if 'corr' in rows:formatted_table.loc[(col1, 'corr'), col2] = corr_matrix.loc[col1, col2]if 'p-value' in rows:# Avoid p-values for diagonal they correlate perfectlyif col1 != col2:formatted_table.loc[(col1, 'p-value'), col2] = f"({pvalue_matrix.loc[col1, col2]:.4f})"if 'obs' in rows:formatted_table.loc[(col1, 'obs'), col2] = obs_matrix.loc[col1, col2]return(formatted_table.fillna('').style.set_properties(**{'text-align': 'center'}))
直接调用这个函数,我们返回的结果如下:
df = sns.load_dataset('mpg')result = corr_full(df, rows=['corr', 'p-value'])result
总结
我们介绍了Python创建相关系数矩阵的各种方法,这些方法可以随意选择(那个方便用哪个)。Python中大多数工具的标准默认输出将不包括p值或观察计数,所以如果你需要这方面的统计,可以使用我们子厚提供的函数,因为要进行全面和完整的相关性分析,有p值和观察计数作为参考是非常有帮助的。