太香了!推荐6个Python数据分析神器!!

出品:Python数据科学
用Python处理数据大家都不陌生了,属常规操作,但常规之下还是也有些暗藏技巧的,本篇东哥分享6个好玩高效的操作,帮助大家提高效率。
一、Pandas Profiling
Pandas Profiling提供数据的一个整体报告,是一个帮助我们理解数据的过程。它可以简单快速地对Pandas的数据框数据进行探索性数据分析。
其实,Pandas中df.describe()和df.info()函数也可以实现数据探索过程第一步。但它们只提供了对数据非常基本的概述。而Pandas中的Profiling功能简单通过一行代码就能显示大量信息,同时还能生成交互式HTML报告。
对于给定的数据集,Pandas中的profiling包计算了以下统计信息:
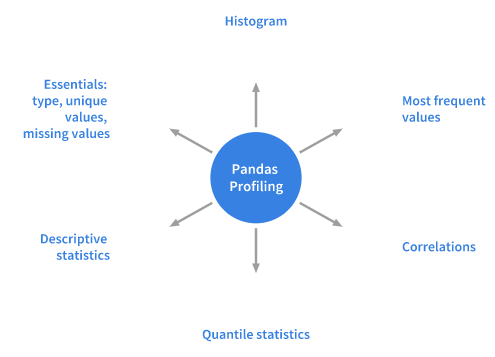
由Pandas Profiling包计算出的统计信息包括直方图、众数、相关系数、分位数、描述统计量、其他信息包括类型、单一变量值、缺失值等。
安装
用pip和conda即可,使用方法很简单,如下:
import pandas as pd
import pandas_profiling
df = pd.read_csv('titanic/train.csv')
pandas_profiling.ProfileReport(df)
用法
以titanic数据集来演示profiling的功能。
import pandas as pd
import pandas_profiling
df = pd.read_csv('titanic/train.csv')
pandas_profiling.ProfileReport(df)

除了导入库之外只需要一行代码,就能显示数据报告的详细信息,包括必要的图表。
还可以使用以下代码将报告导出到交互式HTML文件中。
profile = pandas_profiling.ProfileReport(df)
profile.to_file(outputfile="Titanic data profiling.html")

二、pretty print
pprint是Python中的内置模块。它能够以格式清晰,可读性强漂亮格式打印任意数据结构。一个例子对比下print和pprint。
# 定义个字典,测试用
my_dict = {'Student_ID': 34,'Student_name' : 'Tom', 'Student_class' : 5,
          'Student_marks' : {'maths' : 92,
                            'science' : 95,
                            'social_science' : 65,
                            'English' : 88}
          }
# 正常的print
print(my_dict)
# 输出结果如下:
{'Student_ID': 34, 'Student_name': 'Tom', 'Student_class': 5, 'Student_marks': {'maths': 92, 'science': 95, 'social_science': 65, 'English': 88}}
pprint
# 使用pprint输出
import pprint
pprint.pprint(my_dict)
# 输出结果如下:
{'Student_ID': 34,
 'Student_class': 5,
 'Student_marks': {'English': 88,
                   'maths': 92,
                   'science': 95,
                   'social_science': 65},
 'Student_name': 'Tom'}
可以清楚看到pprint的优势之处,数据结构一目了然啊。
三、Python Debugger
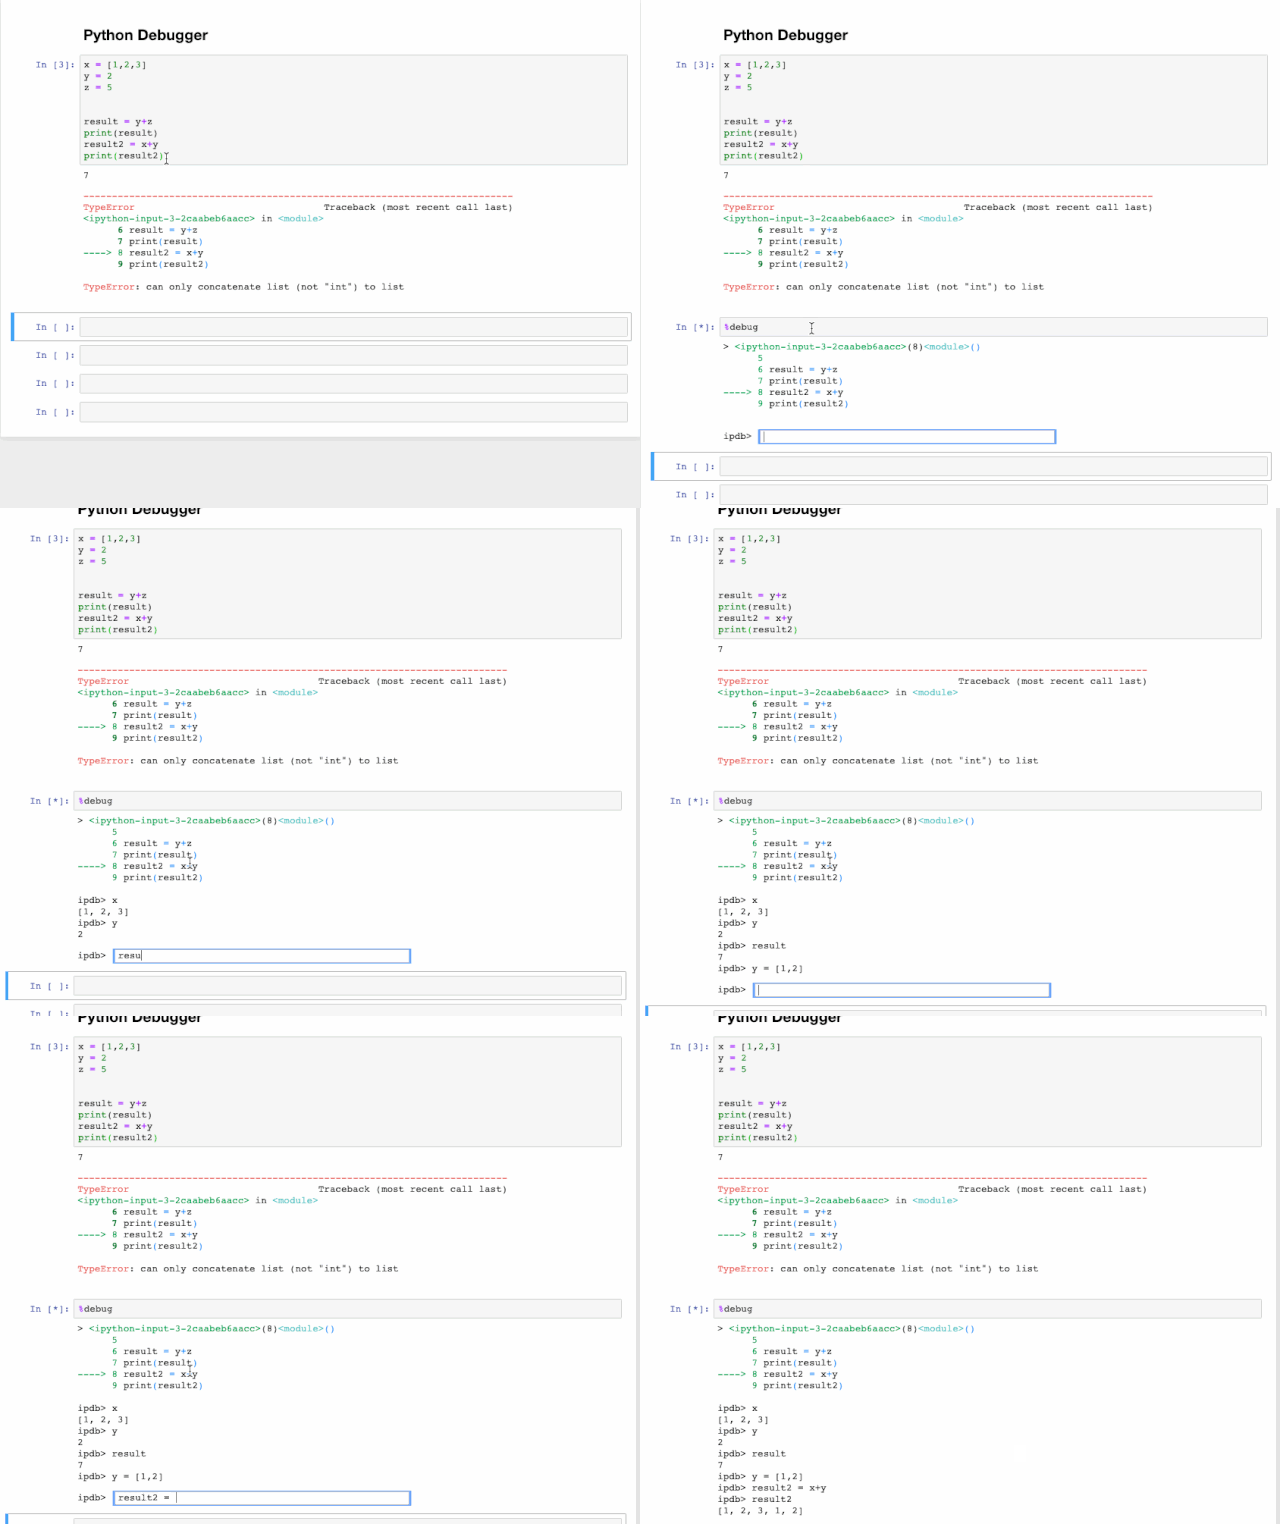
交互式调试器也是一个神奇的函数,如果在运行代码单元格时出现报错,可以在新行中键入%debug运行它。这将打开一个交互式调试环境,自动转到报错发生的位置,并且还可以检查程序中分配的变量值并执行操作。要退出调试器,按q。比如下面这个例子。
x = [1,2,3]
y = 2
z = 5

result = y+z
print(result)
result2 = x+y
print(result2)
大家应该能看出x+y肯定会报错,因为二者不是一个类型,无法进行运算操作。然后我们敲入%debug。
%debug
这时会出现对话框让我们互交式输入命令,比如我们可以像下面这样做。
四、Cufflinks
这个东哥在之前也介绍过,对于数据探索的可视化分析超级好用,低代码量便可生成漂亮的可视化图形。下面举一个例子,详细的可参见这篇Python一行代码搞定炫酷可视化,你需要了解一下Cufflinks。
cufflinks在plotly的基础上做了一进一步的包装,方法统一,参数配置简单。其次它还可以结合pandas的dataframe随意灵活地画图。可以把它形容为"pandas like visualization"。
比如下面的lins线图。
import pandas as pd
import cufflinks as cf
import numpy as np

cf.set_config_file(offline=True)
cf.datagen.lines(1,500).ta_plot(study='sma',periods=[13,21,55])

再比如box箱型图。
cf.datagen.box(20).iplot(kind='box',legend=False)
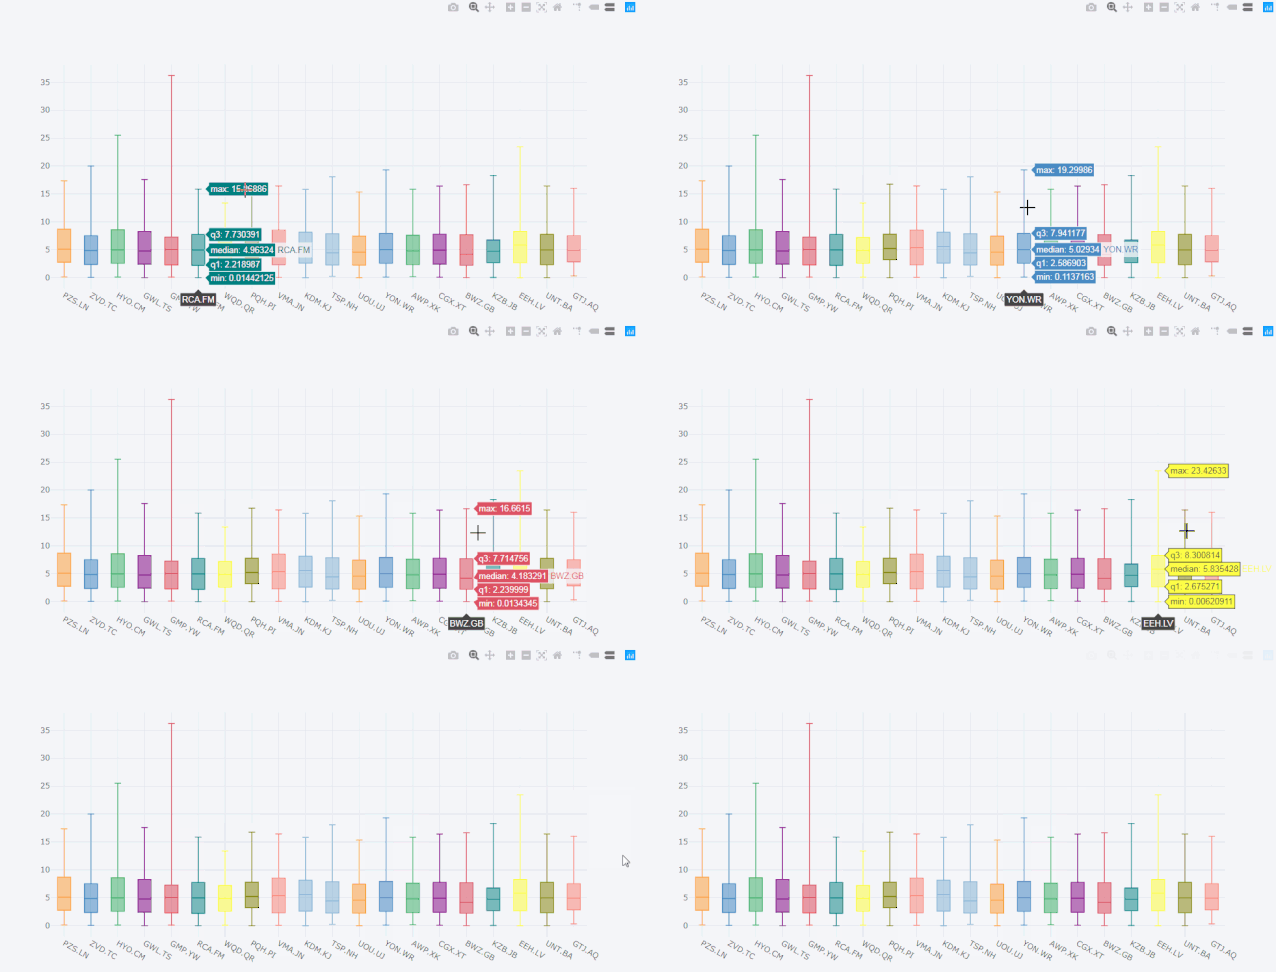
看着这动态图就爱不释手啊,有木有!
五、Pyforest
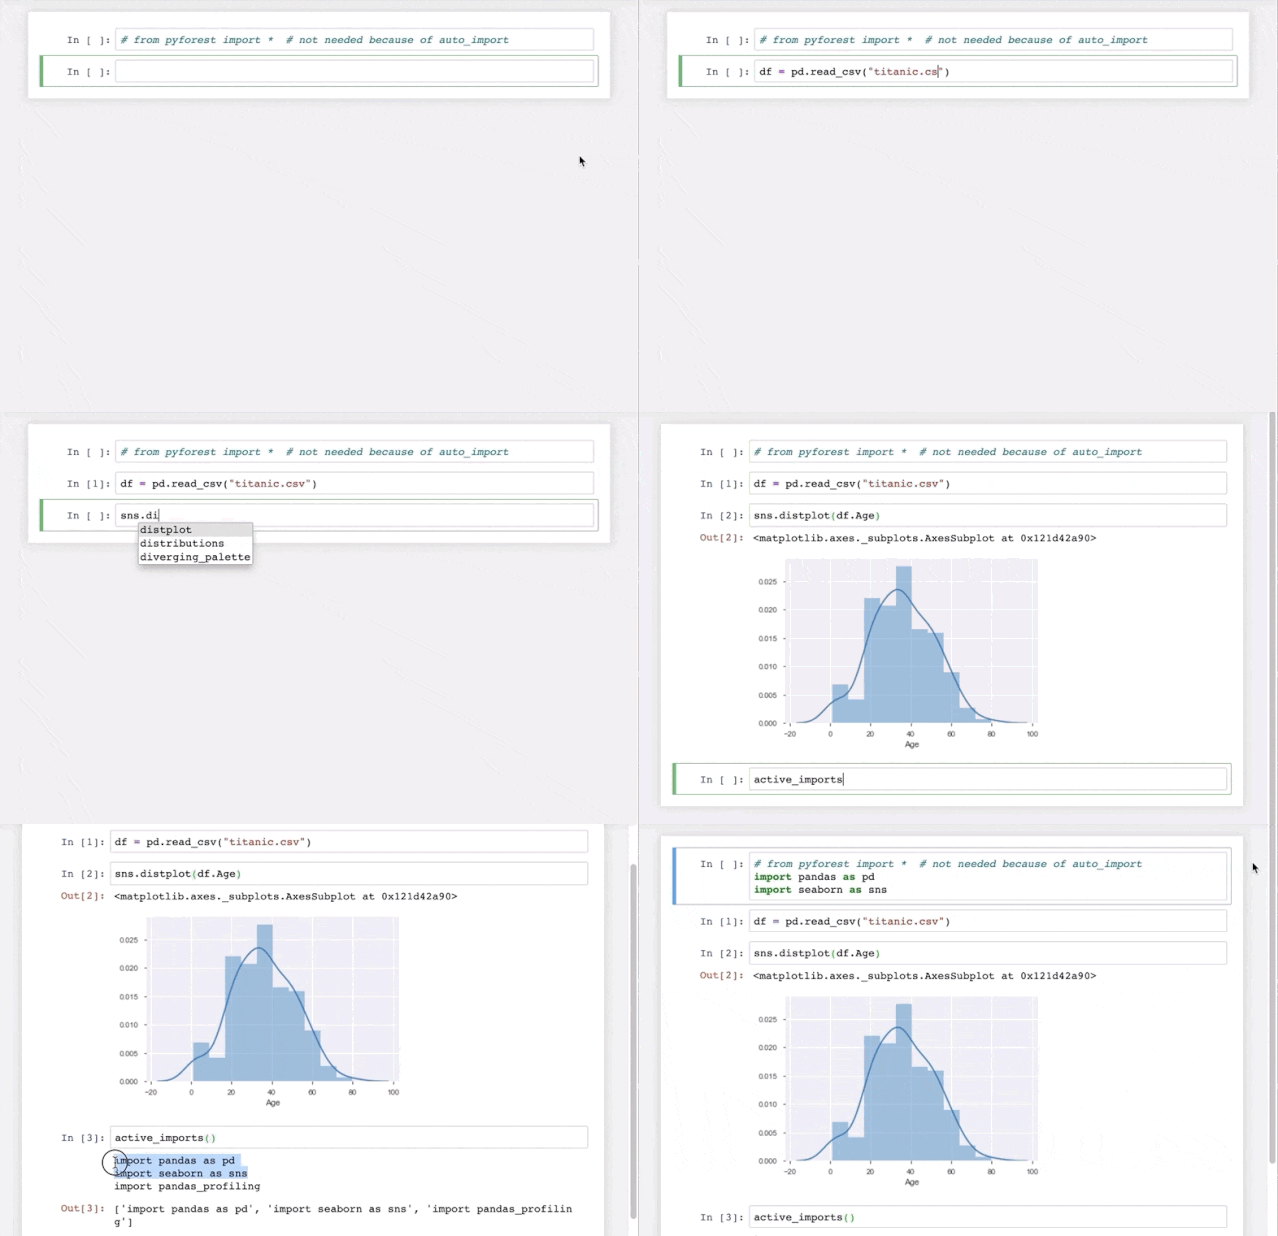
这是一个能让你偷懒的import神器,可以提前在配置文件里写好要导入的三方库,这样每次编辑脚本的时候就省去了开头的一大堆import 各种库,对于有常用和固定使用库的朋友来说无疑也是提高效率的工具之一。
pyforest支持大部分流行的数据科学库,比如pandas,numpy,matplotlib,seaborn,sklearn,tensorflow等等,以及常用的辅助库如os,sys,re,pickle等。
此用法对于自己频繁调试很方便,但对于那些频繁跨环境比如和其它人共享脚本调试的时候就不是很好用了,因为别人不一定使用它。
此库东哥在之前也详细介绍过 牛逼!这个Python库竟然可以偷懒,和import说再见!看下面这个操作就明白了。
六、Jupyter notebook的笔记高亮
此方法仅适用于Jupyter notebook中,当我们想高亮笔记,让笔记变得美观的时候,这个方法非常的香。
笔记的高亮的颜色根据不同情况分为几种,前端的同学一看就明白,区别就是每种颜色代码的class类型不一样,其它只要在div标签中写内容就好。下面看下用法。
蓝色代表info
<div class="alert alert-block alert-info">
<b>Tip:b> Use blue boxes (alert-info) for tips and notes.
If it’s a note, you don’t have to include the word “Note”.
div>

黄色代表warning
<div class="alert alert-block alert-warning">
<b>Example:b> Yellow Boxes are generally used to include additional examples or mathematical formulas.
div>

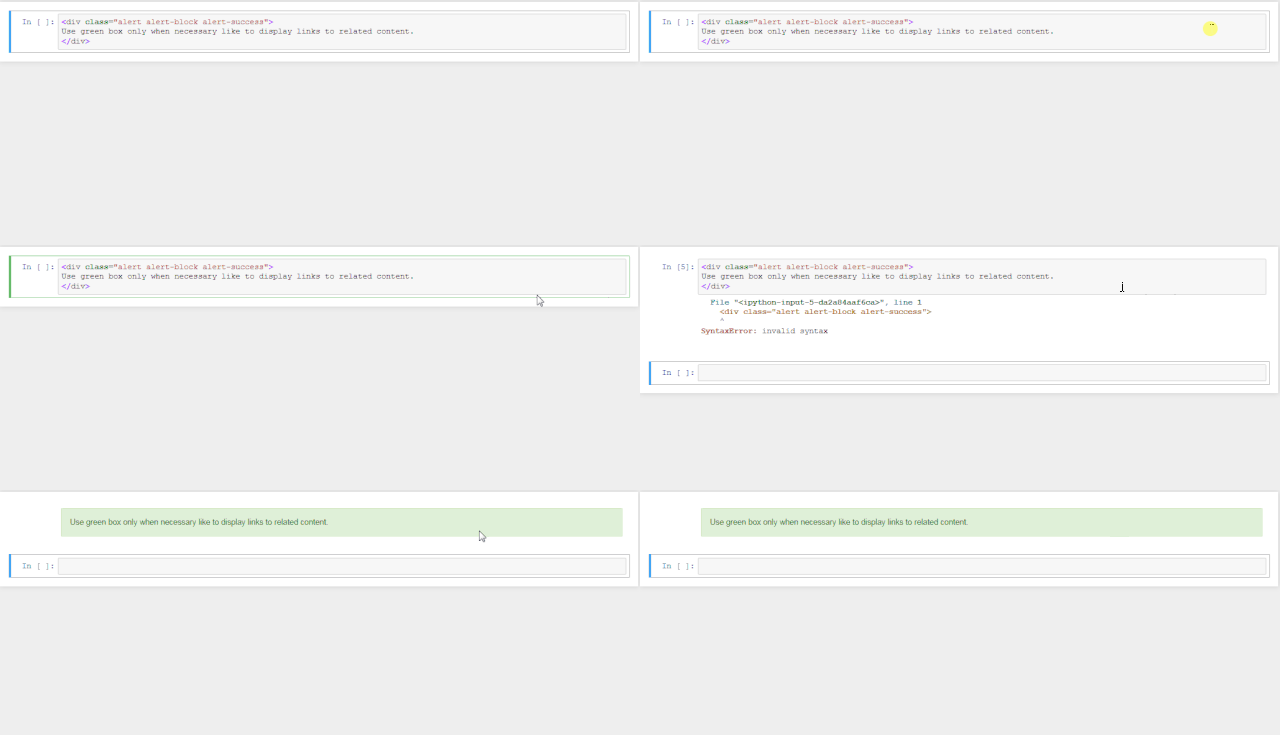
绿色代表success
<div class="alert alert-block alert-success">
Use green box only when necessary like to display links to related content.
div>

红色代表danger
<div class="alert alert-block alert-danger">
It is good to avoid red boxes but can be used to alert users to not delete some important part of code etc.
div>

这里有个小提示东哥提示下,如果你直接复制到jupyter notebook中可能会报错,因为默认是代码的格式,所以你需要选中单元格按Esc变成可切换模式,然后再按Y切换成文本模式。这时候再运行shift+ok就ok了。看下面这个例子。
欢迎老铁们多多分享和点个在看!
