
在 Kubernetes 上手动部署 Prometheus
 我们知道监控是保证系统运行必不可少的功能,特别是对于 Kubernetes 这种比较庞大的系统来说,监控报警更是不可或缺,我们需要时刻了解系统的各种运行指标,也需要时刻了解我们的 Pod 的各种指标,更需要在出现问题的时候有报警信息通知到我们。
在早期的版本中 Kubernetes 提供了 heapster、influxDB、grafana 的组合来监控系统,在现在的版本中已经移除掉了 heapster,现在更加流行的监控工具是 Prometheus,Prometheus 是 Google 内部监控报警系统的开源版本,是 Google SRE 思想在其内部不断完善的产物,它的存在是为了更快和高效的发现问题,快速的接入速度,简单灵活的配置都很好的解决了这一切,而且是已经毕业的 CNCF 项目。
简介
Prometheus 最初是 SoundCloud 构建的开源系统监控和报警工具,是一个独立的开源项目,于2016年加入了 CNCF 基金会,作为继 Kubernetes 之后的第二个托管项目。Prometheus 相比于其他传统监控工具主要有以下几个特点:
具有由 metric 名称和键/值对标识的时间序列数据的多维数据模型 有一个灵活的查询语言 不依赖分布式存储,只和本地磁盘有关 通过 HTTP 的服务拉取时间序列数据 也支持推送的方式来添加时间序列数据 还支持通过服务发现或静态配置发现目标 多种图形和仪表板支持
Prometheus 由多个组件组成,但是其中有些组件是可选的:
Prometheus Server:用于抓取指标、存储时间序列数据exporter:暴露指标让任务来抓pushgateway:push 的方式将指标数据推送到该网关alertmanager:处理报警的报警组件adhoc:用于数据查询
大多数 Prometheus 组件都是用 Go 编写的,因此很容易构建和部署为静态的二进制文件。下图是 Prometheus 官方提供的架构及其一些相关的生态系统组件:
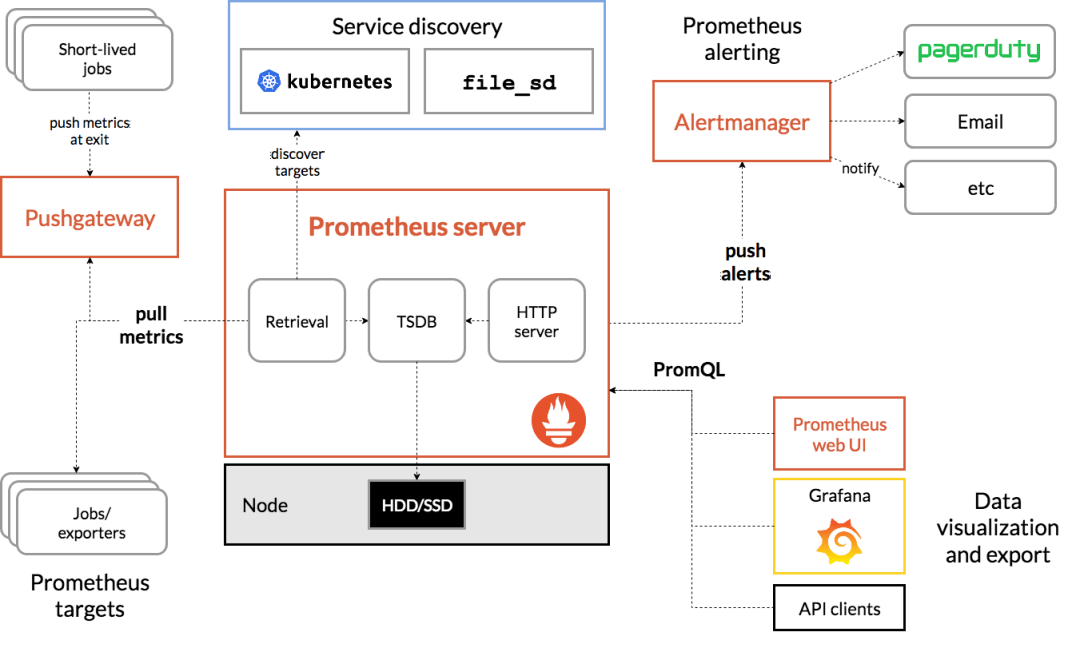
整体流程比较简单,Prometheus 直接接收或者通过中间的 Pushgateway 网关被动获取指标数据,在本地存储所有的获取的指标数据,并对这些数据进行一些规则整理,用来生成一些聚合数据或者报警信息,Grafana 或者其他工具用来可视化这些数据。
安装
由于 Prometheus 是 Golang 编写的程序,所以要安装的话也非常简单,只需要将二进制文件下载下来直接执行即可,前往地址:https://prometheus.io/download 下载最新版本即可。
Prometheus 是通过一个 YAML 配置文件来进行启动的,如果我们使用二进制的方式来启动的话,可以使用下面的命令:
$ ./prometheus --config.file=prometheus.yml
其中 prometheus.yml 文件的基本配置如下:
global:
  scrape_interval:     15s
  evaluation_interval: 15s

rule_files:
  # - "first.rules"
  # - "second.rules"

scrape_configs:
  - job_name: prometheus
    static_configs:
      - targets: ['localhost:9090']
上面这个配置文件中包含了3个模块:global、rule_files 和 scrape_configs。
global模块控制Prometheus Server的全局配置:scrape_interval:表示 prometheus 抓取指标数据的频率,默认是15s,我们可以覆盖这个值evaluation_interval:用来控制评估规则的频率,prometheus 使用规则产生新的时间序列数据或者产生警报rule_files:指定了报警规则所在的位置,prometheus 可以根据这个配置加载规则,用于生成新的时间序列数据或者报警信息,当前我们没有配置任何报警规则。scrape_configs用于控制 prometheus 监控哪些资源。
由于 prometheus 通过 HTTP 的方式来暴露的它本身的监控数据,prometheus 也能够监控本身的健康情况。在默认的配置里有一个单独的 job,叫做 prometheus,它采集 prometheus 服务本身的时间序列数据。这个 job 包含了一个单独的、静态配置的目标:监听 localhost 上的 9090 端口。prometheus 默认会通过目标的 /metrics 路径采集 metrics。所以,默认的 job 通过 URL:http://localhost:9090/metrics 采集 metrics。收集到的时间序列包含 prometheus 服务本身的状态和性能。如果我们还有其他的资源需要监控的话,直接配置在 scrape_configs 模块下面就可以了。
示例应用
比如我们在本地启动一些样例来让 Prometheus 采集。Go 客户端库包含一个示例,该示例为具有不同延迟分布的三个服务暴露 RPC 延迟。
首先确保已经安装了 Go 环境并启用 go modules,下载 Prometheus 的 Go 客户端库并运行这三个示例:
$ git clone https://github.com/prometheus/client_golang.git
$ cd client_golang/examples/random
$ export GO111MODULE=on
$ export GOPROXY=https://goproxy.cn
$ go build
然后在3个独立的终端里面运行3个服务:
$ ./random -listen-address=:8080
$ ./random -listen-address=:8081
$ ./random -listen-address=:8082
这个时候我们可以得到3个不同的监控接口:http://localhost:8080/metrics、http://localhost:8081/metrics 和 http://localhost:8082/metrics。
现在我们配置 Prometheus 来采集这些新的目标,让我们将这三个目标分组到一个名为 example-random 的任务。假设前两个端点(即:http://localhost:8080/metrics、http://localhost:8081/metrics)都是生产级目标应用,第三个端点(即:http://localhost:8082/metrics )为金丝雀实例。要在 Prometheus 中对此进行建模,我们可以将多组端点添加到单个任务中,为每组目标添加额外的标签。在此示例中,我们将 group =“production” 标签添加到第一组目标,同时将 group=“canary”添加到第二组。将以下配置添加到 prometheus.yml 中的 scrape_configs 部分,然后重新启动 Prometheus 实例:
scrape_configs:
  - job_name: 'example-random'
    # Override the global default and scrape targets from this job every 5 seconds.
    scrape_interval: 5s
    static_configs:
      - targets: ['localhost:8080', 'localhost:8081']
        labels:
          group: 'production'
      - targets: ['localhost:8082']
        labels:
          group: 'canary'
然后我们可以到浏览器中查看 Prometheus 的配置是否有新增的任务,这就是 Prometheus 添加监控配置最基本的配置方式了,非常简单,只需要提供一个符合 metrics 格式的可访问的接口配置给 Prometheus 就可以了。
但是由于我们这里是要运行在 Kubernetes 系统中,所以我们直接用 Docker 镜像的方式运行。
为了能够方便的管理配置文件,我们这里将 prometheus.yml 文件用 ConfigMap 的形式进行管理:
# prometheus-cm.yaml
apiVersion: v1
kind: ConfigMap
metadata:
  name: prometheus-config
  namespace: kube-mon
data:
  prometheus.yml: |
    global:
      scrape_interval: 15s
      scrape_timeout: 15s
    scrape_configs:
    - job_name: 'prometheus'
      static_configs:
      - targets: ['localhost:9090']
我们这里暂时只配置了对 prometheus 本身的监控,直接创建该资源对象:
$ kubectl apply -f prometheus-cm.yaml
configmap "prometheus-config" created
配置文件创建完成了,以后如果我们有新的资源需要被监控,我们只需要将上面的 ConfigMap 对象更新即可。现在我们来创建 prometheus 的 Pod 资源:
# prometheus-deploy.yaml
apiVersion: apps/v1
kind: Deployment
metadata:
  name: prometheus
  namespace: kube-mon
  labels:
    app: prometheus
spec:
  selector:
    matchLabels:
      app: prometheus
  template:
    metadata:
      labels:
        app: prometheus
    spec:
      serviceAccountName: prometheus
      containers:
      - image: prom/prometheus:v2.24.1
        name: prometheus
        args:
        - "--config.file=/etc/prometheus/prometheus.yml"
        - "--storage.tsdb.path=/prometheus"  # 指定tsdb数据路径
        - "--storage.tsdb.retention.time=24h"
        - "--web.enable-admin-api"  # 控制对admin HTTP API的访问,其中包括删除时间序列等功能
        - "--web.enable-lifecycle"  # 支持热更新,直接执行localhost:9090/-/reload立即生效
        ports:
        - containerPort: 9090
          name: http
        volumeMounts:
        - mountPath: "/etc/prometheus"
          name: config-volume
        - mountPath: "/prometheus"
          name: data
        resources:
          requests:
            cpu: 100m
            memory: 512Mi
          limits:
            cpu: 100m
            memory: 512Mi
      volumes:
      - name: data
        persistentVolumeClaim:
          claimName: prometheus-data
      - configMap:
          name: prometheus-config
        name: config-volume
另外为了 prometheus 的性能和数据持久化我们这里是直接将通过一个 LocalPV 来进行数据持久化的,通过 --storage.tsdb.path=/prometheus 指定数据目录,创建如下所示的一个 PVC 资源对象,注意是一个 LocalPV,和 node3 节点具有亲和性:
apiVersion: v1
kind: PersistentVolume
metadata:
  name: prometheus-local
  labels:
    app: prometheus
spec:
  accessModes:
  - ReadWriteOnce
  capacity:
    storage: 20Gi
  storageClassName: local-storage
  local:
    path: /data/k8s/prometheus
  nodeAffinity:
    required:
      nodeSelectorTerms:
      - matchExpressions:
        - key: kubernetes.io/hostname
          operator: In
          values:
          - node3
  persistentVolumeReclaimPolicy: Retain
---
apiVersion: v1
kind: PersistentVolumeClaim
metadata:
  name: prometheus-data
  namespace: kube-mon
spec:
  selector:
    matchLabels:
      app: prometheus
  accessModes:
  - ReadWriteOnce
  resources:
    requests:
      storage: 20Gi
  storageClassName: local-storage
由于 prometheus 可以访问 Kubernetes 的一些资源对象,所以需要配置 rbac 相关认证,这里我们使用了一个名为 prometheus 的 serviceAccount 对象:
# prometheus-rbac.yaml
apiVersion: v1
kind: ServiceAccount
metadata:
  name: prometheus
  namespace: kube-mon
---
apiVersion: rbac.authorization.k8s.io/v1
kind: ClusterRole
metadata:
  name: prometheus
rules:
- apiGroups:
  - ""
  resources:
  - nodes
  - services
  - endpoints
  - pods
  - nodes/proxy
  verbs:
  - get
  - list
  - watch
- apiGroups:
  - "extensions"
  resources:
    - ingresses
  verbs:
  - get
  - list
  - watch
- apiGroups:
  - ""
  resources:
  - configmaps
  - nodes/metrics
  verbs:
  - get
- nonResourceURLs:
  - /metrics
  verbs:
  - get
---
apiVersion: rbac.authorization.k8s.io/v1beta1
kind: ClusterRoleBinding
metadata:
  name: prometheus
roleRef:
  apiGroup: rbac.authorization.k8s.io
  kind: ClusterRole
  name: prometheus
subjects:
- kind: ServiceAccount
  name: prometheus
  namespace: kube-mon
由于我们要获取的资源信息,在每一个 namespace 下面都有可能存在,所以我们这里使用的是 ClusterRole 的资源对象,值得一提的是我们这里的权限规则声明中有一个 nonResourceURLs 的属性,是用来对非资源型 metrics 进行操作的权限声明,这个在以前我们很少遇到过,然后直接创建上面的资源对象即可:
$ kubectl apply -f prometheus-rbac.yaml
serviceaccount "prometheus" created
clusterrole.rbac.authorization.k8s.io "prometheus" created
clusterrolebinding.rbac.authorization.k8s.io "prometheus" created
现在我们就可以添加 promethues 的资源对象了:
$ kubectl apply -f prometheus-deploy.yaml
deployment.apps/prometheus created
$ kubectl get pods -n kube-mon
NAME                         READY   STATUS             RESTARTS   AGE
prometheus-df4f47d95-vksmc   0/1     CrashLoopBackOff   3          98s
$ kubectl logs -f prometheus-df4f47d95-vksmc -n kube-mon
level=info ts=2019-12-12T03:08:49.424Z caller=main.go:332 msg="Starting Prometheus" version="(version=2.14.0, branch=HEAD, revision=edeb7a44cbf745f1d8be4ea6f215e79e651bfe19)"
level=info ts=2019-12-12T03:08:49.424Z caller=main.go:333 build_context="(go=go1.13.4, user=root@df2327081015, date=20191111-14:27:12)"
level=info ts=2019-12-12T03:08:49.425Z caller=main.go:334 host_details="(Linux 3.10.0-1062.4.1.el7.x86_64 #1 SMP Fri Oct 18 17:15:30 UTC 2019 x86_64 prometheus-df4f47d95-vksmc (none))"
level=info ts=2019-12-12T03:08:49.425Z caller=main.go:335 fd_limits="(soft=1048576, hard=1048576)"
level=info ts=2019-12-12T03:08:49.425Z caller=main.go:336 vm_limits="(soft=unlimited, hard=unlimited)"
level=error ts=2019-12-12T03:08:49.425Z caller=query_logger.go:85 component=activeQueryTracker msg="Error opening query log file" file=/prometheus/queries.active err="open /prometheus/queries.active: permission denied"
panic: Unable to create mmap-ed active query log

goroutine 1 [running]:
github.com/prometheus/prometheus/promql.NewActiveQueryTracker(0x7ffd8cf6ec5d, 0xb, 0x14, 0x2b4f400, 0xc0006f33b0, 0x2b4f400)
        /app/promql/query_logger.go:115 +0x48c
main.main()
        /app/cmd/prometheus/main.go:364 +0x5229
创建 Pod 后,我们可以看到并没有成功运行,出现了 open /prometheus/queries.active: permission denied 这样的错误信息,这是因为我们的 prometheus 的镜像中是使用的 nobody 这个用户,然后现在我们通过 LocalPV 挂载到宿主机上面的目录的 ownership 却是 root:
$ ls -la /data/k8s
total 36
drwxr-xr-x   6 root root  4096 Dec 12 11:07 .
dr-xr-xr-x. 19 root root  4096 Nov  9 23:19 ..
drwxr-xr-x   2 root root  4096 Dec 12 11:07 prometheus
所以当然会出现操作权限问题了,这个时候我们就可以通过 securityContext 来为 Pod 设置下 volumes 的权限,通过设置 runAsUser=0 指定运行的用户为 root,也可以通过设置一个 initContainer 来修改数据目录权限:
......
initContainers:
- name: fix-permissions
  image: busybox
  command: [chown, -R, "nobody:nobody", /prometheus]
  volumeMounts:
  - name: data
    mountPath: /prometheus
这个时候我们重新更新下 prometheus:
$ kubectl apply -f prometheus-deploy.yaml
deployment.apps/prometheus configured
$ kubectl get pods -n kube-mon
NAME                          READY   STATUS    RESTARTS   AGE
prometheus-79b8774f68-7m8zr   1/1     Running   0          56s
$ kubectl logs -f prometheus-79b8774f68-7m8zr -n kube-mon
level=info ts=2019-12-12T03:17:44.228Z caller=main.go:332 msg="Starting Prometheus" version="(version=2.14.0, branch=HEAD, revision=edeb7a44cbf745f1d8be4ea6f215e79e651bfe19)"
......
level=info ts=2019-12-12T03:17:44.822Z caller=main.go:673 msg="TSDB started"
level=info ts=2019-12-12T03:17:44.822Z caller=main.go:743 msg="Loading configuration file" filename=/etc/prometheus/prometheus.yml
level=info ts=2019-12-12T03:17:44.827Z caller=main.go:771 msg="Completed loading of configuration file" filename=/etc/prometheus/prometheus.yml
level=info ts=2019-12-12T03:17:44.827Z caller=main.go:626 msg="Server is ready to receive web requests."
Pod 创建成功后,为了能够在外部访问到 prometheus 的 webui 服务,我们还需要创建一个 Service 对象:
# prometheus-svc.yaml
apiVersion: v1
kind: Service
metadata:
  name: prometheus
  namespace: kube-mon
  labels:
    app: prometheus
spec:
  selector:
    app: prometheus
  type: NodePort
  ports:
    - name: web
      port: 9090
      targetPort: http
为了方便测试,我们这里创建一个 NodePort 类型的服务,当然我们可以创建一个 Ingress对象,通过域名来进行访问:
$ kubectl apply -f prometheus-svc.yaml
service "prometheus" created
$ kubectl get svc -n kube-mon
NAME         TYPE       CLUSTER-IP     EXTERNAL-IP   PORT(S)          AGE
prometheus   NodePort   10.96.194.29           9090:30980/TCP   13h
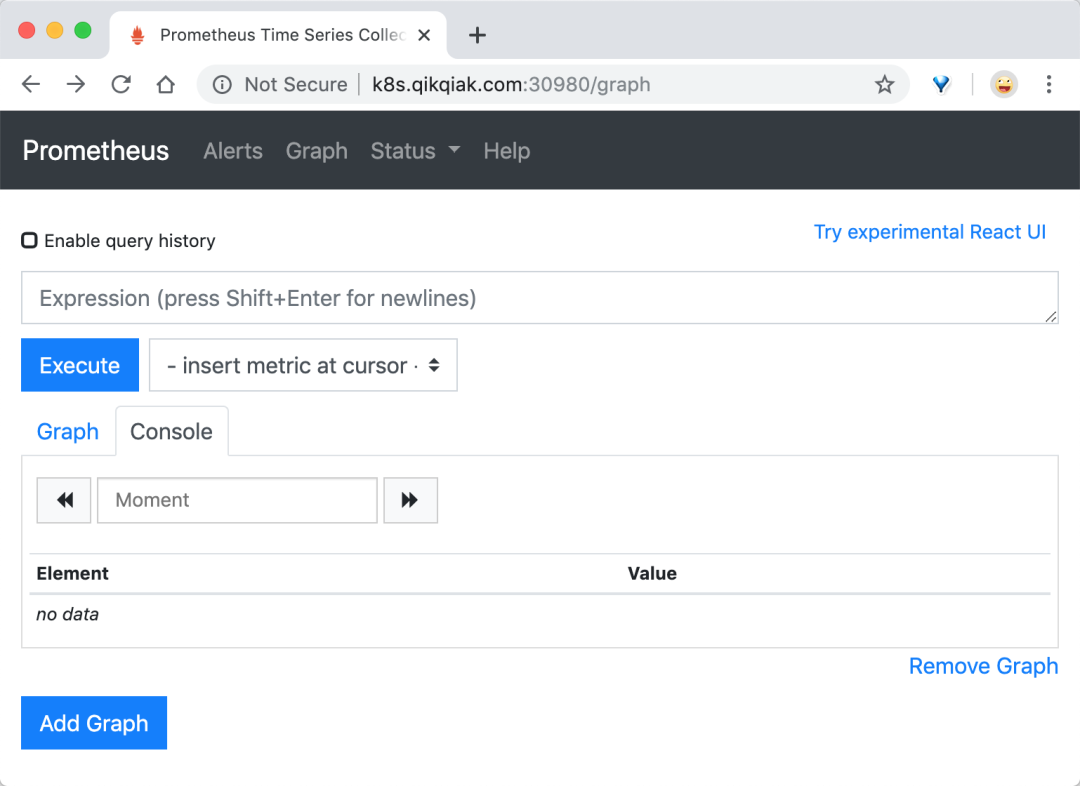
现在我们就可以通过 http://任意节点IP:30980 访问 prometheus 的 webui 服务了:
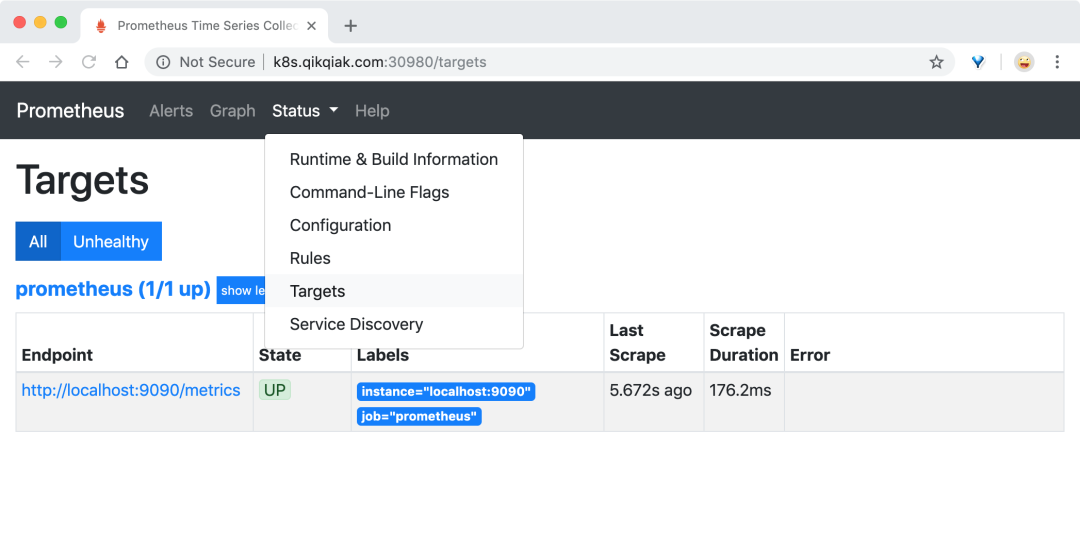
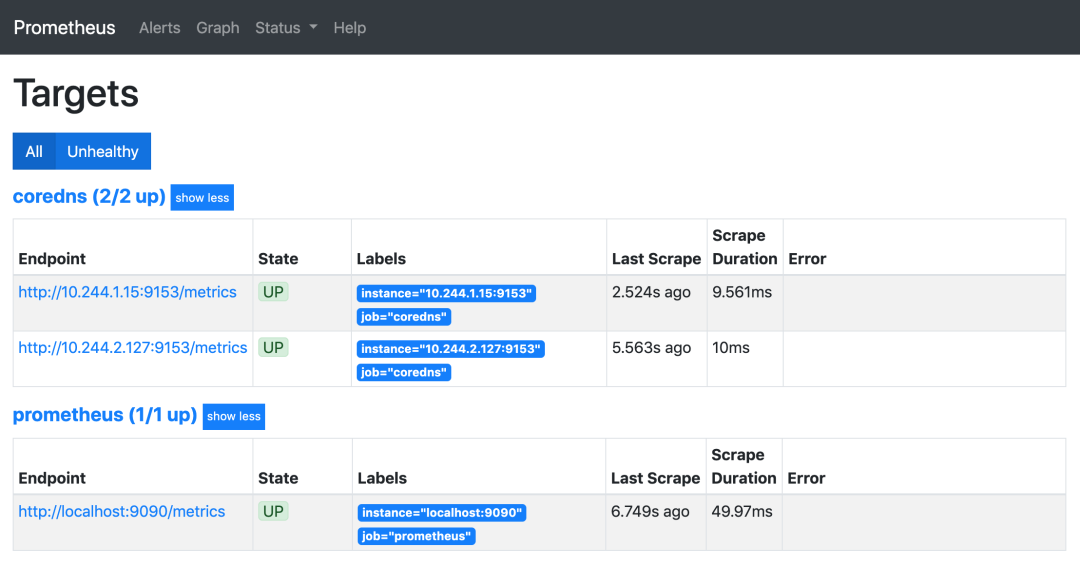
现在我们可以查看当前监控系统中的一些监控目标(Status -> Targets):
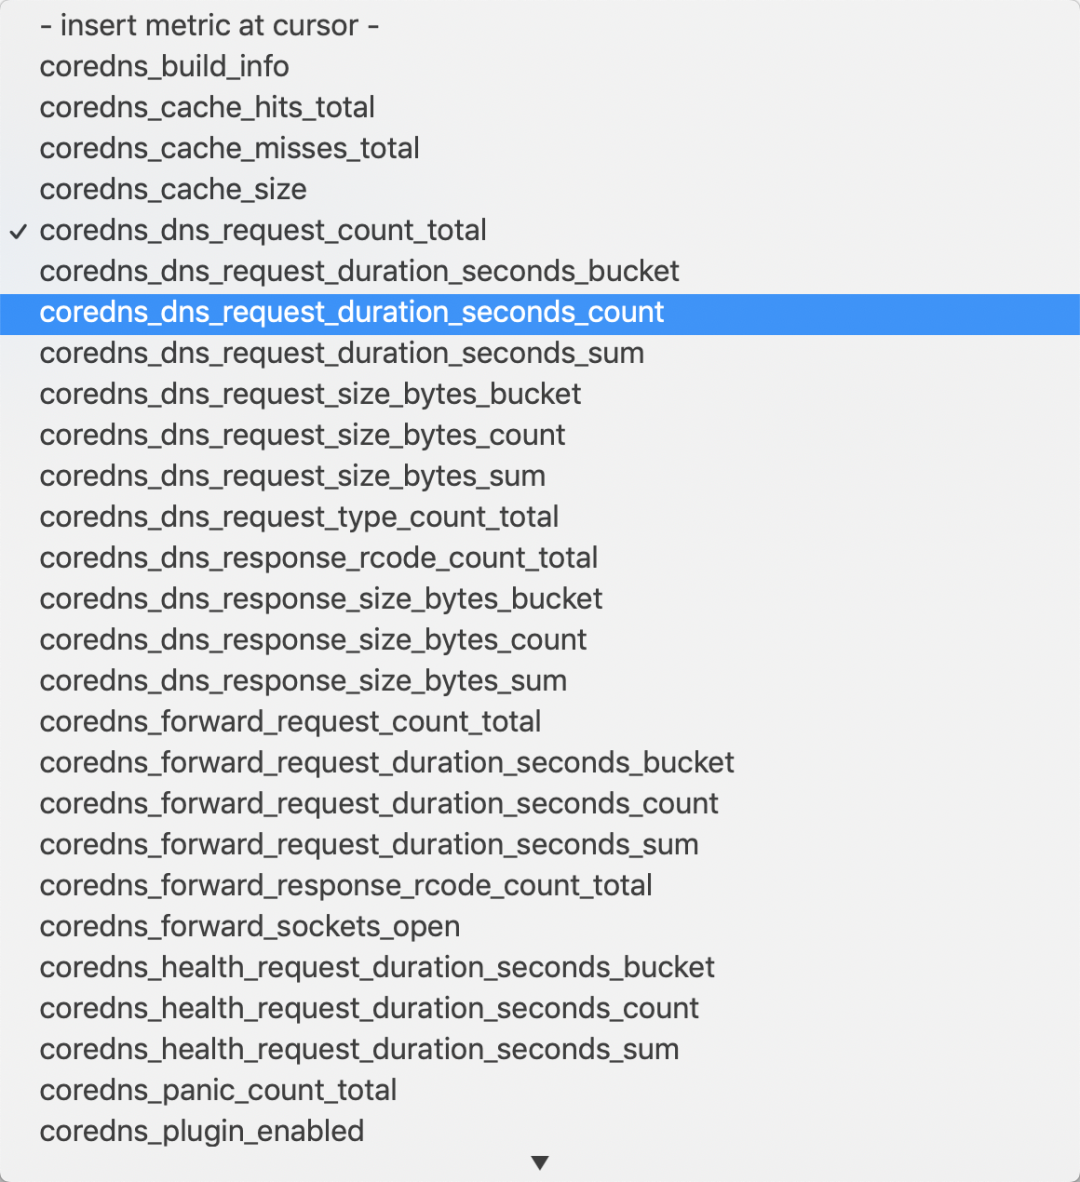
由于我们现在还没有配置任何的报警信息,所以 Alerts 菜单下面现在没有任何数据,隔一会儿,我们可以去 Graph 菜单下面查看我们抓取的 prometheus 本身的一些监控数据了,其中- insert metrics at cursor -下面就有我们搜集到的一些监控指标数据:
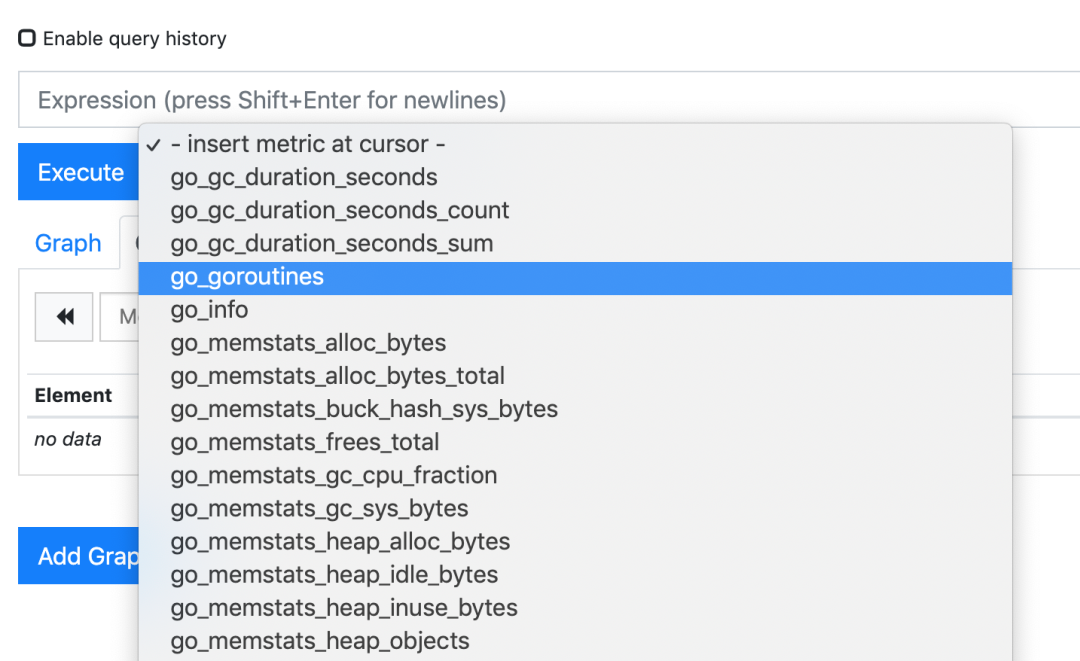
比如我们这里就选择 scrape_duration_seconds 这个指标,然后点击 Execute,就可以看到类似于下面的图表数据了:
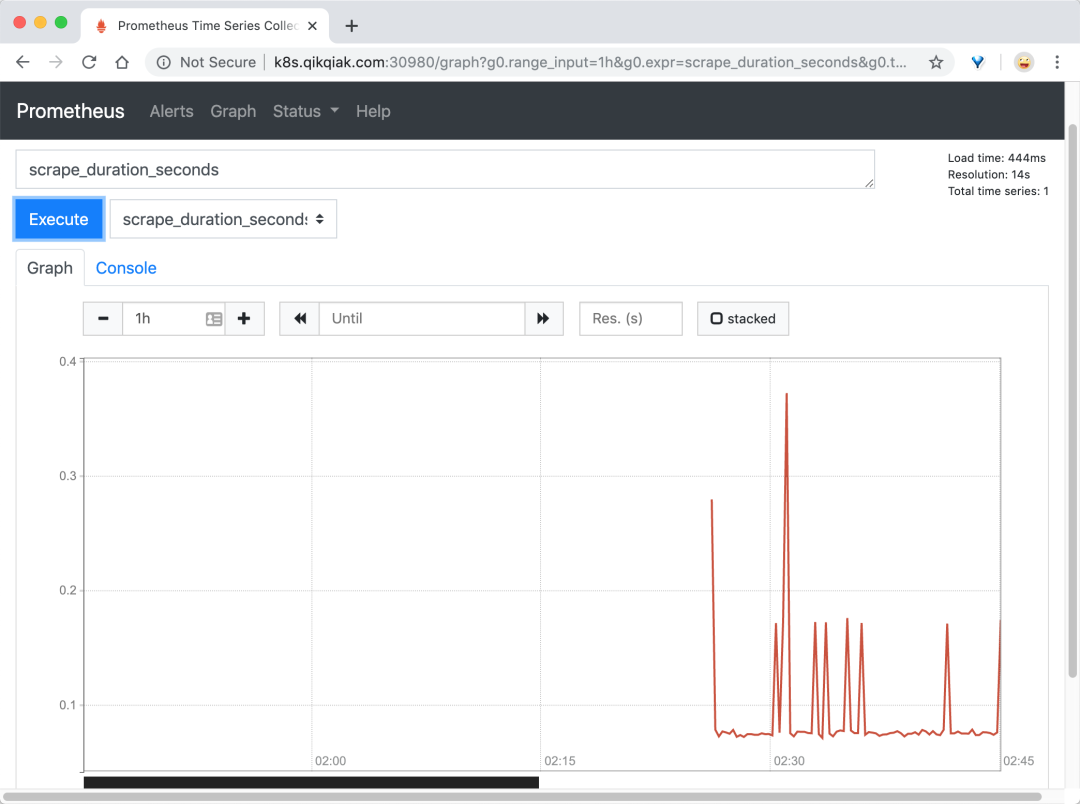
除了简单的直接使用采集到的一些监控指标数据之外,这个时候也可以使用强大的 PromQL 工具,PromQL 其实就是 prometheus 便于数据聚合展示开发的一套 ad hoc 查询语言的,你想要查什么找对应函数取你的数据好了。
应用监控
前面我们和大家介绍了 Prometheus 的数据指标是通过一个公开的 HTTP(S) 数据接口获取到的,我们不需要单独安装监控的 agent,只需要暴露一个 metrics 接口,Prometheus 就会定期去拉取数据;对于一些普通的 HTTP 服务,我们完全可以直接重用这个服务,添加一个 /metrics 接口暴露给 Prometheus;而且获取到的指标数据格式是非常易懂的,不需要太高的学习成本。
现在很多服务从一开始就内置了一个 /metrics 接口,比如 Kubernetes 的各个组件、istio 服务网格都直接提供了数据指标接口。有一些服务即使没有原生集成该接口,也完全可以使用一些 exporter 来获取到指标数据,比如 mysqld_exporter、node_exporter,这些 exporter 就有点类似于传统监控服务中的 agent,作为服务一直存在,用来收集目标服务的指标数据然后直接暴露给 Prometheus。
普通应用
对于普通应用只需要能够提供一个满足 prometheus 格式要求的 /metrics 接口就可以让 Prometheus 来接管监控,比如 Kubernetes 集群中非常重要的 CoreDNS 插件,一般默认情况下就开启了 /metrics 接口:
$ kubectl get cm coredns -n kube-system -o yaml
apiVersion: v1
data:
  Corefile: |
    .:53 {
        errors
        health
        ready
        kubernetes cluster.local in-addr.arpa ip6.arpa {
           pods insecure
           fallthrough in-addr.arpa ip6.arpa
           ttl 30
        }
        prometheus :9153
        forward . /etc/resolv.conf
        cache 30
        loop
        reload
        loadbalance
    }
kind: ConfigMap
metadata:
  creationTimestamp: "2019-11-08T11:59:49Z"
  name: coredns
  namespace: kube-system
  resourceVersion: "188"
  selfLink: /api/v1/namespaces/kube-system/configmaps/coredns
  uid: 21966186-c2d9-467a-b87f-d061c5c9e4d7
上面 ConfigMap 中 prometheus :9153 就是开启 prometheus 的插件:
$ kubectl get pods -n kube-system -l k8s-app=kube-dns -o wide
NAME                       READY   STATUS    RESTARTS   AGE     IP            NODE         NOMINATED NODE   READINESS GATES
coredns-667f964f9b-sthqq   1/1     Running   0          4d20h   10.244.1.15   ydzs-node1
coredns-667f964f9b-zj4r4   1/1     Running   0          4d20h   10.244.2.127   ydzs-node3
我们可以先尝试手动访问下 /metrics 接口,如果能够手动访问到那证明接口是没有任何问题的:
$ curl http://10.244.1.15:9153/metrics
# HELP coredns_build_info A metric with a constant '1' value labeled by version, revision, and goversion from which CoreDNS was built.
# TYPE coredns_build_info gauge
coredns_build_info{goversion="go1.12.8",revision="795a3eb",version="1.6.2"} 1
# HELP coredns_cache_hits_total The count of cache hits.
# TYPE coredns_cache_hits_total counter
coredns_cache_hits_total{server="dns://:53",type="success"} 4
# HELP coredns_cache_misses_total The count of cache misses.
# TYPE coredns_cache_misses_total counter
coredns_cache_misses_total{server="dns://:53"} 15
# HELP coredns_cache_size The number of elements in the cache.
# TYPE coredns_cache_size gauge
coredns_cache_size{server="dns://:53",type="denial"} 5
coredns_cache_size{server="dns://:53",type="success"} 4
......
我们可以看到可以正常访问到,从这里可以看到 CoreDNS 的监控数据接口是正常的了,然后我们就可以将这个 /metrics 接口配置到 prometheus.yml 中去了,直接加到默认的 prometheus 这个 job 下面:(prome-cm.yaml)
apiVersion: v1
kind: ConfigMap
metadata:
  name: prometheus-config
  namespace: kube-mon
data:
  prometheus.yml: |
    global:
      scrape_interval: 15s
      scrape_timeout: 15s

    scrape_configs:
    - job_name: 'prometheus'
      static_configs:
        - targets: ['localhost:9090']

    - job_name: 'coredns'
      static_configs:
        - targets: ['10.244.1.15:9153', '10.244.2.127:9153']
当然,我们这里只是一个很简单的配置,scrape_configs 下面可以支持很多参数,例如:
basic_auth和bearer_token:比如我们提供的/metrics接口需要 basic 认证的时候,通过传统的用户名/密码或者在请求的 header 中添加对应的 token 都可以支持kubernetes_sd_configs或consul_sd_configs:可以用来自动发现一些应用的监控数据
现在我们重新更新这个 ConfigMap 资源对象:
$ kubectl apply -f prometheus-cm.yaml
configmap/prometheus-config configured
现在 Prometheus 的配置文件内容已经更改了,隔一会儿被挂载到 Pod 中的 prometheus.yml 文件也会更新,由于我们之前的 Prometheus 启动参数中添加了 --web.enable-lifecycle 参数,所以现在我们只需要执行一个 reload 命令即可让配置生效:
$ kubectl get pods -n kube-mon -o wide
NAME                          READY   STATUS    RESTARTS   AGE   IP             NODE         NOMINATED NODE   READINESS GATES
prometheus-79b8774f68-7m8zr   1/1     Running   0          28m   10.244.3.174   ydzs-node3
$ curl -X POST "http://10.244.3.174:9090/-/reload"
“由于 ConfigMap 通过 Volume 的形式挂载到 Pod 中去的热更新需要一定的间隔时间才会生效,所以需要稍微等一小会儿。
”
这个时候我们再去看 Prometheus 的 Dashboard 中查看采集的目标数据:
可以看到我们刚刚添加的 coredns 这个任务已经出现了,然后同样的我们可以切换到 Graph 下面去,我们可以找到一些 CoreDNS 的指标数据,至于这些指标数据代表什么意义,一般情况下,我们可以去查看对应的 /metrics 接口,里面一般情况下都会有对应的注释。
到这里我们就在 Prometheus 上配置了第一个 Kubernetes 应用。
使用 exporter 监控
上面我们也说过有一些应用可能没有自带 /metrics 接口供 Prometheus 使用,在这种情况下,我们就需要利用 exporter 服务来为 Prometheus 提供指标数据了。Prometheus 官方为许多应用就提供了对应的 exporter 应用,也有许多第三方的实现,我们可以前往官方网站进行查看:exporters,当然如果你的应用本身也没有 exporter 实现,那么就要我们自己想办法去实现一个 /metrics 接口了,只要你能提供一个合法的 /metrics 接口,Prometheus 就可以监控你的应用。
比如我们这里通过一个 redis-exporter 的服务来监控 redis 服务,对于这类应用,我们一般会以 sidecar 的形式和主应用部署在同一个 Pod 中,比如我们这里来部署一个 redis 应用,并用 redis-exporter 的方式来采集监控数据供 Prometheus 使用,如下资源清单文件:(prome-redis.yaml)
apiVersion: apps/v1
kind: Deployment
metadata:
  name: redis
  namespace: kube-mon
spec:
  selector:
    matchLabels:
      app: redis
  template:
    metadata:
      labels:
        app: redis
    spec:
      containers:
      - name: redis
        image: redis:4
        resources:
          requests:
            cpu: 100m
            memory: 100Mi
        ports:
        - containerPort: 6379
      - name: redis-exporter
        image: oliver006/redis_exporter:latest
        resources:
          requests:
            cpu: 100m
            memory: 100Mi
        ports:
        - containerPort: 9121
---
kind: Service
apiVersion: v1
metadata:
  name: redis
  namespace: kube-mon
spec:
  selector:
    app: redis
  ports:
  - name: redis
    port: 6379
    targetPort: 6379
  - name: prom
    port: 9121
    targetPort: 9121
可以看到上面我们在 redis 这个 Pod 中包含了两个容器,一个就是 redis 本身的主应用,另外一个容器就是 redis_exporter。现在直接创建上面的应用:
$ kubectl apply -f prome-redis.yaml
deployment.apps/redis created
service/redis created
创建完成后,我们可以看到 redis 的 Pod 里面包含有两个容器:
$ kubectl get pods -n kube-mon
NAME                          READY   STATUS    RESTARTS   AGE
prometheus-79b8774f68-7m8zr   1/1     Running   0          54m
redis-7c8bdd45cc-ssjbz        2/2     Running   0          2m1s
$ kubectl get svc -n kube-mon
NAME         TYPE        CLUSTER-IP     EXTERNAL-IP   PORT(S)             AGE
prometheus   NodePort    10.96.194.29           9090:30980/TCP      15h
redis        ClusterIP   10.110.14.69           6379/TCP,9121/TCP   2m14s
我们可以通过 9121 端口来校验是否能够采集到数据:
$ curl 10.110.14.69:9121/metrics
# HELP go_gc_duration_seconds A summary of the GC invocation durations.
# TYPE go_gc_duration_seconds summary
go_gc_duration_seconds{quantile="0"} 0
go_gc_duration_seconds{quantile="0.25"} 0
go_gc_duration_seconds{quantile="0.5"} 0
go_gc_duration_seconds{quantile="0.75"} 0
go_gc_duration_seconds{quantile="1"} 0
go_gc_duration_seconds_sum 0
go_gc_duration_seconds_count 0
......
# HELP redis_up Information about the Redis instance
# TYPE redis_up gauge
redis_up 1
# HELP redis_uptime_in_seconds uptime_in_seconds metric
# TYPE redis_uptime_in_seconds gauge
redis_uptime_in_seconds 100
同样的,现在我们只需要更新 Prometheus 的配置文件:
- job_name: 'redis'
  static_configs:
  - targets: ['redis:9121']
由于我们这里是通过 Service 去配置的 redis 服务,当然直接配置 Pod IP 也是可以的,因为和 Prometheus 处于同一个 namespace,所以我们直接使用 servicename 即可。配置文件更新后,重新加载:
$ kubectl apply -f prometheus-cm.yaml
configmap/prometheus-config configured
# 隔一会儿执行reload操作
$ curl -X POST "http://10.244.3.174:9090/-/reload"
这个时候我们再去看 Prometheus 的 Dashboard 中查看采集的目标数据:
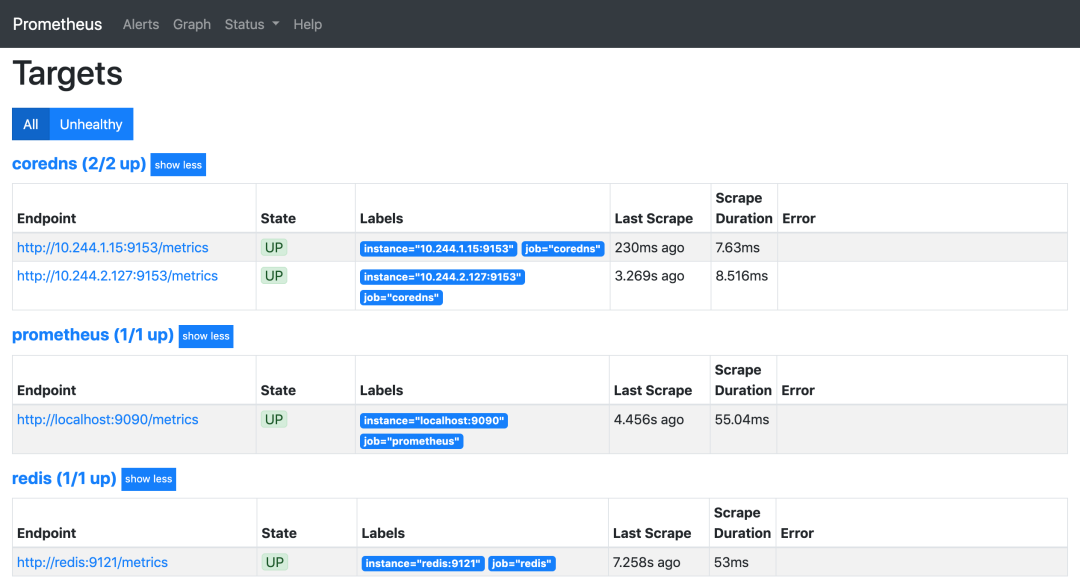
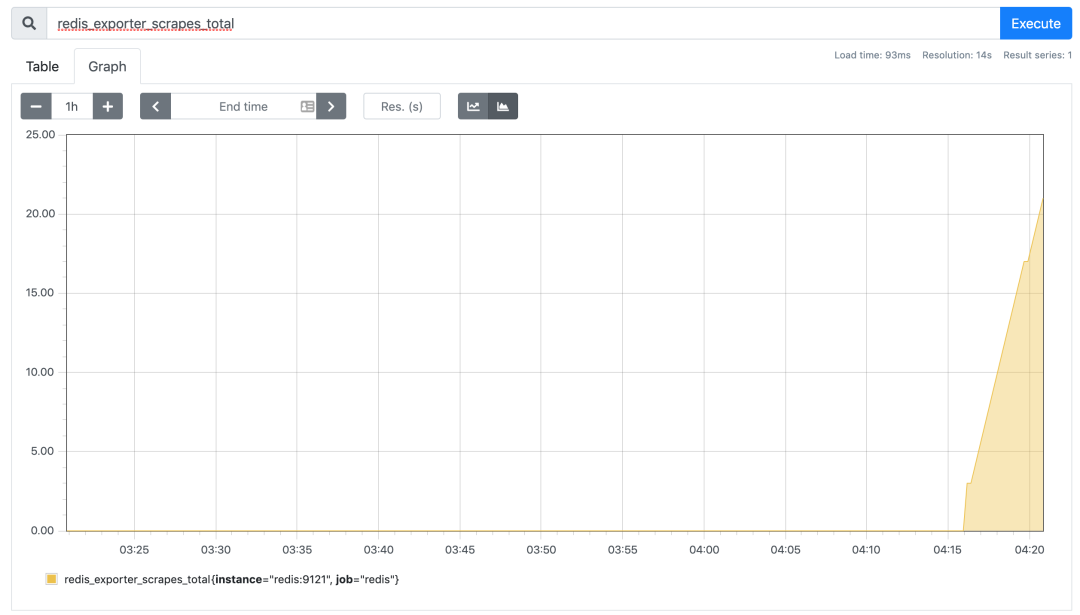
可以看到配置的 redis 这个 job 已经生效了。切换到 Graph 下面可以看到很多关于 redis 的指标数据,我们选择任意一个指标,比如 redis_exporter_scrapes_total,然后点击执行就可以看到对应的数据图表了:
CKA 认证培训

 点击屏末 | 阅读原文 | 即刻学习