
干货分享 | 看如何用Python数据可视化来分析用户留存率,建议收藏


import matplotlib.pyplot as pltimport pandas as pddf = pd.DataFrame({"环节": ["环节一", "环节二", "环节三", "环节四", "环节五"],"人数": [1000, 600, 400, 250, 100],"总体转化率": [1.00, 0.60, 0.40, 0.25, 0.1]})

y = [5,4,3,2,1]x = [85,75,58,43,23]x_max = 100x_min = 0for idx, val in enumerate(x):plt.barh(y[idx], x[idx], left = idx+5)plt.xlim(x_min, x_max)


from matplotlib import font_manager as fm# funnel charty = [5,4,3,2,1]labels = df["环节"].tolist()x = df["人数"].tolist()x_range = 100font = fm.FontProperties(fname="KAITI.ttf")
fig, ax = plt.subplots(1, figsize=(12,6))for idx, val in enumerate(x):left = (x_range - val)/2plt.barh(y[idx], x[idx], left = left, color='#808B96', height=.8, edgecolor='black')plt.text(50, y[idx]+0.1, labels[idx], ha='center',fontproperties=font, fontsize=16, color='#2A2A2A')plt.text(50, y[idx]-0.3, x[idx], ha='center',fontproperties=font, fontsize=16, color='#2A2A2A')if idx != len(x)-1:next_left = (x_range - x[idx+1])/2shadow_x = [left, next_left,100-next_left, 100-left, left]shadow_y = [y[idx]-0.4, y[idx+1]+0.4,y[idx+1]+0.4, y[idx]-0.4, y[idx]-0.4]plt.plot(shadow_x, shadow_y)plt.xlim(x_min, x_max)plt.axis('off')plt.title('每个环节的流失率', fontproperties=font, loc='center', fontsize=24, color='#2A2A2A')plt.show()

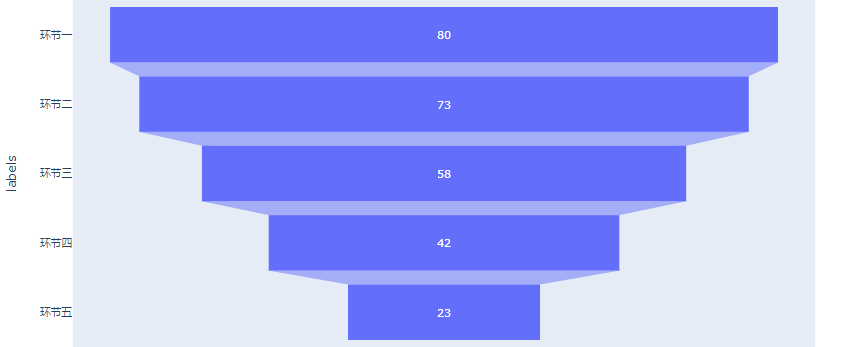
import plotly.express as pxdata = dict(values=[80,73,58,42,23],labels=['环节一', '环节二', '环节三', '环节四', '环节五'])fig = px.funnel(data, y='labels', x='values')fig.show()
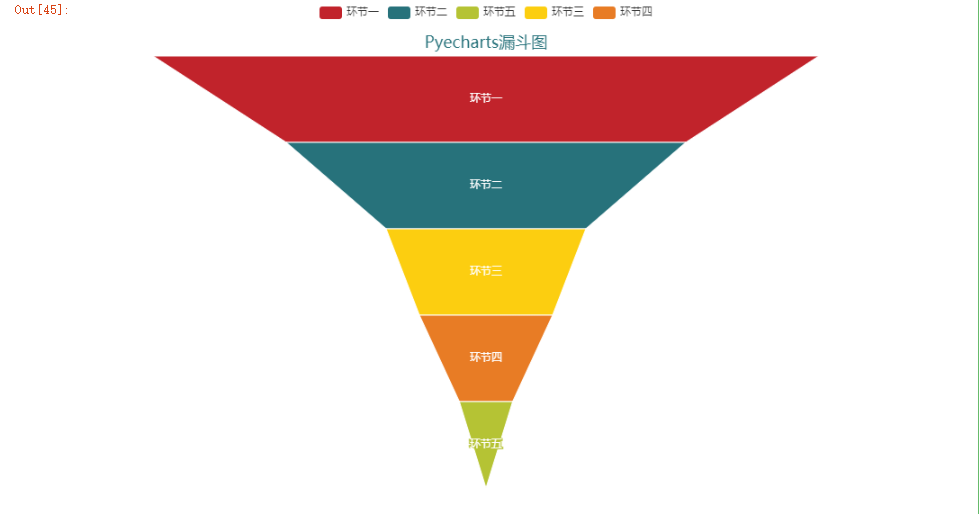
最后我们用pyecharts模块来绘制一下,当中有专门用来绘制“漏斗图”的方法,我们只需要调用即可
from pyecharts.charts import Funnelfrom pyecharts import options as optsfrom pyecharts.globals import ThemeTypec = (Funnel(init_opts=opts.InitOpts(width="900px", height="600px",theme = ThemeType.INFOGRAPHIC )).add("环节",df[["环节","总体转化率"]].values,sort_="descending",label_opts=opts.LabelOpts(position="inside"),).set_global_opts(title_opts=opts.TitleOpts(title="Pyecharts漏斗图", pos_bottom = "90%", pos_left = "center")))c.render_notebook()
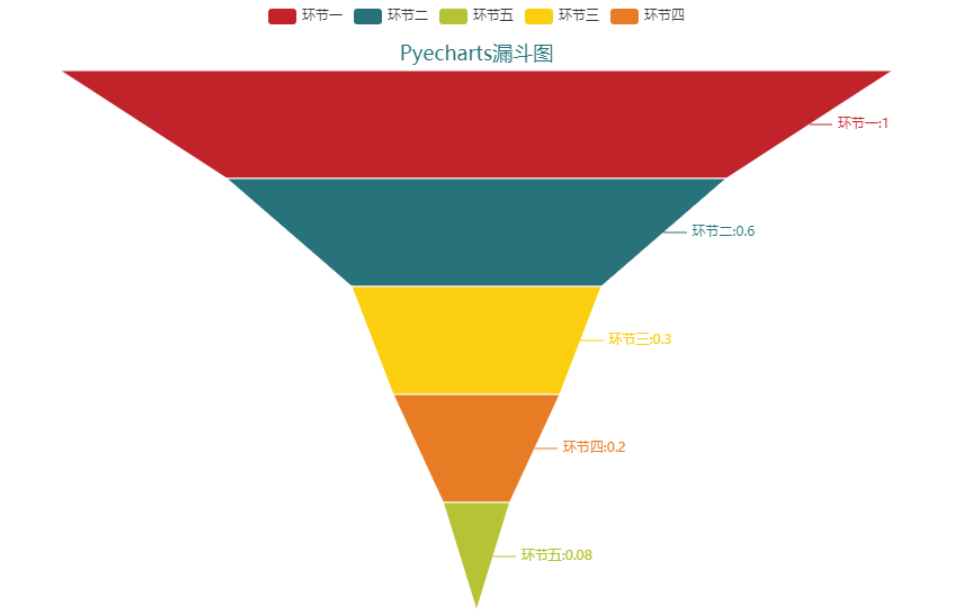
我们将数据标注上去之后
c = (Funnel(init_opts=opts.InitOpts(width="900px", height="600px",theme = ThemeType.INFOGRAPHIC )).add("商品",df[["环节","总体转化率"]].values,sort_="descending",label_opts=opts.LabelOpts(position="inside"),).set_global_opts(title_opts=opts.TitleOpts(title="Pyecharts漏斗图", pos_bottom = "90%", pos_left = "center")).set_series_opts(label_opts=opts.LabelOpts(formatter="{b}:{c}")))c.render_notebook()
评论