
用Python优雅地制作动态条形图
公众号“算法美食屋”后台回复关键字:动态图,可添加作者微信获取完整代码和人口数据集。
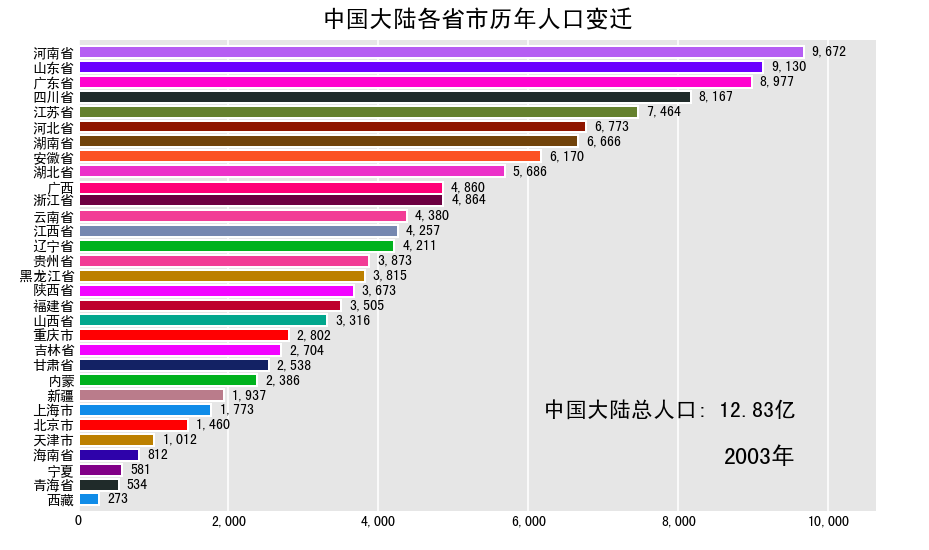
先上图片:
再上视频:
最后上代码:
import numpy as np
import pandas as pd
import pandas_alive
from matplotlib import pyplot as plt
import imageio

plt.rcParams['animation.writer'] = 'html'
plt.rcParams['font.family'] = ['sans-serif']
plt.rcParams['font.sans-serif'] = ['SimHei']

def html_to_gif(html_file, gif_file, duration=0.1):
    path = html_file.replace(".html","_frames")
    images = [os.path.join(path,x) for x in sorted(os.listdir(path))]
    frames = [imageio.imread(x) for x in images]
    imageio.mimsave(gif_file, frames, 'gif', duration=duration)
    return gif_file


df = pd.read_csv('./data/pop_amount.csv')
df["year"] = [str(x) for x in df["year"]]
df['year'] = pd.to_datetime(df['year'])
df = df.set_index("year")
df.columns = [x if "自治区" not in x else x[0:2] for x in df.columns]

html_file = "population_bar_race.html"
gif_file = html_file.replace(".html",".gif")
mp4_file =  html_file.replace(".html",".mp4")

def current_total(values):
    total = values.sum()/10000
    s = '中国大陆总人口: {:.2f}亿'.format(total)
    return {'x': .90, 'y': .2, 's': s, 'ha': 'right', 'size': 11}

chart = df.plot_animated(filename = html_file,title="中国大陆各省市历年人口变迁",
        figsize = (6,4),dpi=144,period_summary_func=current_total,
        n_visible=31,bar_texttemplate = '{x:.0f}',filter_column_colors = True,period_fmt="%Y年")

html_to_gif(html_file,gif_file,duration = 0.1)
主要是使用了pandas_alive这个库的功能,可以非常方便地制作条形图竞赛。
收工。😋
公众号“算法美食屋”后台回复关键字:动态图,可添加作者微信获取完整代码和人口数据集。
评论