如何用Python画出好看的地图

导读:最近正好在学空间数据处理,本文就探讨一下用Python如何画出好看的地图。
folium Plotly GeoPandas+Matplotlib
01 folium
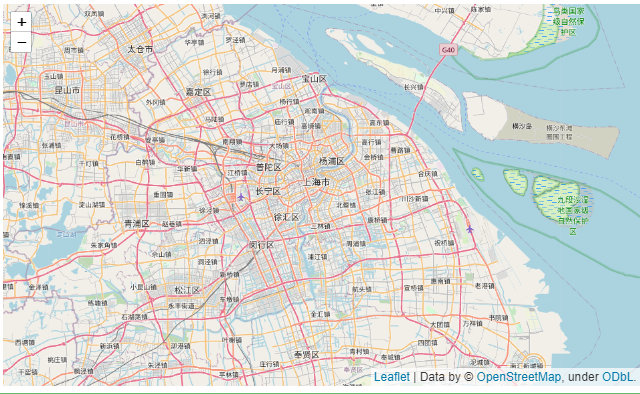
1import folium
2import pandas as pd
3#输入上海经纬度,尺度
4latitude = 31.2
5longitude = 121.5
6sh_map = folium.Map(location=[latitude, longitude], zoom_start=10)
7sh_map
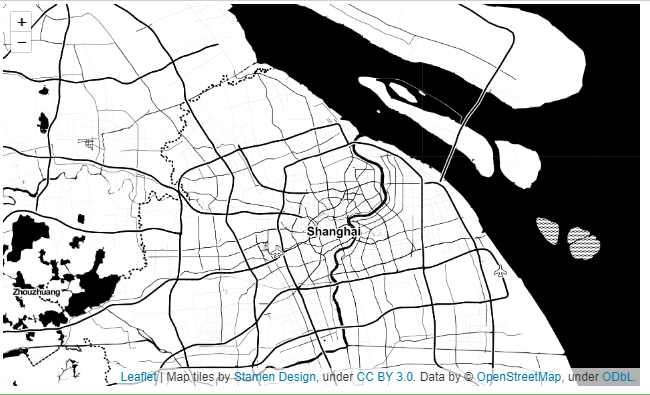
1sh_map = folium.Map(location=[latitude, longitude], zoom_start=10,tiles='Stamen Toner')
2sh_map

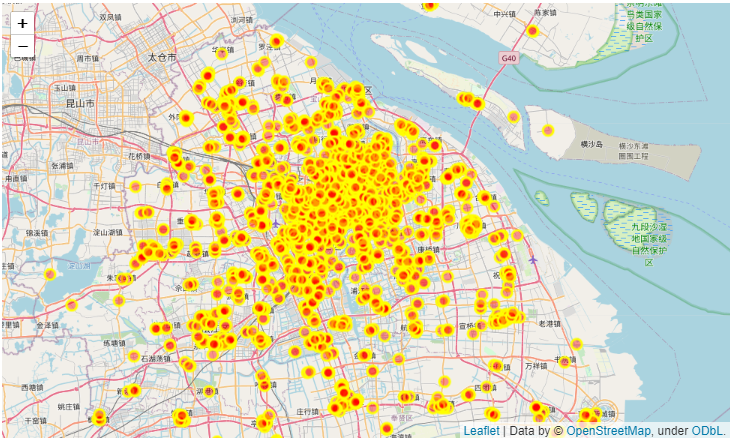
 1# 创建特征组
 2hotpots = folium.map.FeatureGroup()
 3# Loop through the 200 crimes and add each to the incidents feature group
 4for lat, lng, in zip(data.lat, data.lon):
 5    hotpots.add_child(
 6        folium.CircleMarker(
 7            [lat, lng],
 8            radius=7, # define how big you want the circle markers to be
 9            color='yellow',
10            fill=True,
11            fill_color='red',
12            fill_opacity=0.4
13        )
14    )
15
16# 把火锅特征组放到上海地图上
17sh_map =folium.Map(location=[latitude, longitude], zoom_start=10)
18sh_map.add_child(hotpots)
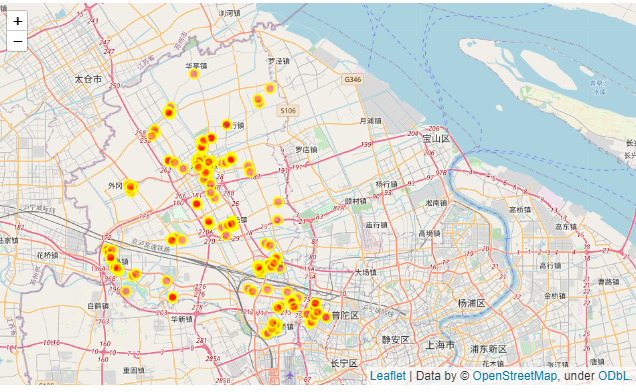
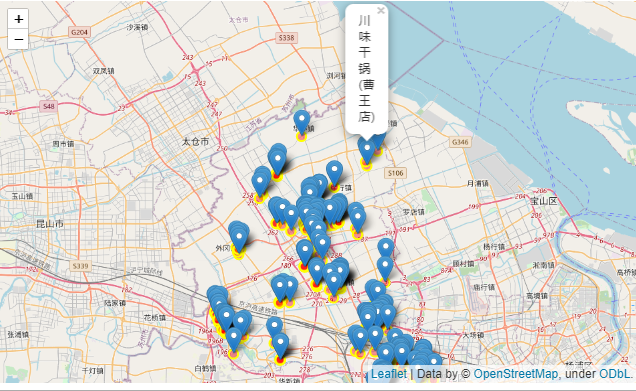
1latitudes = list(datas.lat)
2longitudes = list(datas.lon)
3labels = list(datas.name)
4for lat, lng, label in zip(latitudes, longitudes, labels):
5    folium.Marker([lat, lng], popup=label).add_to(sh_map)
6sh_map
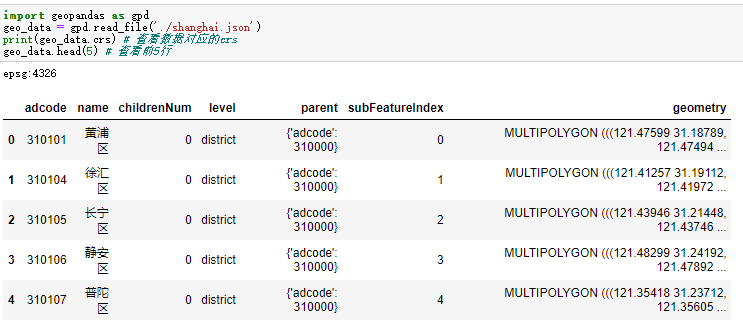
1hots=data.groupby('adname',as_index=False).agg({'name':"count"})
2hots.columns=['district','num']
3hots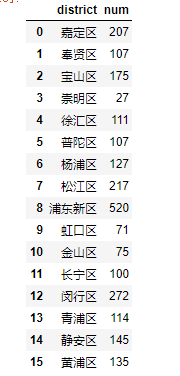

 1#输入上海经纬度,尺度
 2latitude = 31.2
 3longitude = 121.5
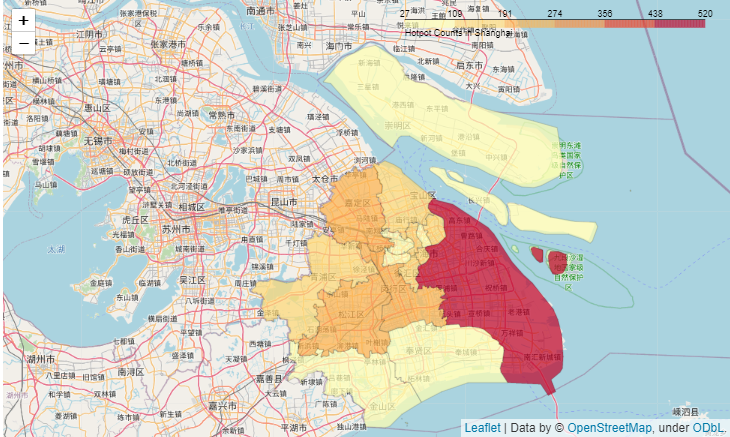
 4map = folium.Map(location=[latitude, longitude], zoom_start=12)
 5folium.Choropleth(
 6    geo_data=geo_data,
 7    data=hots,
 8    columns=['district','num'],
 9    key_on='feature.properties.name',
10    #fill_color='red',
11    fill_color='YlOrRd',
12    fill_opacity=0.7,
13    line_opacity=0.2,
14    highlight=True,
15    legend_name='Hotpot Counts in Shanghai'
16).add_to(map)
17map
02 Plotly
 1import plotly.express as px
 2import plotly.graph_objs as go
 3latitude = 31.2
 4longitude = 121.5
 5fig = px.choropleth_mapbox(
 6    data_frame=hots,
 7    geojson=geo_data,
 8    color='num',
 9    locations="district",
10    featureidkey="properties.name",
11    mapbox_style="carto-positron",
12    color_continuous_scale='viridis',
13    center={"lat": latitude, "lon": longitude},
14    zoom=7.5,
15)
16fig.update_layout(margin={"r":0,"t":0,"l":0,"b":0})
17fig.show()
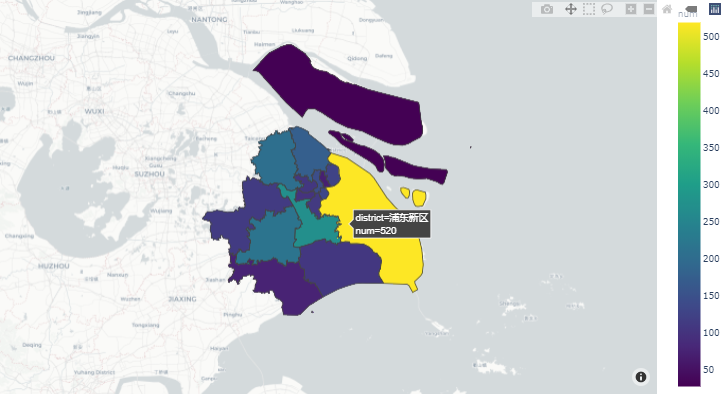
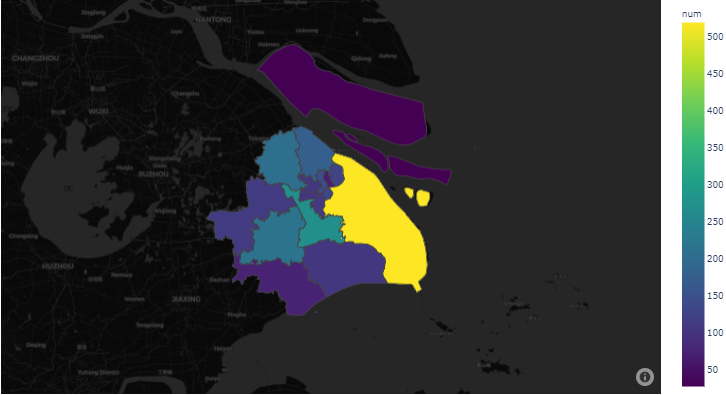
03 GeoPandas+Matplotlib
 1import matplotlib.pyplot as plt
 2import matplotlib as mpl
 3# 中文和负号的正常显示
 4mpl.rcParams['font.sans-serif'] = ['Times New Roman']
 5mpl.rcParams['font.sans-serif'] = [u'SimHei']
 6mpl.rcParams['axes.unicode_minus'] = False
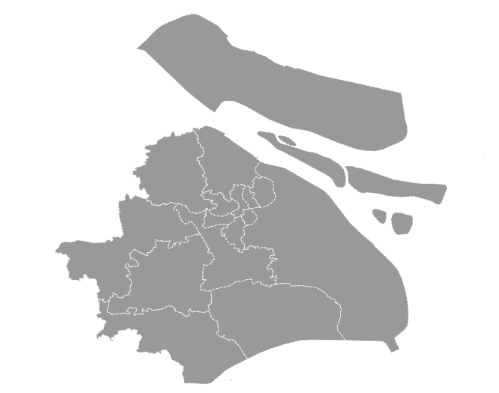
 7# 裁剪上海shape
 8fig, ax = plt.subplots(figsize=(20, 10))
 9ax=geo_data.plot(ax=ax,facecolor='grey',edgecolor='white',linestyle='--',alpha=0.8)
10ax.axis('off') # 移除坐标轴
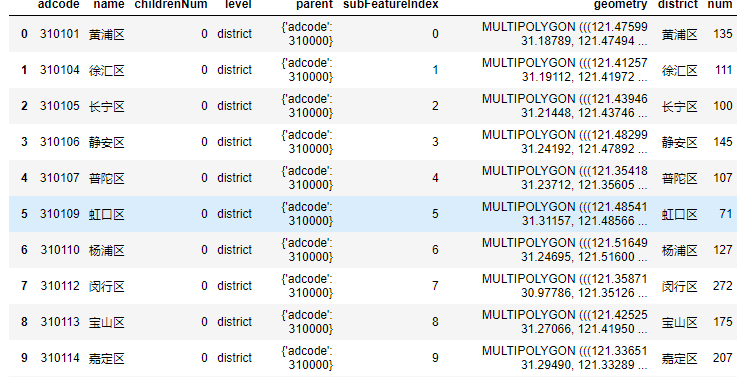
1need_data=pd.merge(geo_data,hots[['district','num']],left_on='name',
2                 right_on='district')
3need_data
1need_data = gpd.GeoDataFrame(need_data)
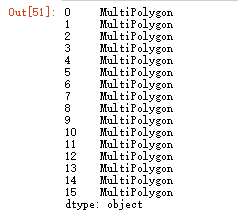
2need_data.geom_type
1fig, ax = plt.subplots(figsize=(20, 10))
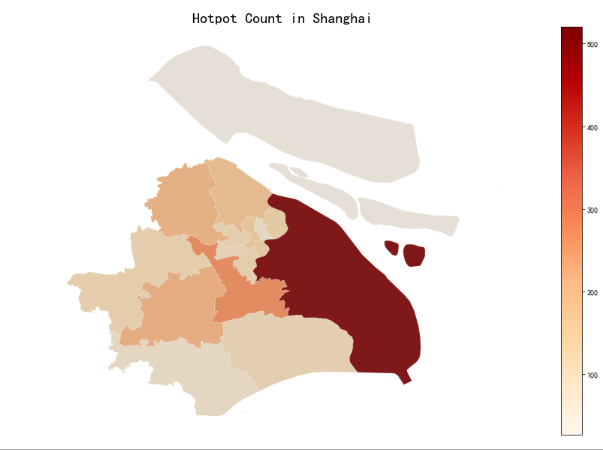
2need_data.plot('num', cmap='OrRd',ax=ax)
3ax.axis('off') # 移除坐标轴
4cmap = mpl.cm.get_cmap('OrRd')
5norm = mpl.colors.Normalize(min(need_data['num']), max(need_data['num']))
6fcb = fig.colorbar(mpl.cm.ScalarMappable(norm=norm, cmap=cmap),ax=ax)
7ax=geo_data.plot(ax=ax,facecolor='grey',edgecolor='white',linestyle='--',alpha=0.2)
8ax.set_title('Hotpot Count in Shanghai', fontsize=20)
 1fig, ax = plt.subplots(figsize=(20, 10))
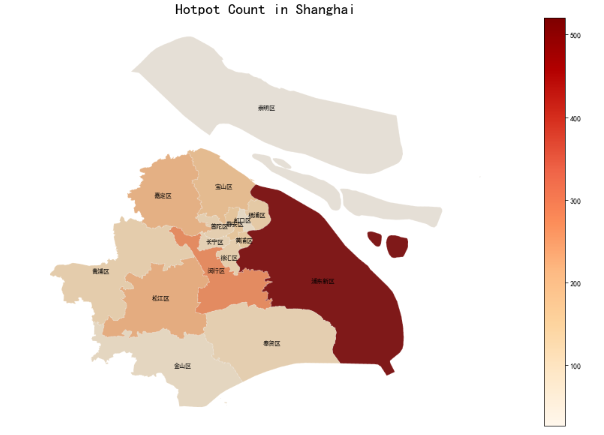
 2need_data.plot('num', cmap='OrRd',ax=ax)
 3for idx, _ in enumerate(need_data.geometry.representative_point()):
 4    # 提取行政区名称
 5    region = need_data.loc[idx, 'name']
 6    ax.text(_.x, _.y, region, ha="center", va="center", size=8)
 7ax.axis('off') # 移除坐标轴
 8cmap = mpl.cm.get_cmap('OrRd')
 9norm = mpl.colors.Normalize(min(need_data['num']), max(need_data['num']))
10fcb = fig.colorbar(mpl.cm.ScalarMappable(norm=norm, cmap=cmap),ax=ax)
11ax=geo_data.plot(ax=ax,facecolor='grey',edgecolor='white',linestyle='--',alpha=0.2)
12ax.set_title('Hotpot Count in Shanghai', fontsize=20)


评论
