
Python实现“神仙趋势”
h1=m日的收盘均价均线h2=n日的h1的均线h3=h日的收盘价均线
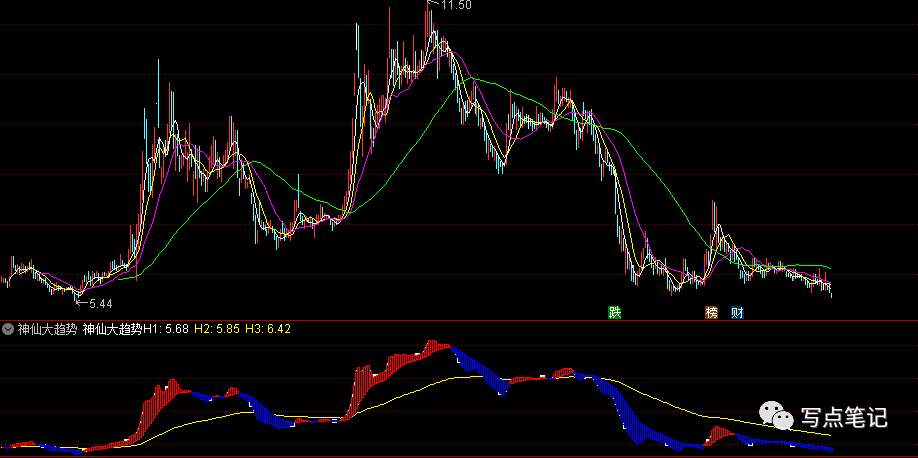
神仙大趋势H1:EMA(CLOSE,6);H2:EMA(神仙大趋势H1,18);H3:EMA(CLOSE,108),COLORYELLOW;STICKLINE(神仙大趋势H1>H2,神仙大趋势H1,H2,1,1),COLORRED;STICKLINE(神仙大趋势H1<H2,神仙大趋势H1,H2,1,1),COLORBLUE;
#神仙趋势线result['h1']=talib.EMA(result['close'],6)result['h2']=talib.EMA(result['h1'],18)result['h3']=talib.EMA(result['close'],108)
testX = []H1 = []H2 = []H3 = []for index, row in result.iterrows():currentIndex = index - self.queryStock.starttestX.append(currentIndex)tempH1 = row['h1']tempH2 = row['h2']tempH3 = row['h3']H1.append(float(tempH1))H2.append(float(tempH2))H3.append(float(tempH3))
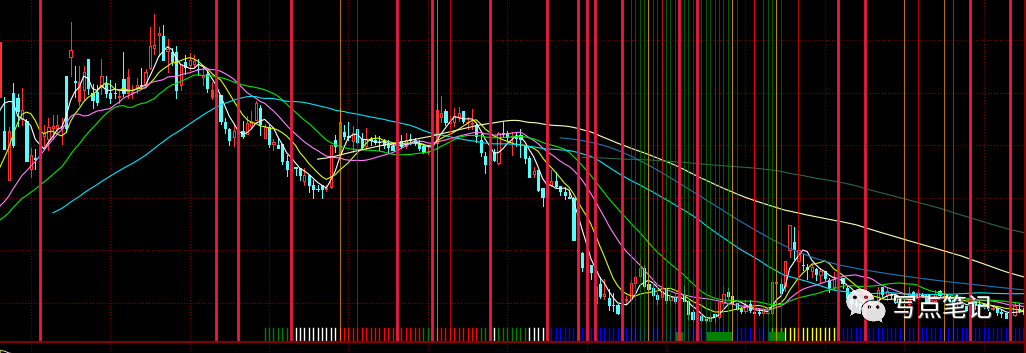
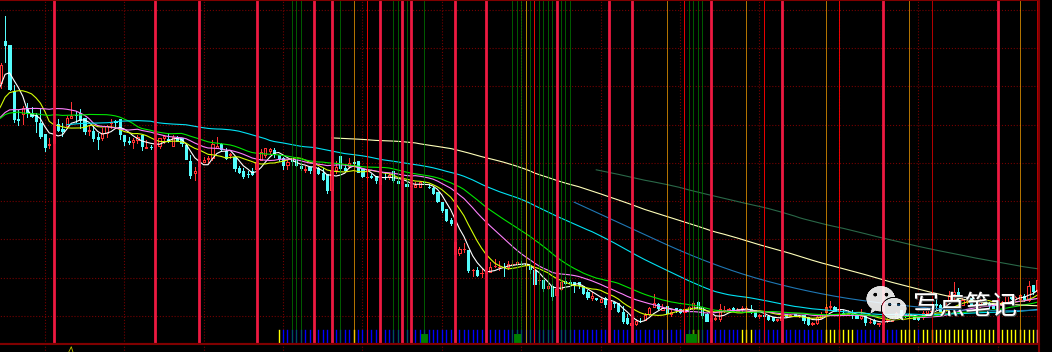
#神仙趋势线def shenxianQS(self, testX, H1, H2, H3):self.ax4.plot(testX, H1, c="red", label='h1')self.ax4.plot(testX, H2, c="green", label='h2')self.ax4.plot(testX, H3, c="yellow", label='h3')for i in range(len(testX)):if H1[i]!=None and H2[i]!=None and H3[i]!=None:#强上涨if H1[i]>H2[i] and H3[i]<H2[i]:self.ax1.axvline(i, ls='-', c='red', ymin=0, ymax=0.04, lw=1)#强下跌if H1[i]<H2[i] and H3[i]>H2[i]:self.ax1.axvline(i, ls='-', c='blue', ymin=0, ymax=0.04, lw=1)#弱上涨if H1[i]>H2[i] and H3[i]>H1[i]:self.ax1.axvline(i, ls='-', c='yellow', ymin=0, ymax=0.04, lw=1)#弱下跌if H1[i]<H2[i] and H3[i]<H1[i]:self.ax1.axvline(i, ls='-', c='green', ymin=0, ymax=0.04, lw=1)#中性盘if H1[i]>H3[i] and H3[i]>H2[i] or H2[i]>H3[i] and H3[i]>H1[i]:self.ax1.axvline(i, ls='-', c='white', ymin=0, ymax=0.04, lw=1)
评论