
可视化应用案例 | 气象绘图技巧大汇总
大家好,欢迎来到 Crossin的编程教室 !
之前有同学私信问有没有关于气象绘图的可视化资源?读者的需求就是作者的追求,于是赶快把我收藏的一个关于气象可视化作品集的优质资源整理分享出来了。
今天就来介绍下这个Python气象可视化的优质资源:cf-plot
简单介绍+示例展示,让小伙伴们更好地理解和掌握这个优质的可视化资源。
cf-plot的简单介绍
cf-plot 是一组Python示例教程集合,主要用于制作气候研究中的常见等高线(contour)、矢量(vector)和线图(line plots)等。cf-plot一般使用cf-python来呈现数据和CF属性进行绘图,还可以使用 numpy 数据数组作为输入字段,从而灵活地绘制数据。
更多详细内容可参考:cf-plot介绍[1]。
cf-plot的示例展示
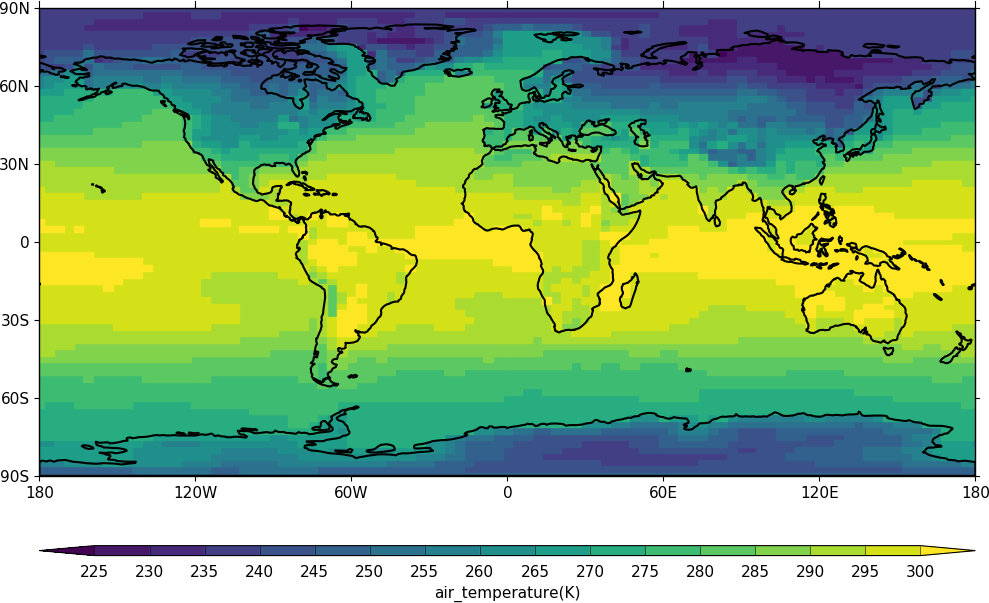
Blockfill plots
块状图
import cf
import cfplot as cfp
f=cf.read('cfplot_data/tas_A1.nc')[0]
cfp.con(f.subspace(time=15), blockfill=True, lines=False)
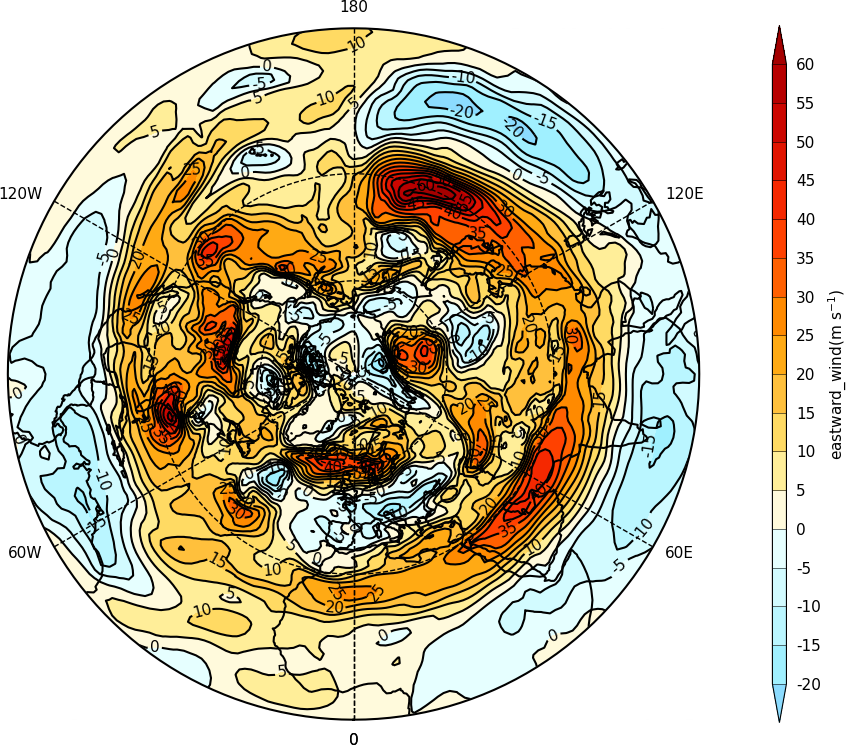
极坐标投影图
import cf
import cfplot as cfp
f=cf.read('cfplot_data/ggap.nc')[1]
cfp.mapset(proj='npstere')
cfp.con(f.subspace(pressure=500))
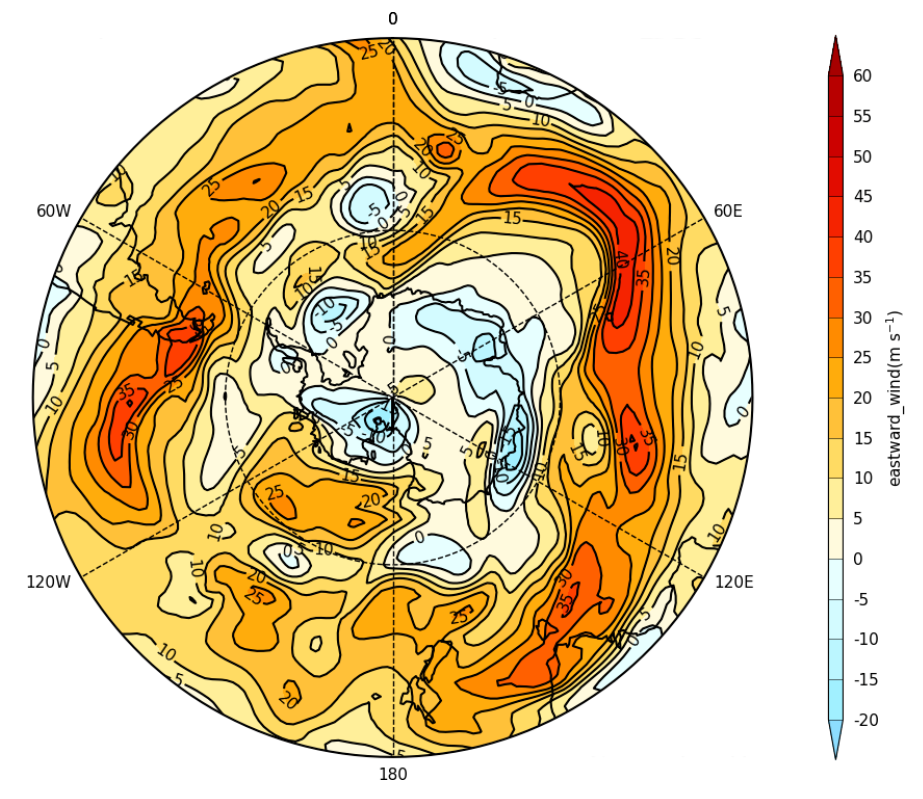
import cf
import cfplot as cfp
f=cf.read('cfplot_data/ggap.nc')[1]
cfp.mapset(proj='spstere', boundinglat=-30, lon_0=0)
cfp.con(f.subspace(pressure=500))
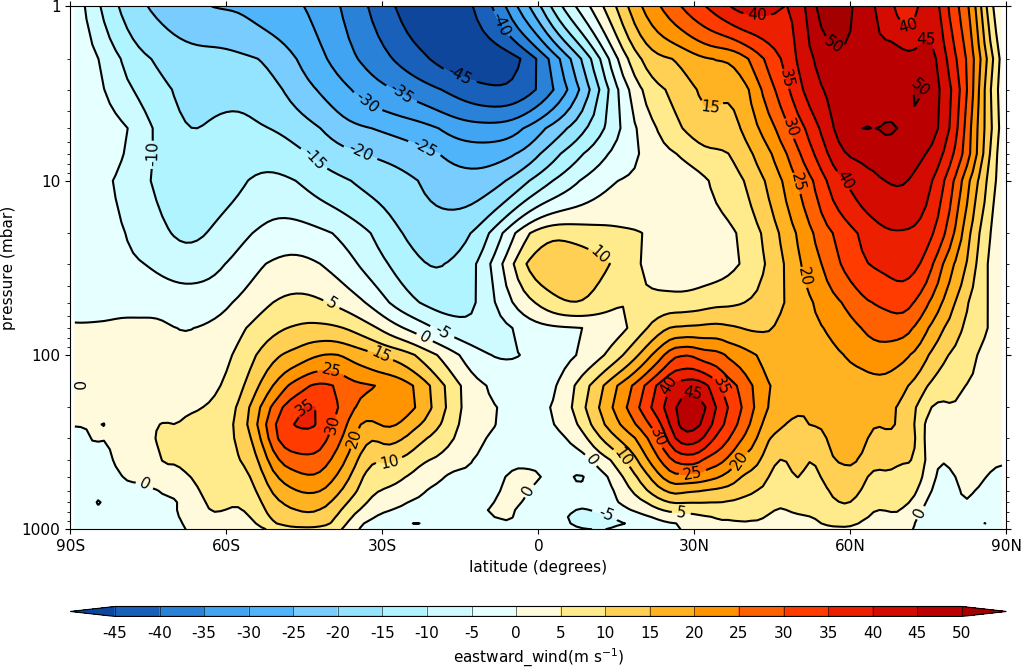
Latitude - Pressure Plots
等压线图
import cf
import cfplot as cfp
f=cf.read('cfplot_data/ggap.nc')[1]
cfp.con(f.collapse('mean','longitude'), ylog=True)
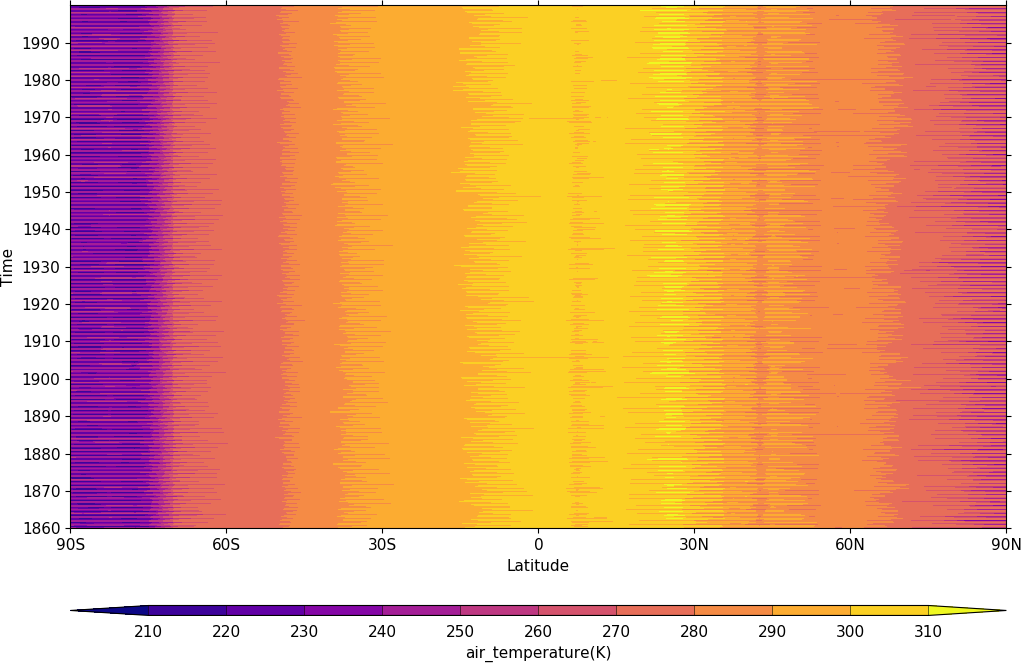
Hovmuller plots
import cf
import cfplot as cfp
f=cf.read('cfplot_data/tas_A1.nc')[0]
cfp.cscale('plasma')
cfp.con(f.subspace(longitude=0), lines=0)
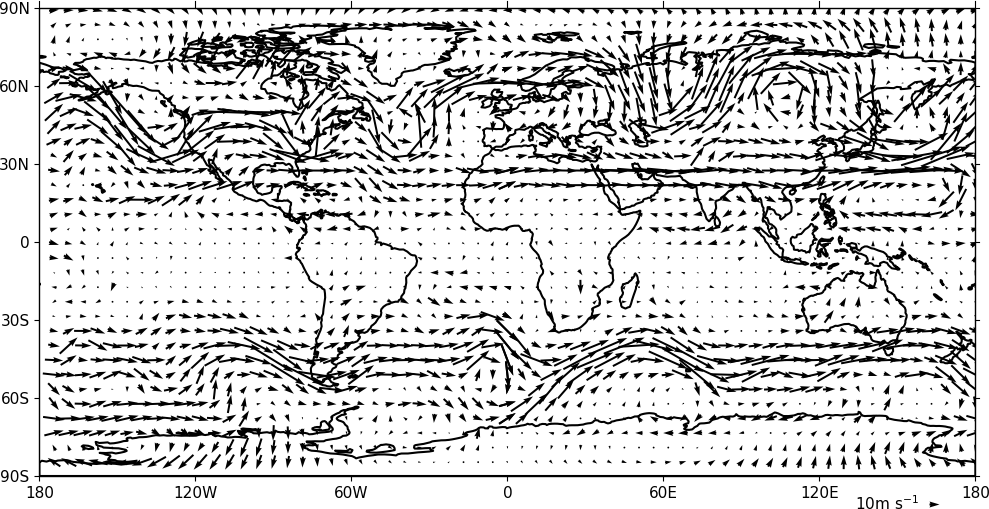
矢量流图
import cf
import cfplot as cfp
f=cf.read('cfplot_data/ggap.nc')
u=f[1].subspace(pressure=500)
v=f[2].subspace(pressure=500)
cfp.vect(u=u, v=v, key_length=10, scale=100, stride=5)
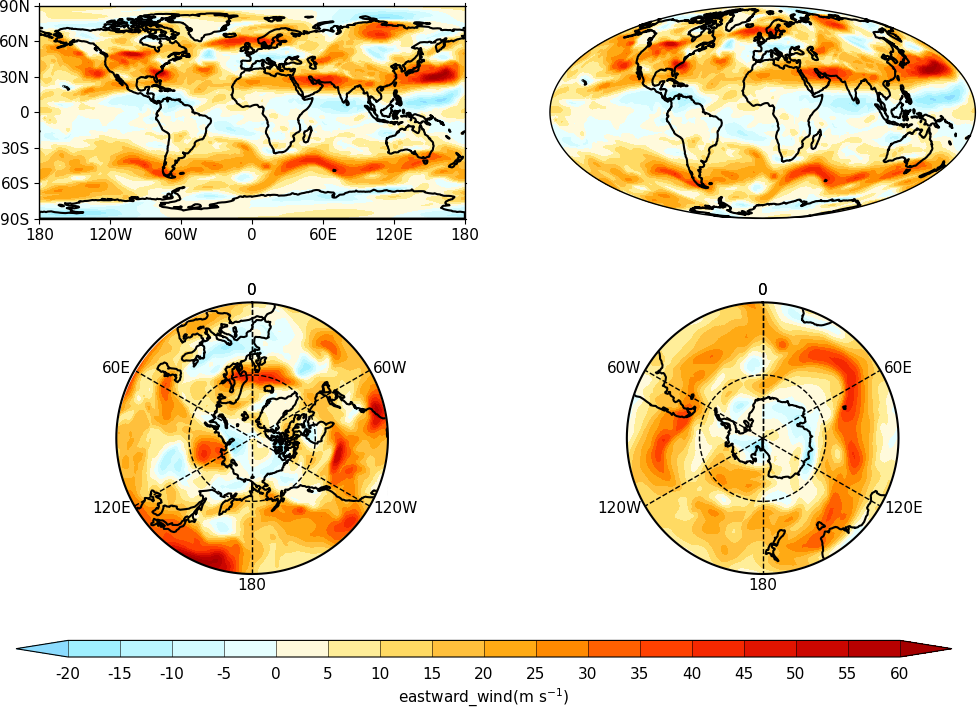
Multiple plots on a page and plot positioning
多图
import cf
import cfplot as cfp
f=cf.read('cfplot_data/ggap.nc')[1]

cfp.gopen(rows=2, columns=2, bottom=0.2)
cfp.gpos(1)
cfp.con(f.subspace(pressure=500), lines=False, colorbar=None)
cfp.gpos(2)
cfp.mapset(proj='moll')
cfp.con(f.subspace(pressure=500), lines=False, colorbar=None)
cfp.gpos(3)
cfp.mapset(proj='npstere', boundinglat=30, lon_0=180)
cfp.con(f.subspace(pressure=500), lines=False, colorbar=None)
cfp.gpos(4)
cfp.mapset(proj='spstere', boundinglat=-30, lon_0=0)
cfp.con(f.subspace(pressure=500), lines=False, colorbar_position=[0.1, 0.1, 0.8, 0.02],
        colorbar_orientation='horizontal')
cfp.gclose()
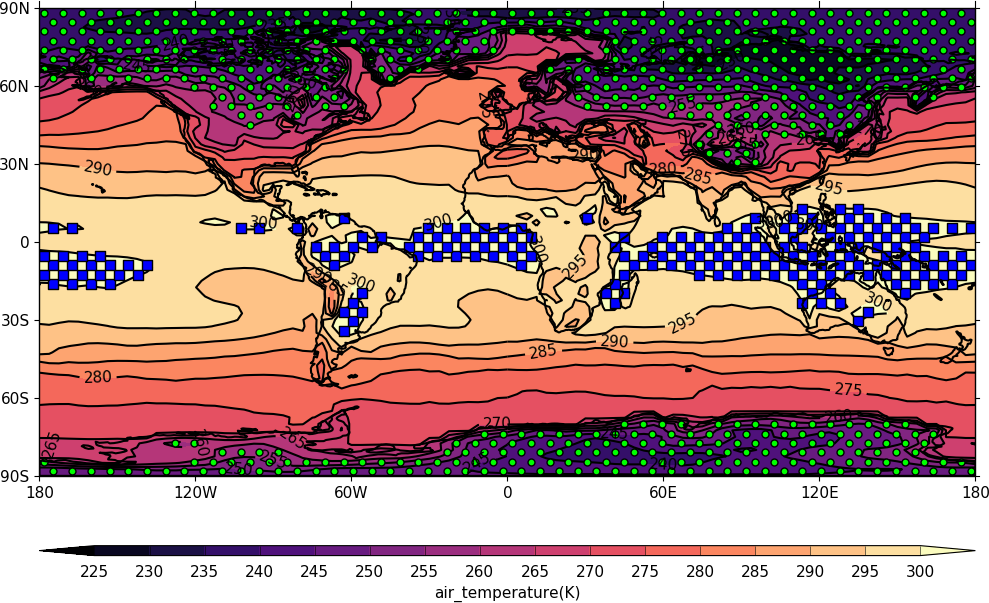
Stipple plots
点状图
import cf
import cfplot as cfp
f=cf.read('cfplot_data/tas_A1.nc')[0]
g=f.subspace(time=15)
cfp.gopen()
cfp.cscale('magma')
cfp.con(g)
cfp.stipple(f=g, min=220, max=260, size=100, color='#00ff00')
cfp.stipple(f=g, min=300, max=330, size=50, color='#0000ff', marker='s')
cfp.gclose()
以上就是关于cf-plot的具体示例介绍,更多其他案例可查阅:cf-plot示例[2]
总结
今天给大家介绍了一个优秀的关于气象领域的可视化工具cf-plot 及其优秀的示例,希望大家可以从中学习到绘图技巧和绘图灵感。
参考资料
cf-plot介绍: http://ajheaps.github.io/cf-plot/
[2]cf-plot示例: http://ajheaps.github.io/cf-plot/gallery.html
如果文章对你有帮助,欢迎转发/点赞/收藏~
作者:宁俊骐
_往期文章推荐_
评论