
R语言中的Theil-Sen回归分析

          来源:拓端数据部落


          本文约1000字,建议阅读5分钟


          Theil-Sen估计器是一种在社会科学中不常用的简单线性回归估计器。
在数据中所有点之间绘制一条线
计算每条线的斜率
中位数斜率是回归斜率
用这种方法计算斜率非常可靠。当误差呈正态分布且没有异常值时,斜率与OLS非常相似。
相关视频
有几种获取截距的方法。如果关心回归中的截距,那么知道软件在做什么是很合理的。
当我对异常值和异方差性有担忧时,请在上方针对Theil-Sen进行简单线性回归的评论。
我进行了一次模拟,以了解Theil-Sen如何在异方差下与OLS比较。它是更有效的估计器。
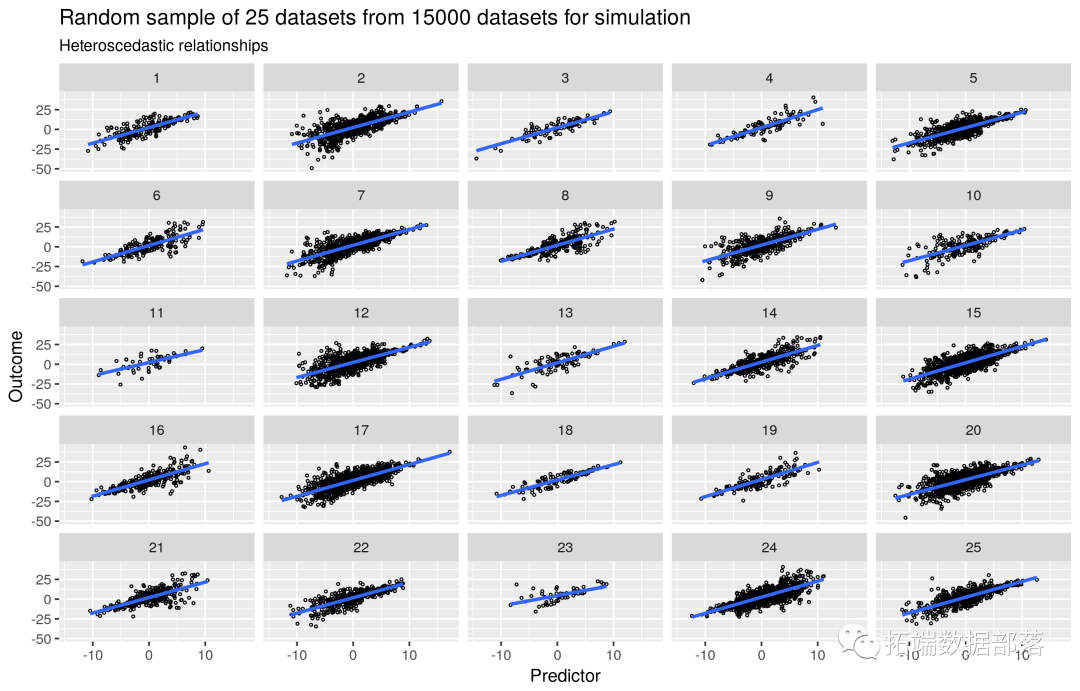
library(simglm)library(ggplot2)library(dplyr)library(WRS)# HeteronRep <- 100n.s <- c(seq(50, 300, 50), 400, 550, 750, 1000)samp.dat <- sample((1:(nRep*length(n.s))), 25)lm.coefs.0 <- matrix(ncol = 3, nrow = nRep*length(n.s))ts.coefs.0 <- matrix(ncol = 3, nrow = nRep*length(n.s))lmt.coefs.0 <- matrix(ncol = 3, nrow = nRep*length(n.s))dat.s <- list()ggplot(dat.frms.0, aes(x = age, y = sim_data)) +geom_point(shape = 1, size = .5) +geom_smooth(method = "lm", se = FALSE) +facet_wrap(~ random.sample, nrow = 5) +labs(x = "Predictor", y = "Outcome",title = "Random sample of 25 datasets from 15000 datasets for simulation",subtitle = "Heteroscedastic relationships")
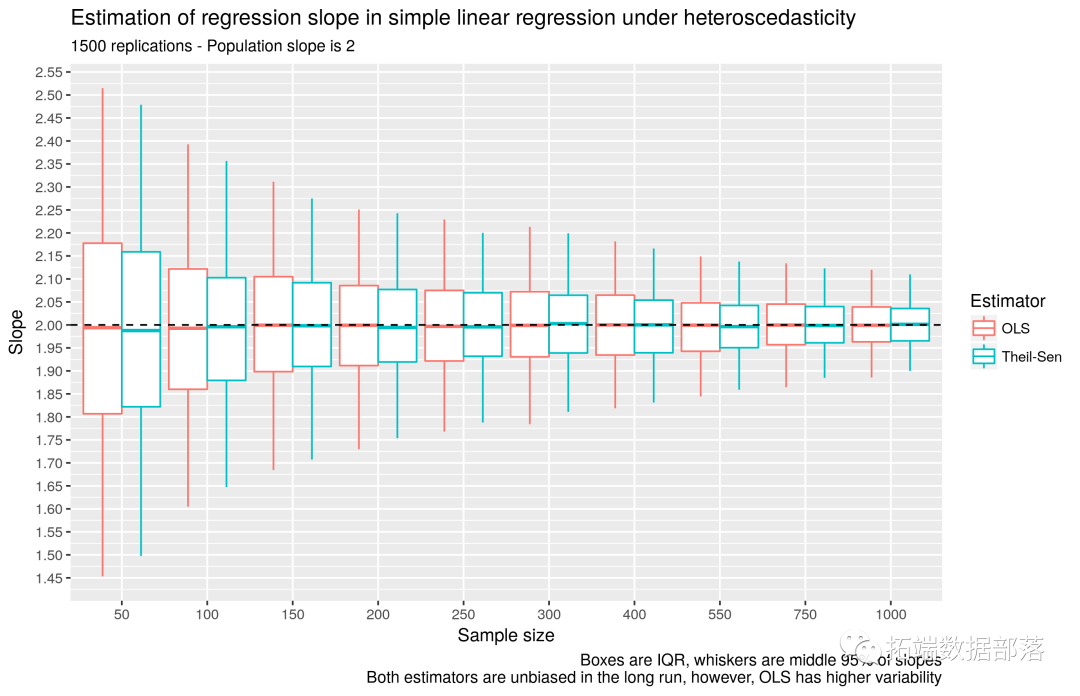
ggplot(coefs.0, aes(x = n, colour = Estimator)) +geom_boxplot(aes(ymin = q025, lower = q25, middle = q50, upper = q75, ymax = q975), data = summarise(group_by(coefs.0, n, Estimator), q025 = quantile(Slope, .025),q25 = quantile(Slope, .25), q50 = quantile(Slope, .5),q75 = quantile(Slope, .75), q975 = quantile(Slope, .975)), stat = "identity") +geom_hline(yintercept = 2, linetype = 2) + scale_y_continuous(breaks = seq(1, 3, .05)) +labs(x = "Sample size", y = "Slope",title = "Estimation of regression slope in simple linear regression under heteroscedasticity",subtitle = "1500 replications - Population slope is 2",caption = paste("Boxes are IQR, whiskers are middle 95% of slopes","Both estimators are unbiased in the long run, however, OLS has higher variability",sep = "\n"))
原文链接:http://tecdat.cn/?p=10080
编辑:于腾凯
校对:林亦霖
评论