这可能是最强的Python可视化神器,建议一试!
1. Plotly

from plotly.graph_objs import Scatter,Layout
import plotly
import plotly.offline as py
import numpy as np
import plotly.graph_objs as go
#setting offilne 离线模式
plotly.offline.init_notebook_mode(connected=True)
2. 制作折线图
N = 100
random_x = np.linspace(0,1,N)
random_y0 = np.random.randn(N)+5
random_y1 = np.random.randn(N)
random_y2 = np.random.randn(N)-5

#Create traces
trace0 = go.Scatter(
    x = random_x,
    y = random_y0,
    mode = 'markers',
    name = 'markers'
)
trace1 = go.Scatter(
    x = random_x,
    y = random_y1,
    mode = 'lines+markers',
    name = 'lines+markers'
)
trace2 = go.Scatter(
    x = random_x,
    y = random_y2,
    mode = 'lines',
    name = 'lines'
)
data = [trace0,trace1,trace2]
py.iplot(data)

绘制的图片系统默认配色也挺好看的~
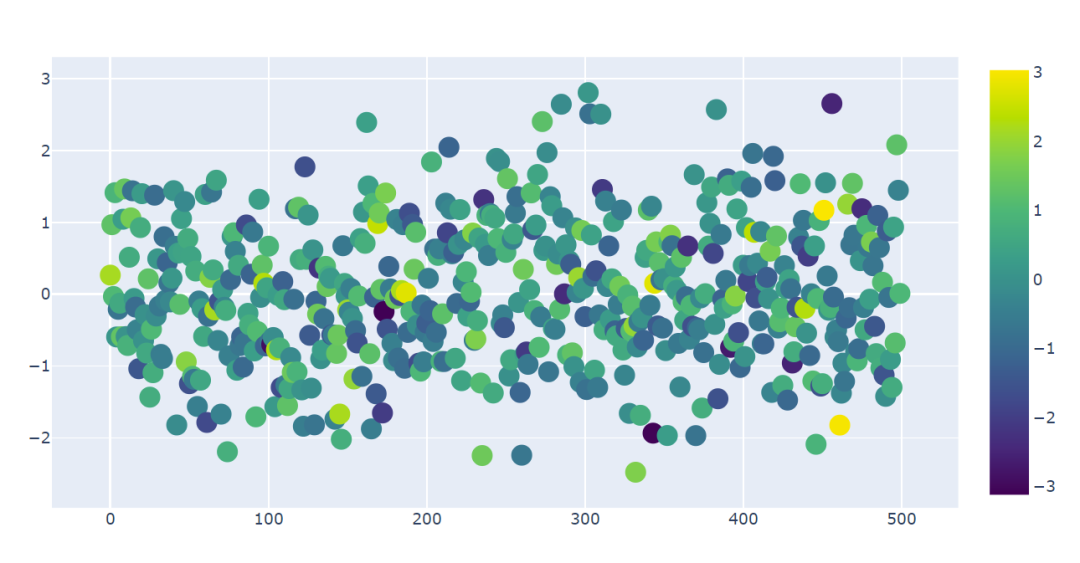
3. 制作散点图
trace1 = go.Scatter(
     y = np.random.randn(500),
    mode = 'markers',
    marker = dict(
        size = 16,
        color = np.random.randn(500),
        colorscale = 'Viridis',
        showscale = True
    )
)
data = [trace1]
py.iplot(data)

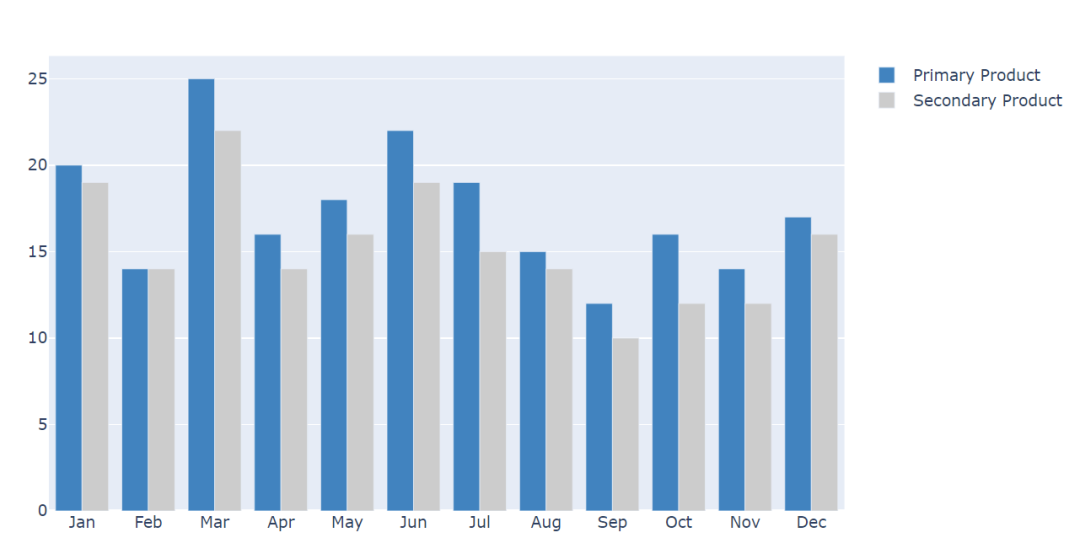
4. 直方图
trace0 = go.Bar(
    x = ['Jan','Feb','Mar','Apr', 'May','Jun',
         'Jul','Aug','Sep','Oct','Nov','Dec'],
    y = [20,14,25,16,18,22,19,15,12,16,14,17],
    name = 'Primary Product',
    marker=dict(
        color = 'rgb(49,130,189)'
    )
)
trace1 = go.Bar(
    x = ['Jan','Feb','Mar','Apr', 'May','Jun',
         'Jul','Aug','Sep','Oct','Nov','Dec'],
    y = [19,14,22,14,16,19,15,14,10,12,12,16],
    name = 'Secondary Product',
    marker=dict(
        color = 'rgb(204,204,204)'
    )
)
data = [trace0,trace1]
py.iplot(data)
作者:estate47
链接:https://www.jianshu.com/p/e5fb1b5c0957

长按或扫描下方二维码,后台回复:加群,可申请入群。一定要备注:入群+地点+学习/公司。例如:入群+上海+复旦。
您的“点赞/在看/分享/互动”是就是最大支持!
分享
收藏
点赞
在看

评论

